The Milky Way’s Magnetic Personality

[/caption]

Recently we took a look at a very unusual type of map – the Faraday Sky. Now an international team of scientists, including those at the Naval Research Laboratory, have pooled their information and created one of the most high precision maps to date of the Milky Way’s magnetic fields. Like all galaxies, ours has a magnetic “personality”, but just where these fields come from and how they are created is a genuine mystery. Researchers have always simply assumed they were created by mechanical processes like those which occur in Earth’s interior and the Sun. Now a new study will give scientists an even better understanding about the structure of galactic magnetic fields as seen throughout our galaxy.

The team, led by the Max Planck Institute for Astrophysics (MPA), gathered their information and compiled it with theoretical simulations to create yet another detailed map of the magnetic sky. As NRL’s Dr. Tracy Clarke, a member of the research team explains, “The key to applying these new techniques is that this project brings together over 30 researchers with 26 different projects and more than 41,000 measurements across the sky. The resulting database is equivalent to peppering the entire sky with sources separated by an angular distance of two full moons.” This huge amount of data provides a new “all-sky” look which will enable scientists to measure the magnetic structure of the Milky Way in minute detail.
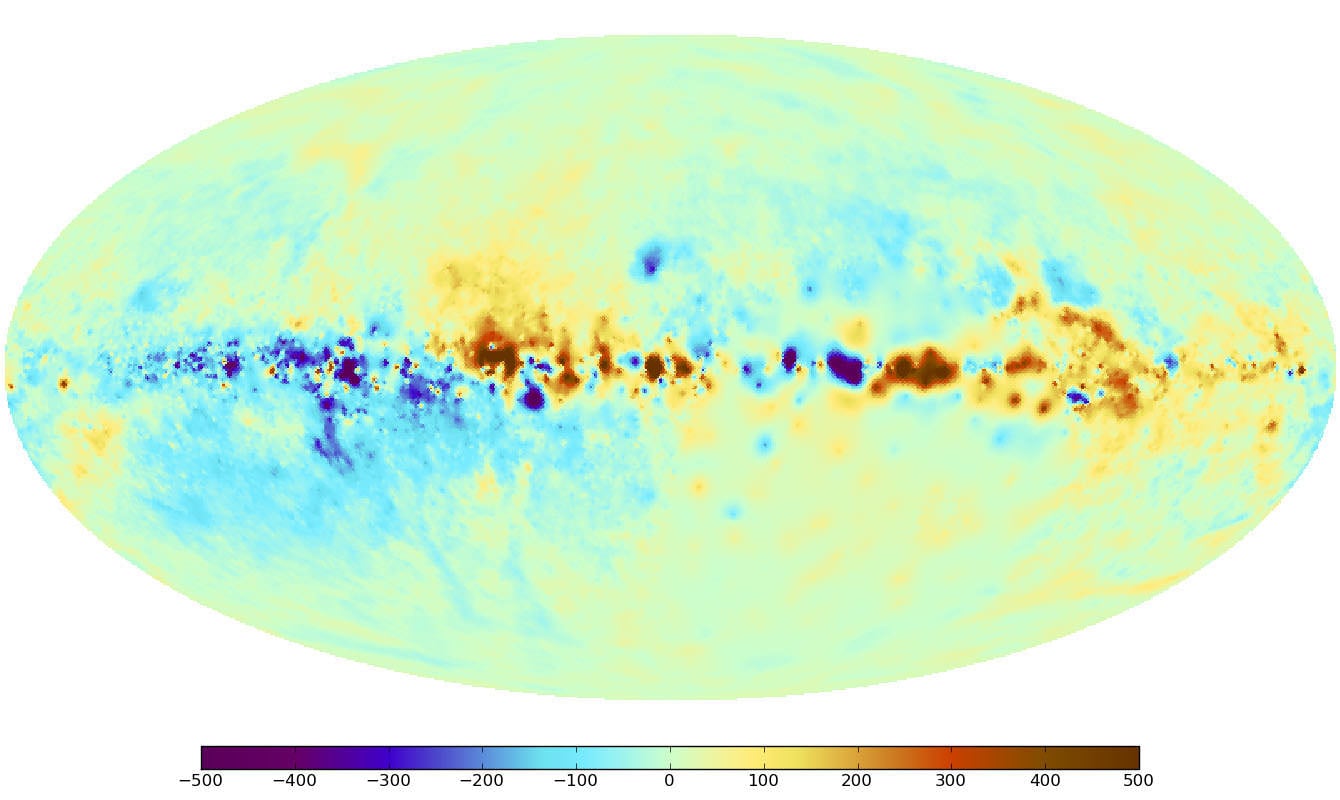
In this map of the sky, a correction for the effect of the Galactic disk has been made in order to emphasize weaker magnetic field structures. The magnetic field directions above and below the disk seem to be diametrically opposed, as indicated by the positive (red) and negative (blue) values. An analogous change of direction takes place across the vertical center line, which runs through the center of the Milky Way. (Image Credit: Max Planck Institute for Astrophysics)
Just what’s so “new” about this map? This time we’re looking at a quantity called Faraday depth – an idea dependent on a line-of-sight information set on the magnetic fields. It was created by combining more than 41,000 singular measurements which were then combined using a new image reconstruction method. In this case, all the researchers at MPA are specialists in the new discipline of information field theory. Dr. Tracy Clarke, working in NRL’s Remote Sensing Division, is part of the team of international radio astronomers who provided the radio observations for the database. It’s magnetism on a grand scale… and imparts even the smallest of magnetic features which will enable scientists to further understand the nature of galactic gas turbulence.

The concept of the Faraday effect isn’t new. Scientists have been observing and measuring these fields for the last century and a half. Just how is it done? When polarized light passes through a magnetized medium, the plane of the polarization flips… a process known as Faraday rotation. The amount of rotation shows the direction and strength of the field and thereby its properties. Polarized light is also generated from radio sources. By using different frequencies, the Faraday rotation can also be measured in this alternative way. By combining all of these unique measurements, researchers can acquire information about a single path through the Milky Way. To further enhance the “big picture”, information must be gathered from a variety of sources – a need filled by 26 different observing projects that netted a total of 41,330 individual measurements. To give you a clue of the size, that ends up being about one radio source per square degree of sky!

The uncertainty in the Faraday map. Note that the range of values is significantly smaller than in the Faraday map (Fig. 1). In the area of the celestial south pole, the measurement uncertainties are particularly high because of the low density of data points. (Image Credit: Max Planck Institute for Astrophysics)
Even with depth like this, there are still areas in the southern sky where only a few measurements have been cataloged. To fill in the gaps and give a more realistic view, researchers “have to interpolate between the existing data points that they have recorded.” However, this type of data causes some problems with accuracy. While you might think the more exact measurements would have the greatest impact on the map, scientists aren’t quite sure how reliable any single measurement could be – especially when they could be influenced by the environment around them. In this case, the most accurate measurements don’t always rank the highest in mapping points. Like Heisenberg, there’s an uncertainty associated with the process of obtaining measurements because the process is so complex. Just one small mistake could lead to a huge distortion in the map’s contents.

Thanks to an algorithm crafted by the MPA, scientists are able to face these types of difficulties with confidence as they put together the images. The algorithm, called the “extended critical filter,” employs tools from new disciplines known as information field theory – a logical and statistical method applied to fields. So far it has proven to be an effective method of weeding out errors and has even proven itself to be an asset to other scientific fields such as medicine or geography for a range of image and signal-processing applications.

Even though this new map is a great assistant for studying our own galaxy, it will help pave the way for researchers studying extragalactic magnetic fields as well. As the future provides new types of radio telescopes such as LOFAR, eVLA, ASKAP, MeerKAT and the SKA , the map will be a major resource of measurements of the Faraday effect – allowing scientists to update the image and further our understanding of the origin of galactic magnetic fields.

Original Story Source: Naval Research Laboratory News.

13 Replies to “The Milky Way’s Magnetic Personality”

  1. Yeah, just great nice words, but the story seems somewhat vacuous. Where are the kinds of ballpark values for the field strengths here? (The image shows values ?500 to 500. but 500 of what unit of measure?)

      1. Actually, 500 rad.m^-2 corresponds to B field of approximately 200 ?G. Most of the field here would be a meagre 0.1 to 1 ?G. I think these Faraday rotation values are meant to relative and therefore be dimensionless (?) (I’m still unsure, though.)

        Observation. The main problem in this story is providing a useful comparison in what these observations really mean. Novices would be confused, and even experienced people would be holding on for dear life to understand it.

      2. ha! yes well this is a very good example of a complex problem of visualization. remotely detecting an essentially non visual phenomenon and representing it in some sort of visual scalar.
        the first thing i noticed was the horizontal orientation of the frame. it should actually be oriented vertically for an observer in equatorial latitudes. (is it the inner ear that aligns the minds eye view of the galactic disk with the horizon?)
        then i noticed blue on the left and red on the right: polarization of some sort. probably an effect of galactic rotation of course or magnetic Doppler?
        this is a mosaic of point sources combined to provide a very large scale overview.
        the detection methods are interesting and the theoretical effect that it purports to display.

        the visualization of magnetic fields is extremely useful. just ask any MRI diagnostician.

      3. Working in a somewhat related area, I can shed a little light on this story:

        – Faraday Depth is defined as the integral of the magnetic field projected along the entire line of sight, weighted by the difference in thermal electron/positron density.

        – The units are radians / meter^2, because the signature of Faraday Rotation in astrophysical plasmas is a linear rotation of polarisation angle with the square of the observing wavelength. I.e a plot of polarisation angle vs. observing wavelength^2 is a line, and has a gradient of zero when FR is not occuring. When FR is occuring, the line has a gradient called the rotation measure which is a measure of the magnetic field strength along the line of sight. This however presumes that the polarised source and rotating regions are not mixed, and there are not more than a single unresolved source along the LOS. If these conditions are not met, then the behavior of the polarisation vector is more complex, and needs to be addressed with more advanced techniques like ‘Rotation Measure Synthesis’, which can pick out multiple RM components in a spectropolarimetric data.

  2. Its interesting, but the Image is somewhat random, Perhaps because of the time differences in the image sampling from so many sources. Its not mentioned, but I assume that stitching together data from 41,000 singular measurements was not from data acquired at the same time.

    Its possible that we are thus missing a crucial factor, which is how much does the magnetic moment of the galaxy fluctuate over time, if at all.

    Fascinating result nonetheless, even if it is visualized statistical data. Perhaps a single observing camera could be built that employs their ‘extended critical filter’ to produce real time results. ?

  3. Ah yes, interesting. The graph measures are not annotated, and the uncertainty graph is barely legible anyway, so I stumbled on what looks like the original paper before I noticed Steve’s comment linking it. (Thanks anyway!) As SJStar says, while holding on for dear life:

    – The uncertainties is ~ 20 % outside the galactic plane. (See for example fig. 4 of the paper.)

    – They introduce Faraday depth in the paper, an integrated measure along a line of sight between the observer and the outer edge of the Milky Way.

    Technically it uses the thermal electron density and the line of sight magnetic field component, and they claim that the integrand is a measure of a single linearly polarized source’s ability to rotate observed light. So they integrate all sources and noise.

    I haven’t checked that, I haven’t played with it as SJStar, but it is normalized and as I understand it they claim it is dimensionless as SJSTar suspects. (P. 5 of the paper: “Figure 3 shows the reconstructed dimensionless signal map”.)

    ————————
    OT:

    Since I need to have some familiarity with sundry signal methods, I got hold of the paper explaining their extended critical filter formalism.

    – It is “critical” because it belongs to a family of filters that have a parameter set separating filters with a useful detection threshold from those without, and a critical filter (probably) lies shy on the detection side.

    – It is “extended” because it is explicitly allows for more uncertainty in the noise covariance than the original family.

    The more interesting part is that it is a filter that minimizes a measure equivalent to the free Gibbs energy of the signal. Thermodynamically it is equivalent to look for a local equilibrium, or barring that a steady state system with flows.

    Those systems are linear close to equilibrium by way of Onsager reciprocity (which is actually the thermodynamical definition for “close to equilibrium”). So for many systems it would be a good approximation to use the spatially uncorrelated Gaussian pdf’s that goes with the method.

    Indeed, they claim that the result is close to a Wiener filter reconstruction, while assuming very little on noise covariance and being robust against a few misunderstood observations’ errors.

  4. FWIW, hot from the presses:

    Generation of scaled protogalactic seed magnetic fields in laser-produced shock waves.

    “The standard model for the origin of galactic magnetic fields is through the amplification of seed fields via dynamo or turbulent processes to the level consistent with present observations1, 2, 3. Although other mechanisms may also operate4, 5, currents from misaligned pressure and temperature gradients (the Biermann battery process) inevitably accompany the formation of galaxies in the absence of a primordial field. Driven by geometrical asymmetries in shocks6 associated with the collapse of protogalactic structures, the Biermann battery is believed to generate tiny seed fields to a level of about 10?21?gauss (refs 7, 8).

    With the advent of high-power laser systems in the past two decades, a new area of research has opened in which, using simple scaling relations9, 10, astrophysical environments can effectively be reproduced in the laboratory11, 12. Here we report the results of an experiment that produced seed magnetic fields by the Biermann battery effect. We show that these results can be scaled to the intergalactic medium, where turbulence, acting on timescales of around 700 million years, can amplify the seed fields13, 14 sufficiently to affect galaxy evolution.”

    1. Is there an Arxiv version of “Generation of scaled protogalactic seed magnetic fields in laser-produced shock waves” ??

Comments are closed.