The South Pole Telescope observes the southern winter sky. Credit: Aman Chokshi
In the earliest moments of the Universe, the first photons were trapped in a sea of ionized gas. They scattered randomly with the hot nuclei and electrons of the cosmic fireball, like tiny boats in a stormy sea. Then, about 370,000 years after the big bang, the Universe cooled enough for the photons to be free. After one last scattering, they could finally ply interstellar space. Some of them traveled across 14 billion years of space and time to reach Earth, where we see them as part of the cosmic microwave background. The remnant first light of creation.
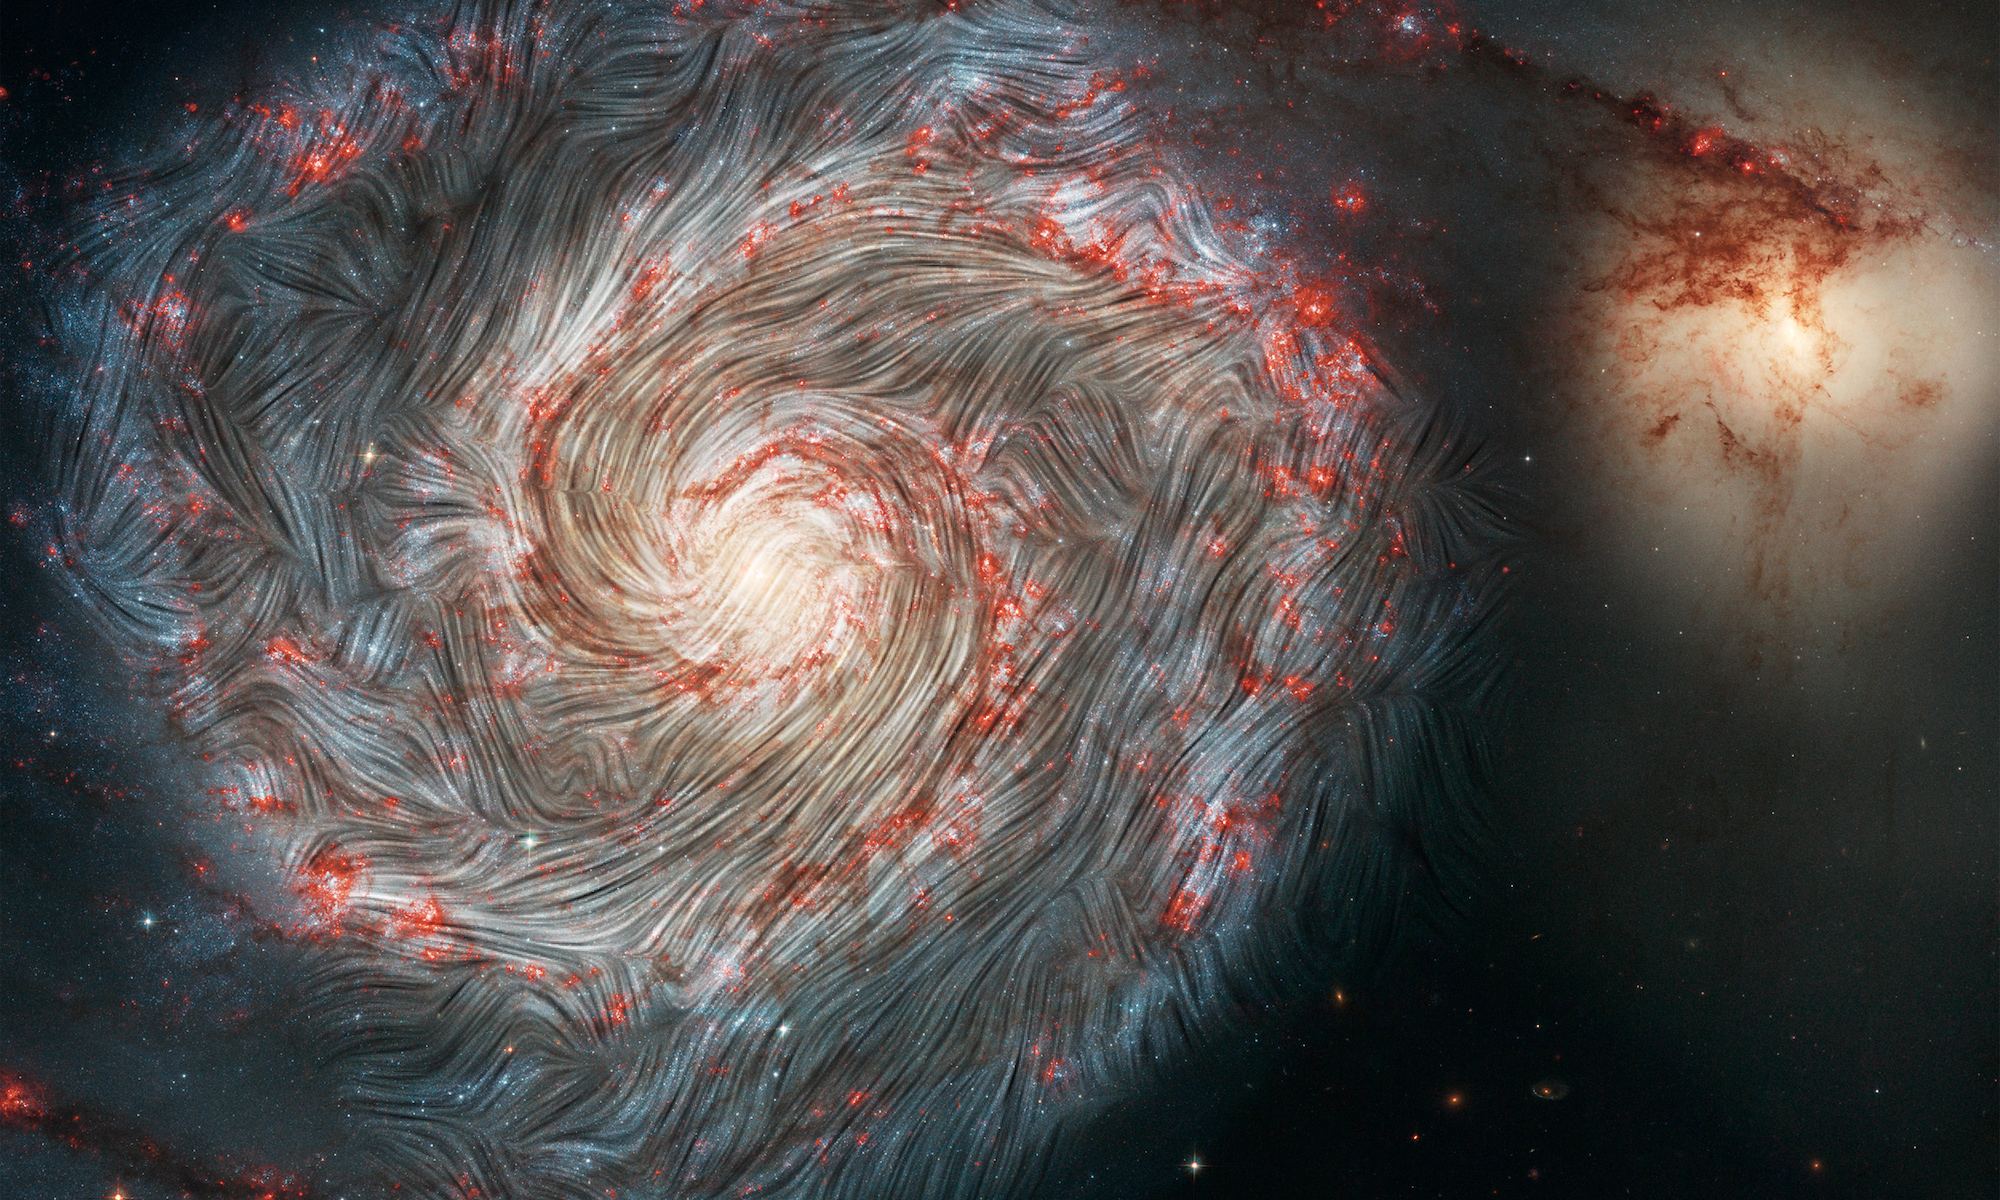
Magnetic fields mapped within the Whirlpool Galaxy. Credit: NASA, SOFIA science team, ESA, STScI
Our galaxy is filled with magnetic fields. They come not just from stars and planets, but from dusty stellar nurseries and the diffuse hydrogen gas of interstellar space. We’ve long known of this galactic magnetic field, but mapping it in detail has posed a challenge. Now a new study gives us a detailed 3-dimensional map of these fields, with a few surprises.
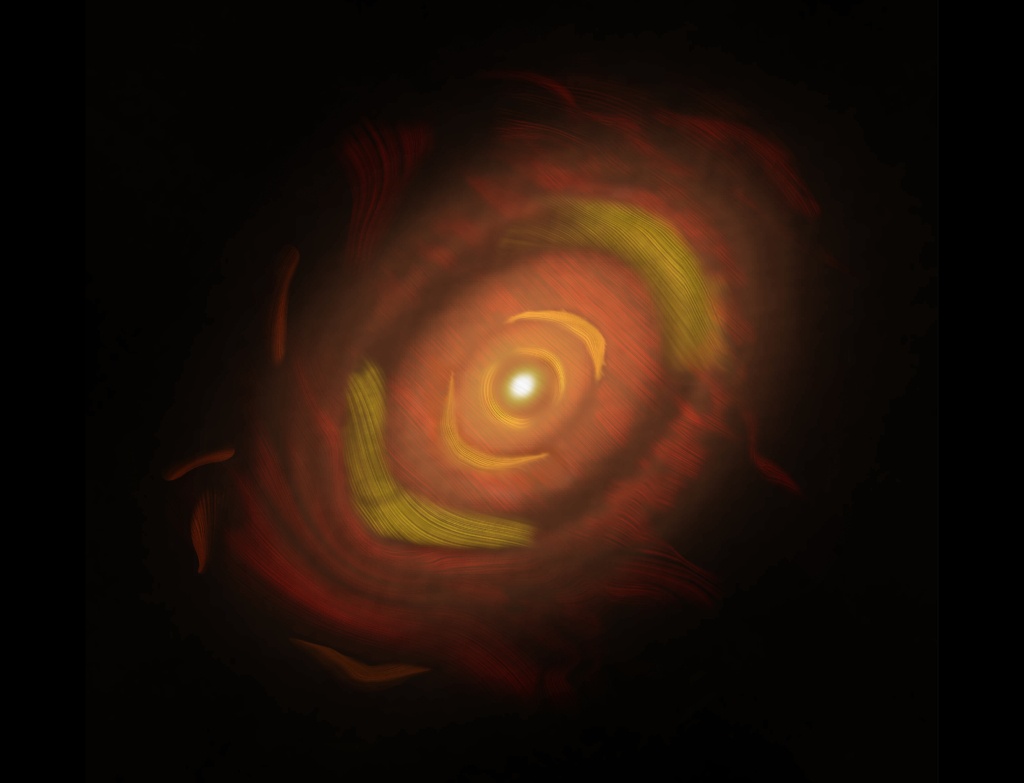
This ALMA image of the young star HL Tauri shows rings of dust surrounding the star. The line patterns show the orientation of polarized light. It's the deepest dust polarization image of any protoplanetary disk captured thus far, revealing details about the dust grains in the disk.
Credit: NSF/AUI/NRAO/B. Saxton/Stephens et al.
The ESO’s Atacama Large Millimeter/submillimeter Array (ALMA) is perched high in the Chilean Andes. ALMA is made of 66 high-precision antennae that all work together to observe light just between radio and infrared. Its specialty is cold objects, and in recent years, it has taken some stunning and scientifically illuminating images of protoplanetary disks and the planets forming in them.
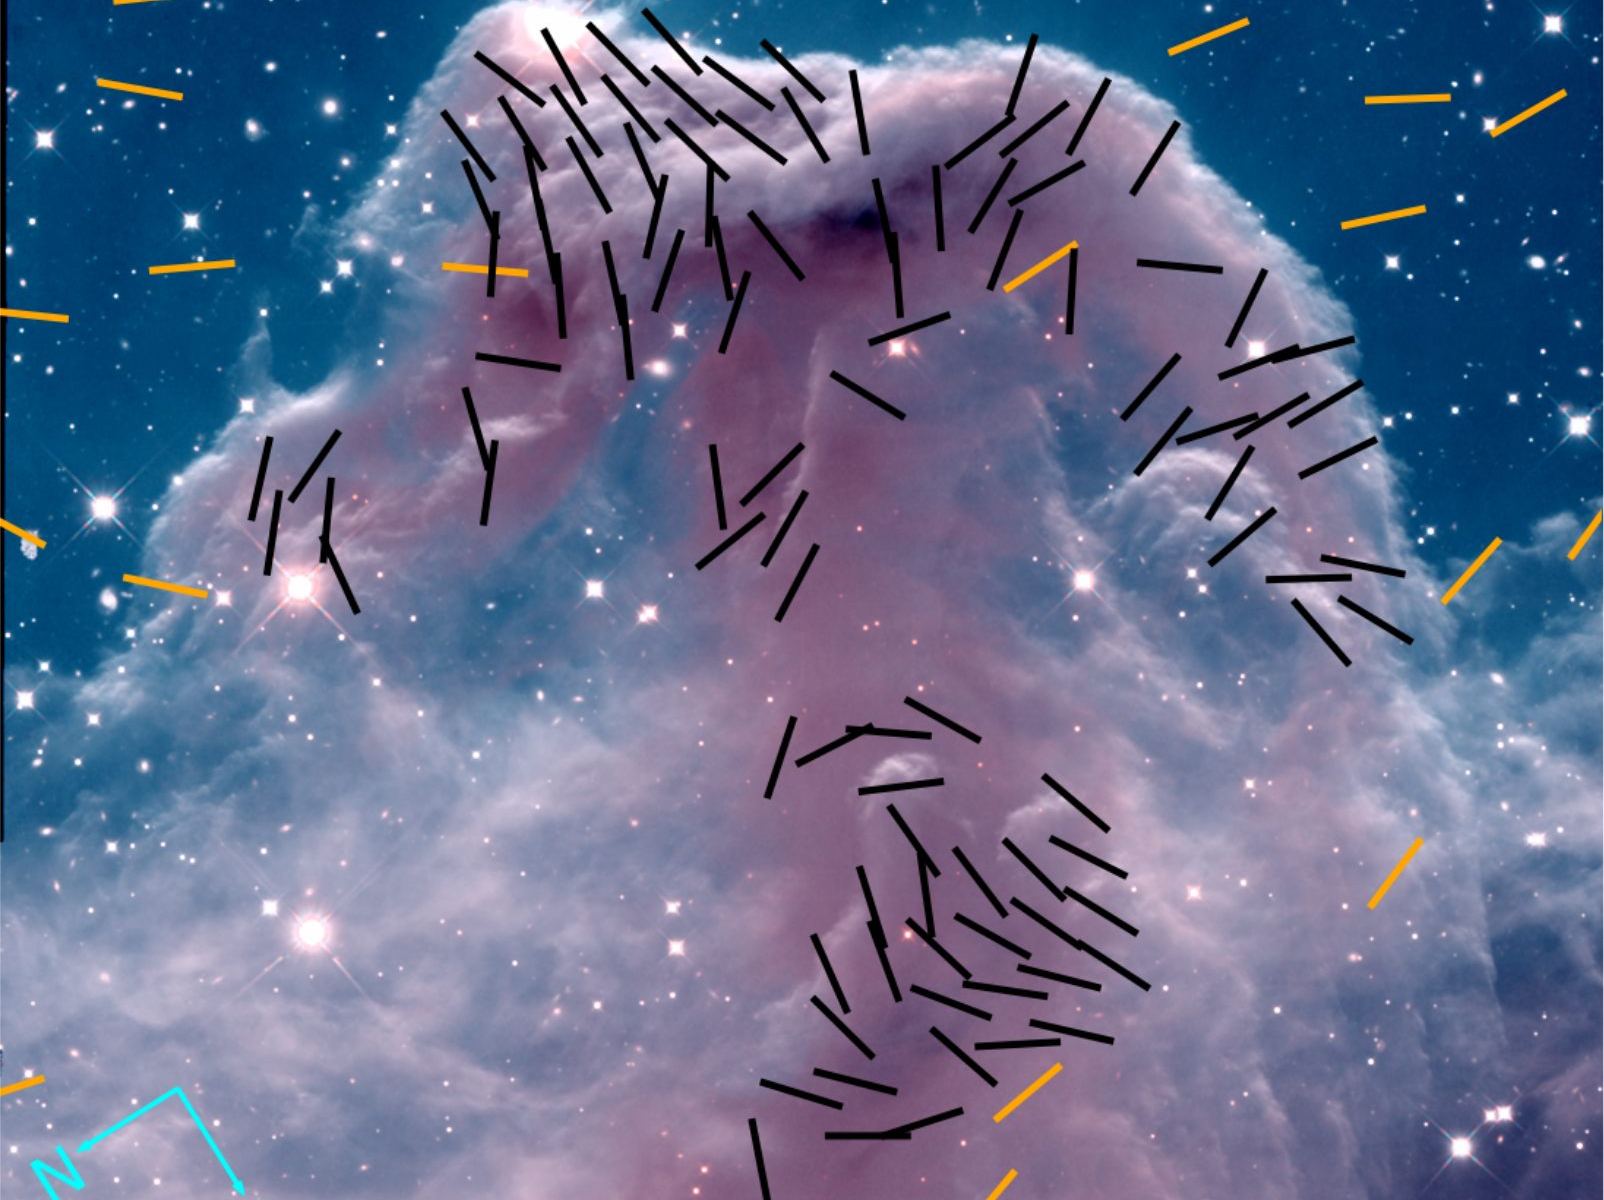
Magnetic field detections overlaid on a two-color composite of Hubble Space Telescope image taken at two near-IR wavelengths (Mikulski Archive for Space Telescopes). Black and orange segments show magnetic field orientations inferred from JCMT and Palomar Observatory. Credit: Hwang et al. 2023.
Located near the summit of Maunakea, Hawaii, the 15-meter (~49 ft) James Clerk Maxwell Telescope (JCMT) at the East Asia Observatory (EAO) is the largest telescope in the world designed to operate exclusively in the submillimetre-wavelength. In 2018, Molokai’i High School alumna Mallory Go was awarded time with the JCMT under the Maunakea Scholars program. With the assistance of EAO astronomer Dr. Harriet Parsons, Go obtained unique images of the Horsehead Nebula in polarized light, which revealed the nebula’s magnetic fields.
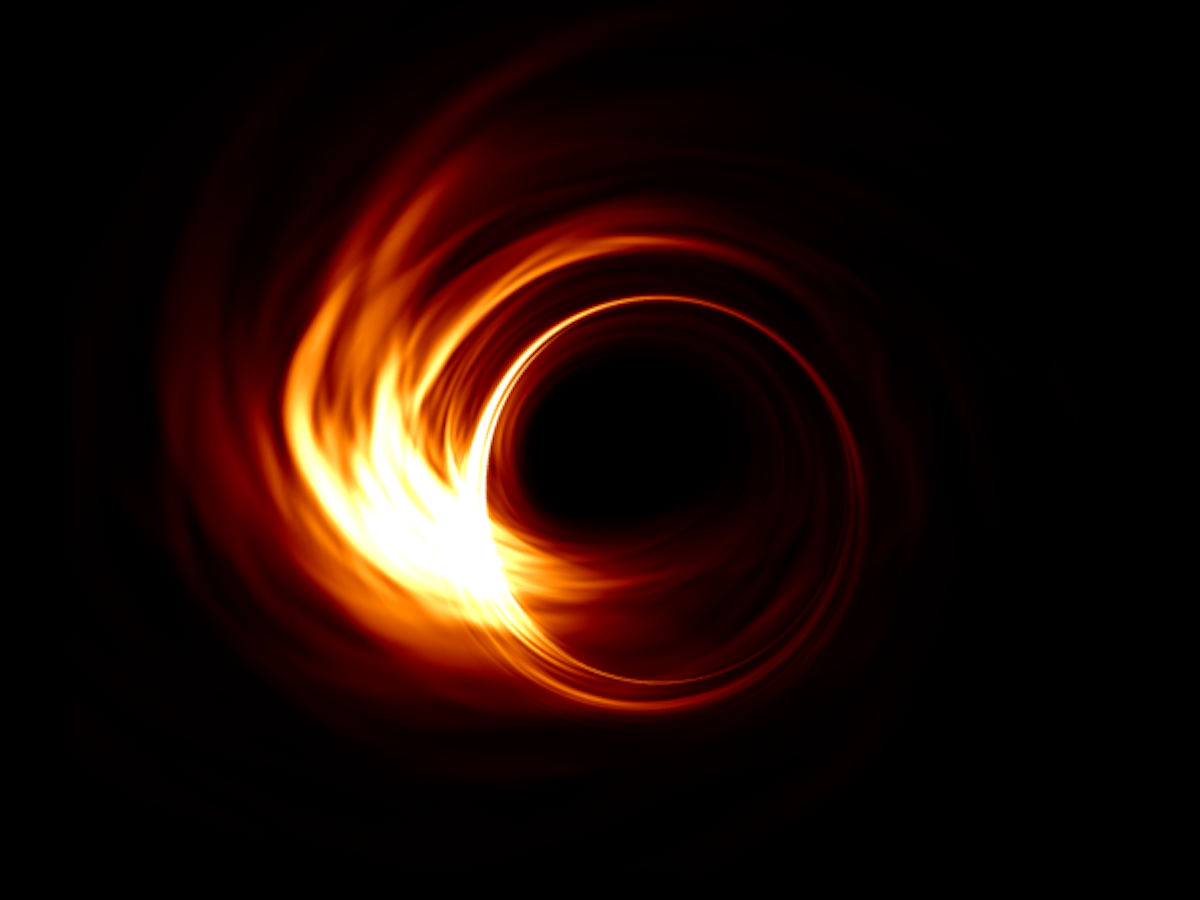
Computer simulation of plasma near a black hole. Credit: Hotaka Shiokawa / EHT
In 2019 astronomers captured the first direct image of a black hole. It was an image of the supermassive black hole at the heart of M87. And when many folks saw it, their reaction was “that’s it?” Which is understandable, given that the image is just a blurry, donut-shaped smudge. It isn’t much to look at. But an astronomical image is a small fraction of the data gathered by astronomers. Recently more of that data has been analyzed, including both the polarization of the light and the magnetic field surrounding the black hole.
Cosmic Microwave Background. Scientists compared this to modern galaxy distributions to track dark matter. Copyright: ESA/Planck Collaboration
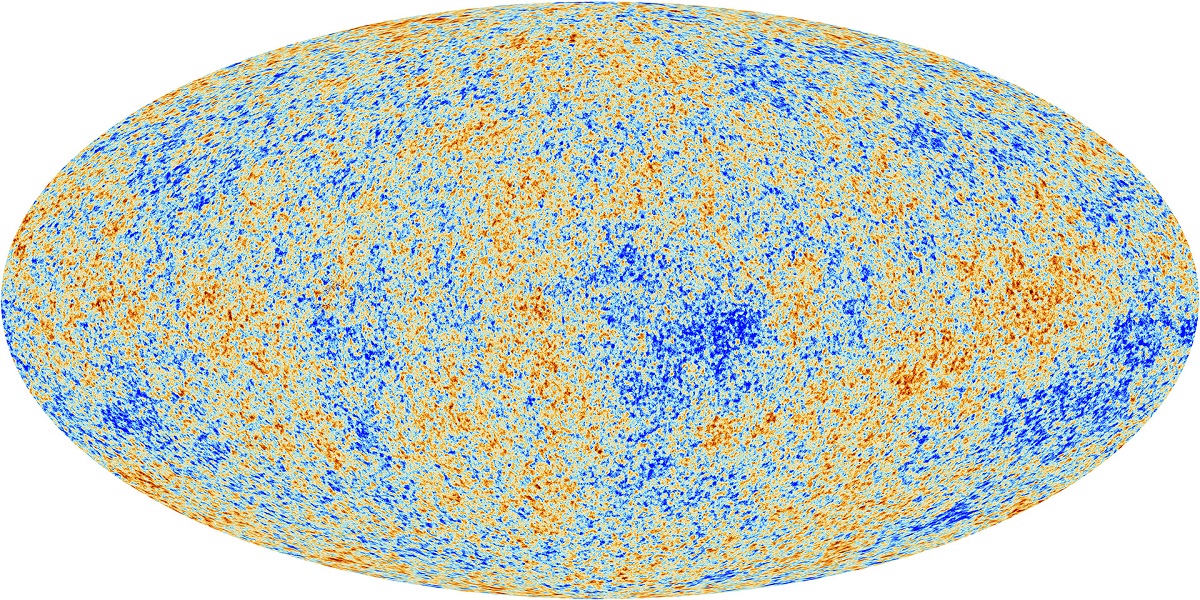
The oldest light in the universe is that of the cosmic microwave background (CMB). This light was formed when the dense matter at the beginning of the universe finally cooled enough to become transparent. It has traveled for billions of years to reach us, stretched from a bright orange glow to cool, invisible microwaves. Naturally, it is an excellent source for understanding the history and expansion of the cosmos.
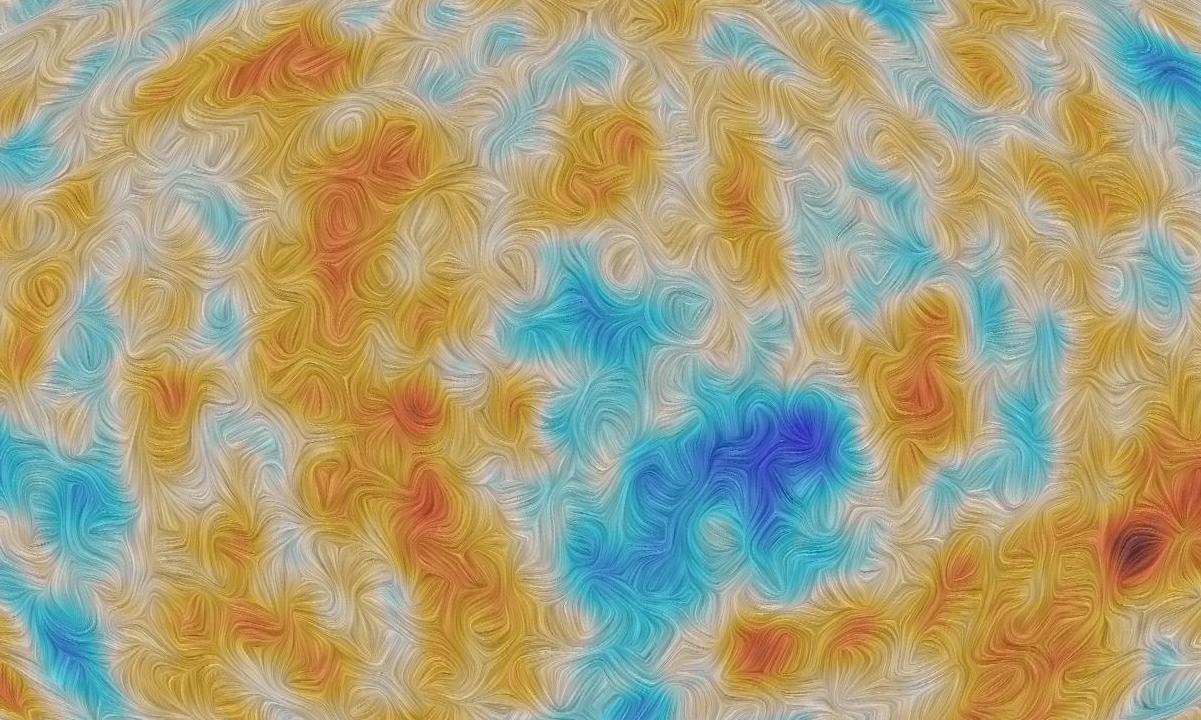
Visualizing the polarization of the cosmic microwave background. Credit: ESA/Planck Collaboration
The oldest light in the universe is that of the cosmic microwave background (CMB). This remnant glow from the big bang has traveled for more than 13 billion years. Along the way, it has picked up a few tales about the history and evolution of the cosmos. We just need to listen to what it has to say.
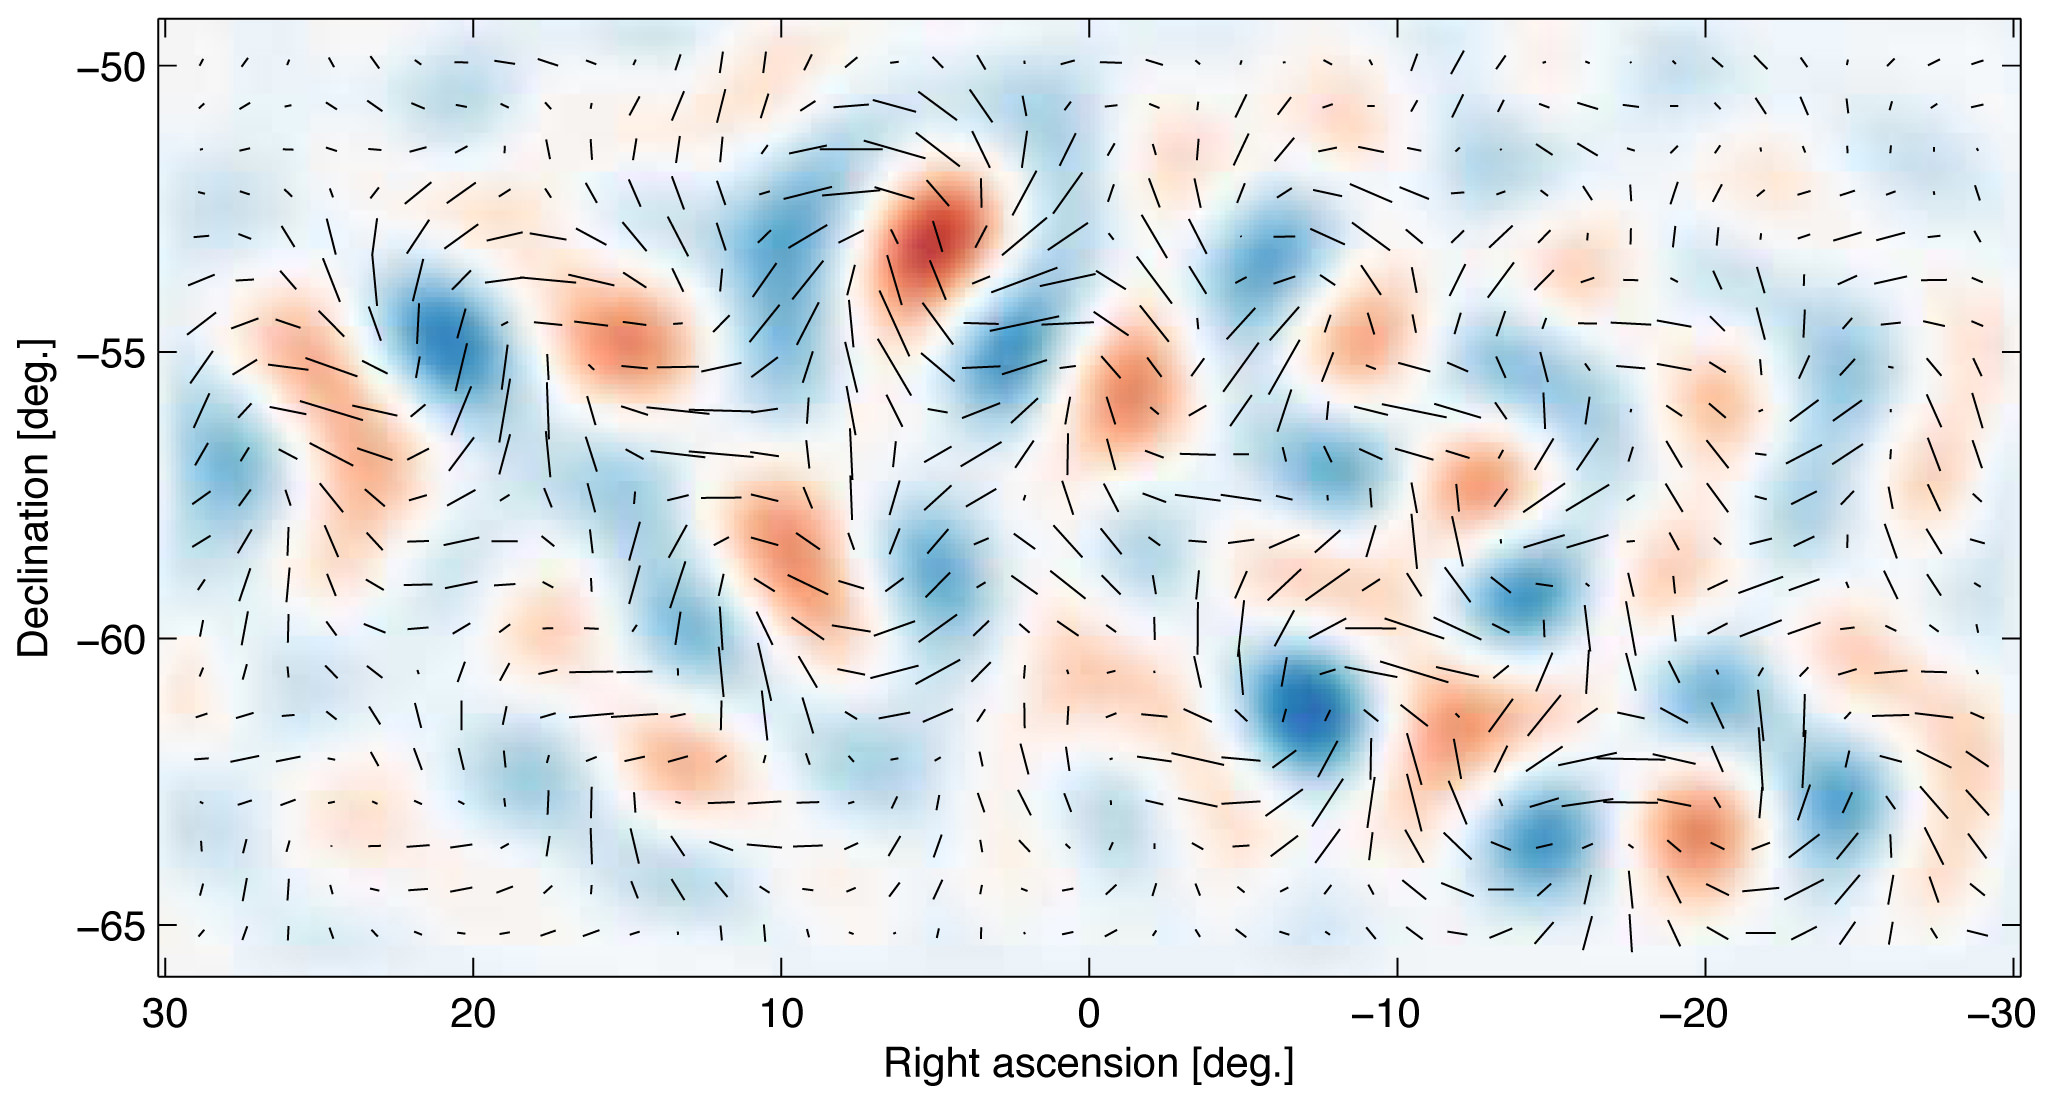
Polarization patterns imprinted in the CMB. Image Credit: CfA
Days like these make being an astrophysicist interesting. On the one hand, there is the annoucement of BICEP2 that the long-suspected theory of an inflationary big bang is actually true. It’s the type of discovery that makes you want to grab random people off the street and tell them what an amazing thing the Universe is. On the other hand, this is exactly the type of moment when we should be calm, and push back on the claims made by one research team. So let’s take a deep breath and look at what we know, and what we don’t.
Inflation could mean our Universe is just one of many. Credit: Florida State University
First off, let’s dispel a few rumors. This latest research is not the first evidence of gravitational waves. The first indirect evidence for gravitational waves was found in the orbital decay of a binary pulsar by Russell Hulse and Joseph Taylor, for which they were awarded the Nobel prize in 1993. This new work is also not the first discovery of polarization within the cosmic microwave background, or even the first observation of B-mode polarization. This new work is exciting because it finds evidence of a specific form of B-mode polarization due to primordial gravitational waves. The type of gravitational waves that would only be caused by inflation during the earliest moments of the Universe.
It should also be noted that this new work hasn’t yet been peer reviewed. It will be, and it will most likely pass muster, but until it does we should be a bit cautious about the results. Even then these results will need to be verified by other experiments. For example, data from the Planck space telescope should be able to confirm these results assuming they’re valid.
That said, these new results are really, really interesting.
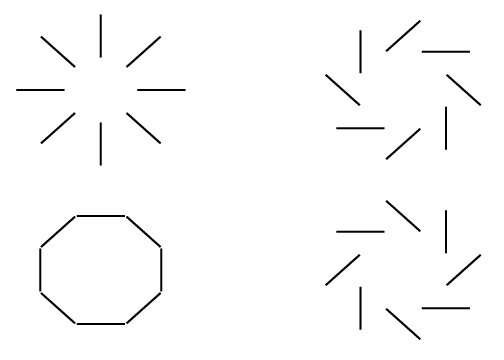
E-modes (left) and B-modes (right)
What the team did was to analyze what is known as B-mode polarization within the cosmic microwave background (CMB). Light waves oscillate perpendicular to their direction of motion, similar to the way water waves oscillate up and down while they travel along the surface of water. This means light can have an orientation. For light from the CMB, this orientation has two modes, known as E and B. The E-mode polarization is caused by temperature fluctuations in the CMB, and was first observed in 2002 by the DASI interferometer.
The B-mode polarization can occur in two ways. The first way is due to gravitational lensing. The first is due to gravitational lensing of the E-mode. The cosmic microwave background we see today has travelled for more than 13 billion years before reaching us. Along its journey some of it has passed close enough to galaxies and the like to be gravitationally lensed. This gravitational lensing twists the polarization a bit, giving some of it a B-mode polarization. This type was first observed in July of 2013. The second way is due to gravitational waves from the early inflationary period of the universe. As inflationary period occurred, then it produced gravitational waves on a cosmic scale. Just as the gravitational lensing produces B-mode polarization, these primordial gravitational waves produce a B-mode effect. The discovery of primordial wave B-mode polarization is what was announced today.
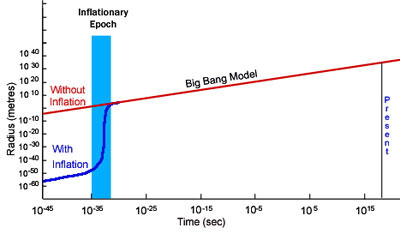
The effect of early inflation on the size of the universe. Credit: NASA/COBE
Inflation has been proposed as a reason for why the cosmic microwave background is as uniform as it is. We see small fluctuations in the CMB, but not large hot or cold spots. This means the early Universe must have been small enough for temperatures to even out. But the CMB is so uniform that the observable universe must have been much smaller than predicted by the big bang. However, if the Universe experienced a rapid increase in size during its early moments, then everything would work out. The only problem was we didn’t have any direct evidence of inflation.
Assuming these new results hold up, now we do. Not only that, we know that inflation was stronger than we anticipated. The strength of the gravitational waves is measured in a value known as r, where larger is stronger. It was found that r = 0.2, which is much higher than anticipated. Based upon earlier results from the Planck telescope, it was expected that r < 0.11. So there seems to be a bit of tension with earlier findings. There are ways in which this tension can be resolved, but just how is yet to be determined.
So this work still needs to be peer reviewed, and it needs to be confirmed by other experiments, and then the tension between this result and earlier results needs to be resolved. There is still much to do before we really understand inflation. But overall this is really big news, possibly even Nobel prize worthy. The results are so strong that it seems pretty clear we have direct evidence of cosmic inflation, which is a huge step forward. Before today we only had physical evidence back to when the universe was about a second old, at a time when nucleosynthesis occurred. With this new result we are now able to probe the Universe when it was less than 10 trillion trillion trillionths of a second old.
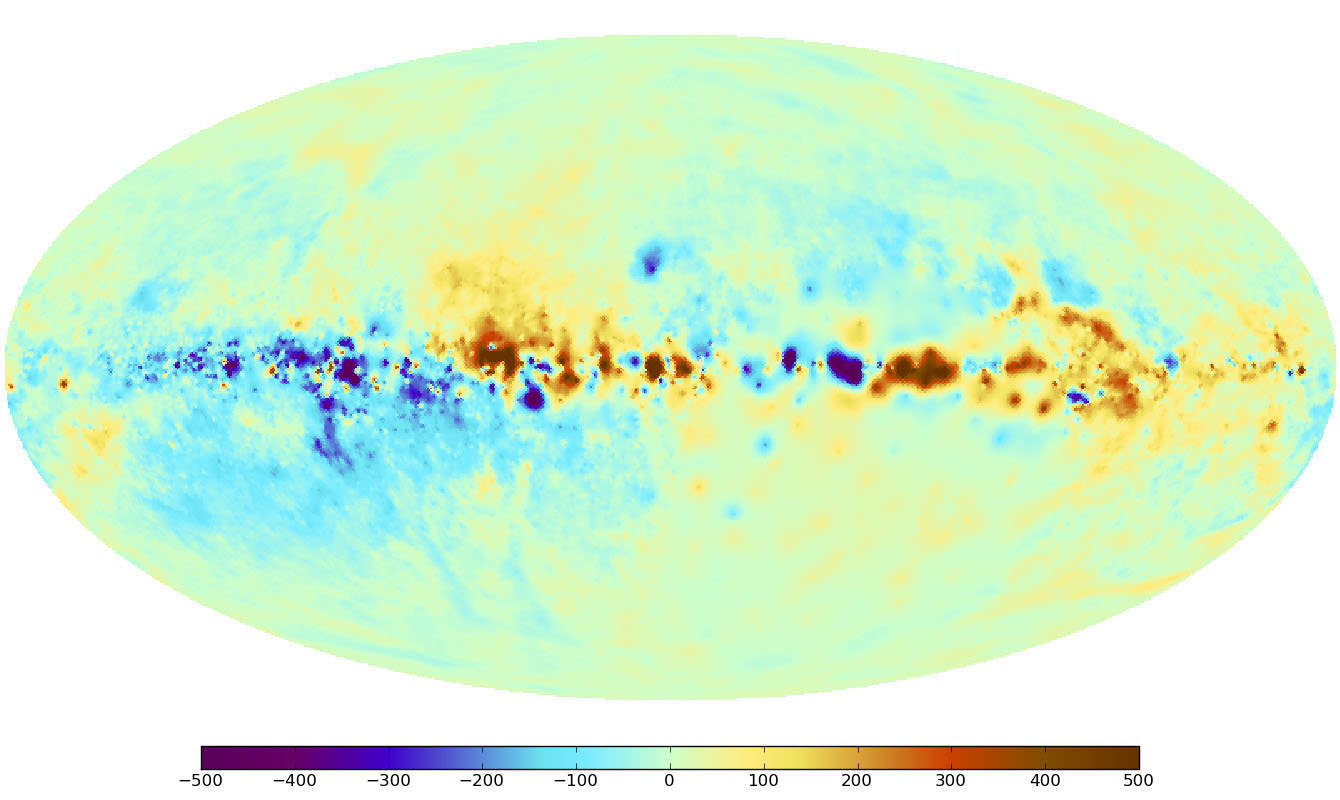
The sky map of the Faraday effect caused by the magnetic fields of the Milky Way. Red and blue colors indicate regions of the sky where the magnetic field points toward and away from the observer, respectively. The band of the Milky Way (the plane of the Galactic disk) extends horizontally in this panoramic view. The center of the Milky Way lies in the middle of the image. The North celestial pole is at the top left and the South Pole is at the bottom right. (Image Credit: Max Planck Institute for Astrophysics)
[/caption]
Recently we took a look at a very unusual type of map – the Faraday Sky. Now an international team of scientists, including those at the Naval Research Laboratory, have pooled their information and created one of the most high precision maps to date of the Milky Way’s magnetic fields. Like all galaxies, ours has a magnetic “personality”, but just where these fields come from and how they are created is a genuine mystery. Researchers have always simply assumed they were created by mechanical processes like those which occur in Earth’s interior and the Sun. Now a new study will give scientists an even better understanding about the structure of galactic magnetic fields as seen throughout our galaxy.
The team, led by the Max Planck Institute for Astrophysics (MPA), gathered their information and compiled it with theoretical simulations to create yet another detailed map of the magnetic sky. As NRL’s Dr. Tracy Clarke, a member of the research team explains, “The key to applying these new techniques is that this project brings together over 30 researchers with 26 different projects and more than 41,000 measurements across the sky. The resulting database is equivalent to peppering the entire sky with sources separated by an angular distance of two full moons.” This huge amount of data provides a new “all-sky” look which will enable scientists to measure the magnetic structure of the Milky Way in minute detail.
In this map of the sky, a correction for the effect of the Galactic disk has been made in order to emphasize weaker magnetic field structures. The magnetic field directions above and below the disk seem to be diametrically opposed, as indicated by the positive (red) and negative (blue) values. An analogous change of direction takes place across the vertical center line, which runs through the center of the Milky Way. (Image Credit: Max Planck Institute for Astrophysics)Just what’s so “new” about this map? This time we’re looking at a quantity called Faraday depth – an idea dependent on a line-of-sight information set on the magnetic fields. It was created by combining more than 41,000 singular measurements which were then combined using a new image reconstruction method. In this case, all the researchers at MPA are specialists in the new discipline of information field theory. Dr. Tracy Clarke, working in NRL’s Remote Sensing Division, is part of the team of international radio astronomers who provided the radio observations for the database. It’s magnetism on a grand scale… and imparts even the smallest of magnetic features which will enable scientists to further understand the nature of galactic gas turbulence.
The concept of the Faraday effect isn’t new. Scientists have been observing and measuring these fields for the last century and a half. Just how is it done? When polarized light passes through a magnetized medium, the plane of the polarization flips… a process known as Faraday rotation. The amount of rotation shows the direction and strength of the field and thereby its properties. Polarized light is also generated from radio sources. By using different frequencies, the Faraday rotation can also be measured in this alternative way. By combining all of these unique measurements, researchers can acquire information about a single path through the Milky Way. To further enhance the “big picture”, information must be gathered from a variety of sources – a need filled by 26 different observing projects that netted a total of 41,330 individual measurements. To give you a clue of the size, that ends up being about one radio source per square degree of sky!
The uncertainty in the Faraday map. Note that the range of values is significantly smaller than in the Faraday map (Fig. 1). In the area of the celestial south pole, the measurement uncertainties are particularly high because of the low density of data points. (Image Credit: Max Planck Institute for Astrophysics)Even with depth like this, there are still areas in the southern sky where only a few measurements have been cataloged. To fill in the gaps and give a more realistic view, researchers “have to interpolate between the existing data points that they have recorded.” However, this type of data causes some problems with accuracy. While you might think the more exact measurements would have the greatest impact on the map, scientists aren’t quite sure how reliable any single measurement could be – especially when they could be influenced by the environment around them. In this case, the most accurate measurements don’t always rank the highest in mapping points. Like Heisenberg, there’s an uncertainty associated with the process of obtaining measurements because the process is so complex. Just one small mistake could lead to a huge distortion in the map’s contents.
Thanks to an algorithm crafted by the MPA, scientists are able to face these types of difficulties with confidence as they put together the images. The algorithm, called the “extended critical filter,” employs tools from new disciplines known as information field theory – a logical and statistical method applied to fields. So far it has proven to be an effective method of weeding out errors and has even proven itself to be an asset to other scientific fields such as medicine or geography for a range of image and signal-processing applications.
Even though this new map is a great assistant for studying our own galaxy, it will help pave the way for researchers studying extragalactic magnetic fields as well. As the future provides new types of radio telescopes such as LOFAR, eVLA, ASKAP, MeerKAT and the SKA , the map will be a major resource of measurements of the Faraday effect – allowing scientists to update the image and further our understanding of the origin of galactic magnetic fields.
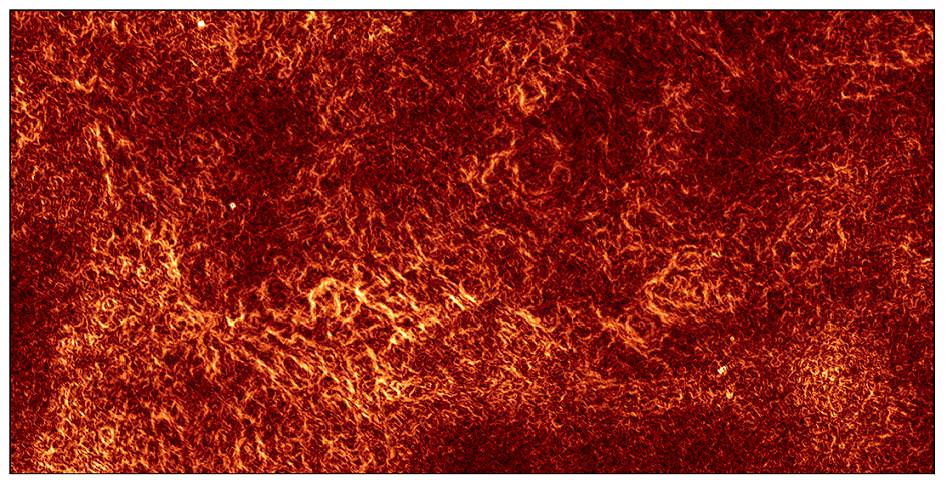
Regions of gas where the density and magnetic field are changing rapidly as a result of turbulence. [Technical note: the image shows the gradient of linear polarisation over an 18-square-degree region of the Southern Galactic Plane.] Image credit – B. Gaensler et al. Data: CSIRO/ATCA
[/caption]
All of the space that surrounds us isn’t empty. We’ve always known the Milky Way was filled with great areas of turbulent gas, but we’ve never been able to see them… Until now. Professor Bryan Gaensler of the University of Sydney, Australia, and his team used a CSIRO radio telescope in eastern Australia to create this first-ever look which was published in Nature today.
“This is the first time anyone has been able to make a picture of this interstellar turbulence,” said Professor Gaensler. “People have been trying to do this for 30 years.”
So what’s the point behind the motion? Turbulence distributes magnetism, disperses heat from supernova events and even plays a role in star formation.
“We now plan to study turbulence throughout the Milky Way. Ultimately this will help us understand why some parts of the galaxy are hotter than others, and why stars form at particular times in particular places,” Professor Gaensler said.
Employing CSIRO’s Australia Telescope Compact Array because “it is one of the world’s best telescopes for this kind of work,” as Dr. Robert Braun, Chief Scientist at CSIRO Astronomy and Space Science, explained, the team set their sights about 10,000 light years away in the constellation of Norma. Their goal was to document the radio signals which emanate from that section of the Milky Way. As the radio waves pass through the swirling gas, they become polarized. This changes the direction in which the light waves can “vibrate” and the sensitive equipment can pick up on these small differentiations.
By measuring the polarization changes, the team was able to paint a radio portrait of the gaseous regions where the turbulence causes the density and magnetic fields to fluctuate wildly. The tendrils in the image are also important, too. They show just how fast changes are occurring – critical for their description. Team member Blakesley Burkhart, a PhD student from the University of Wisconsin, made several computer simulations of turbulent gas moving at different speeds. By matching the simulations with the actual image, the team concluded “the speed of the swirling in the turbulent interstellar gas is around 70,000 kilometers per hour — relatively slow by cosmic standards.”