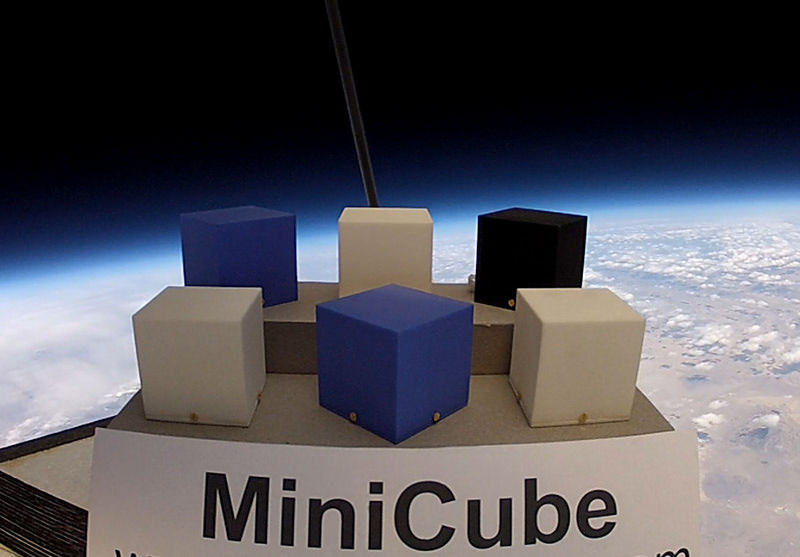
JP Aerospace's MiniCube program can send your stuff to the "edge of space"
[/caption]
Ok, at 100,000 feet it’s not really “space” but for $320 USD JP Aerospace is offering a very affordable way to get your research experiment, brand statement, artwork or anything you can imagine (and that fits into a 50mm cube, weight limits apply) into the upper atmosphere. Pretty cool!
Touting its program as “stomping down the cost of space”, Rancho Cordova, California-based JP Aerospace (America’s OTHER Space Program) is offering its MiniCube platform to anyone who wants to get… well, something… carried up to 100,000 feet.
The plastic MiniCubes are each 1mm-thick, 48mm wide and 50mm high. Their bases have a standard tripod mount, and the MiniCubes can be cut, drilled, printed and/or modified within parameters before being mailed back to JPA for flight. Once the MiniCubes are flown, they are returned to their customers along with a data sheet and a CD of images from the mission. All for $320!
Again, it may not technically be “space”, but the view’s not bad.
Where MiniCubes go: a photo from a JPA balloon platform (JP Aerospace)
At the time of this writing there are 20 spaces available for the next JPA high-altitude balloon flight on September 22.
Find out more about JPA, MiniCubes, size specifications and how to purchase a space on the next flight here.
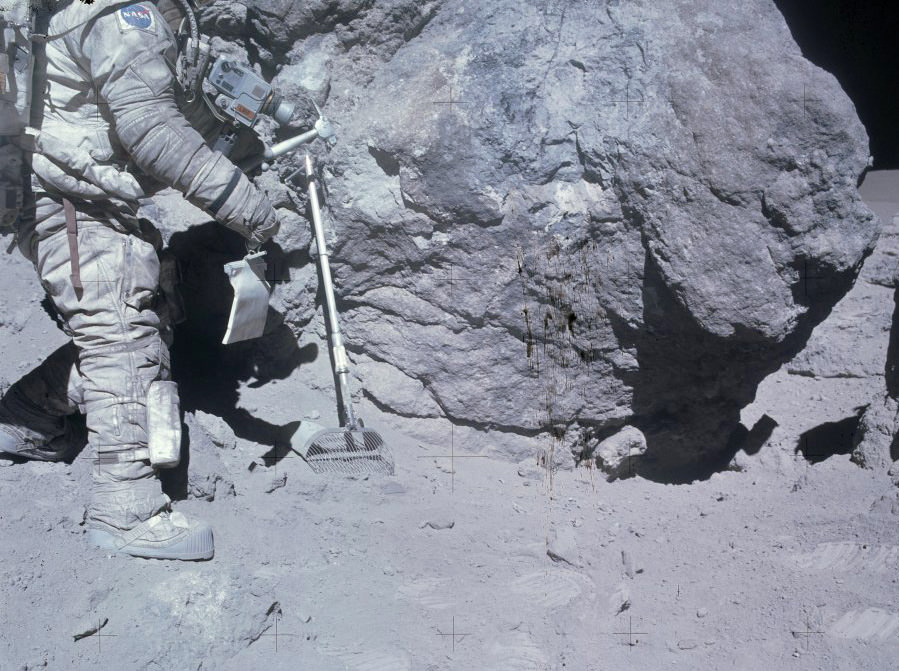
Apollo 16 astronaut Charlie Duke collects lunar samples during EVA on April 23, 1972 (NASA)
[/caption]
New investigations of lunar samples collected during the Apollo missions have revealed origins from beyond the Earth-Moon system, supporting a hypothesis of ancient cataclysmic bombardment for both worlds.
Samples of Apollo 16 breccia that contain chondritic material (JSC)
Using scanning electron microscopes, researchers at the Lunar-Planetary Institute and Johnson Space Center have re-examined breccia regolith samples returned from the Moon, chemically mapping the lunar rocks to discern more compositional detail than ever before.
What they discovered was that many of the rocks contain bits of material that is chondritic in origin — that is, it came from asteroids, and not from elsewhere on the Moon or Earth.
Chondrites are meteorites that originate from the oldest asteroids, formed during the development of the Solar System. They are composed of the initial material that made up the stellar disk, compressed into spherical chondrules. Chondrites are some of the rarest types of meteorites found on Earth today but it’s thought that at one time they rained down onto our planet… as well as our moon.
The Lunar Cataclysm Hypothesis suggests that there was a period of extremely active bombardment of the Moon’s surface by meteorite impacts around 3.9 billion years ago. Because very few large impact events — based on melt rock samples — seem to have taken place more than 3.85 billion years ago, scientists suspect such an event heated the Moon’s surface enough prior to that period to eradicate any older impact features — a literal resurfacing of the young Moon.
There’s also evidence that there was a common source for the impactors, based on composition of the chondrites. What event took place in the Solar System that sent so much material hurtling our way? Was there a massive collision between asteroids? Did a slew of comets come streaking into the inner solar system? Were we paid a brief, gravitationally-disruptive visit by some other rogue interstellar object? Whatever it was that occurred, it changed the face of our Moon forever.
Curiously enough, it was at just about that time that we find the first fossil evidence of life on Earth. If there’s indeed a correlation, then whatever happened to wipe out the Moon’s oldest craters may also have cleared the slate for life here — either by removing any initial biological development that may have occurred or by delivering organic materials necessary for life in large amounts… or perhaps a combination of both.
Timeline for the Lunar Cataclysm Hypothesis (LPI)
The new findings from the Apollo samples provide unambiguous evidence that a large-scale impact event was taking place during this period on the Moon — and most likely on Earth too. Since the Moon lacks atmospheric weathering or water erosion processes it serves as a sort of “time capsule”, recording the evidence of cosmic events that take place around the Earth-Moon neighborhood. While evidence for any such impacts would have long been erased from Earth’s surface, on the Moon it’s just a matter of locating it.
In fact, due to the difference in surface area, Earth may have received up to ten times more impacts than the Moon during such a cosmic cataclysm. With over 1,700 craters over 20 km identified on the Moon dating to a period around 3.9 billion years ago, Earth should have 17,000 craters over 20 km… with some ranging over 1,000 km! Of course, that’s if the craters could had survived 3.9 billion years of erosion and tectonic activity, which they didn’t. Still, it would have been a major event for our planet and anything that may have managed to start eking out an existence on it. We might never know if life had gained a foothold on Earth prior to such a cataclysmic bombardment, but thanks to the Moon (and the Apollo missions!) we do have some evidence of the events that took place.
Sample of lunar impact melt breccia, showing exterior and chondrule-filled interior. (Click for sample report.) Source: JSC
The LPI-JSC team’s paper was submitted to the journal Science and accepted for publication on May 2. See the abstract here, and read more on the Lunar Science Institute’s website here.
And if you want to browse through the Apollo lunar samples you can do so in depth on the JSC Lunar Sample Compendum site.
The Earth from SpaceX Dragon cargo vehicle after May 22, 2012 balastoff. Credit: SpaceX
[/caption]
All systems are functioning nominally aboard the Earth orbiting Dragon cargo carrier launched yesterday, May 22, atop the SpaceX Falcon 9 rocket from Cape Canaveral, Florida.
SpaceX has released the picture above of the Earth as seen by a thermal imager that Dragon will use in its upcoming approach to the International Space Station.
The Falcon 9/Dragon duo thundered to space at 3:44 a.m. on May 22 from Space Launch Complex-40 at Cape Canaveral Air Force Station on a historic mission to be the first private spacecraft to dock at the International Space Station (ISS).
Docking is expected on Friday morning May 25 after an intricate series of maneuvering tests are conducted to prove that the Dragon spacecraft can safely approach and dock at the ISS.
Dragon is loaded with about 1200 pounds of supplies on a test flight aimed at showing it can partially replace the cargo carrying duties of the now retired NASA space shuttles.
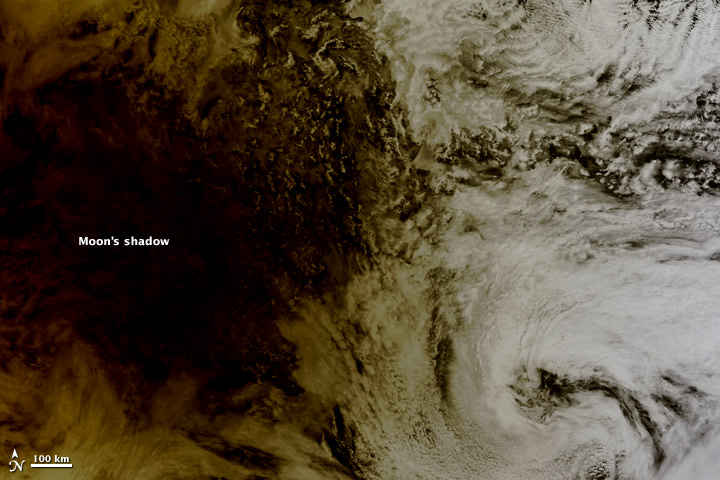
The Moon's shadow falling over the Pacific on May 20, 2012
[/caption]
As the annular eclipse on May 20 sent skywatchers around the globe gazing upwards to see the Sun get darkened by the Moon’s silhouette, NASA’s Terra satellite caught the other side of the event: the Moon’s shadow striking the Earth!
Cast across 240,000 miles of space, the lunar shadow darkened a circular swatch 300 km (185 miles) wide over the northern Pacific Ocean in this image, acquired by the Earth-observing Terra satellite’s Moderate Resolution Imaging Spectroradiometer (MODIS) at 20:30 UT on Sunday, May 20.
Where the Moon passed in front of the Sun, Earth’s surface appeared black (left half of image). Around the margins of the shadow, our planet’s surface appeared yellowish brown. The shadow cast by an eclipse consists of two parts, the completely shadowed umbra and the partially shadowed penumbra.
The eclipse was first visible over eastern Asia and moved across the globe, later becoming visible on the west coast of the US. Known as an annular eclipse, even in totality there was a bright ring of Sun visible around the Moon — a result of the Moon’s elliptical orbit. The effect was dramatic, and was captured in some amazing photos from viewers around the world (as well as by a few above the world!)
Looking at Earth during the Annular Solar Eclipse of May 20, 2012, photographed by Don Pettit from the International Space Station at 23:36 GMT. (NASA)
Although there were a few images being circulated online of the “eclipse” that were not actual photos, be assured that these are the real deal.
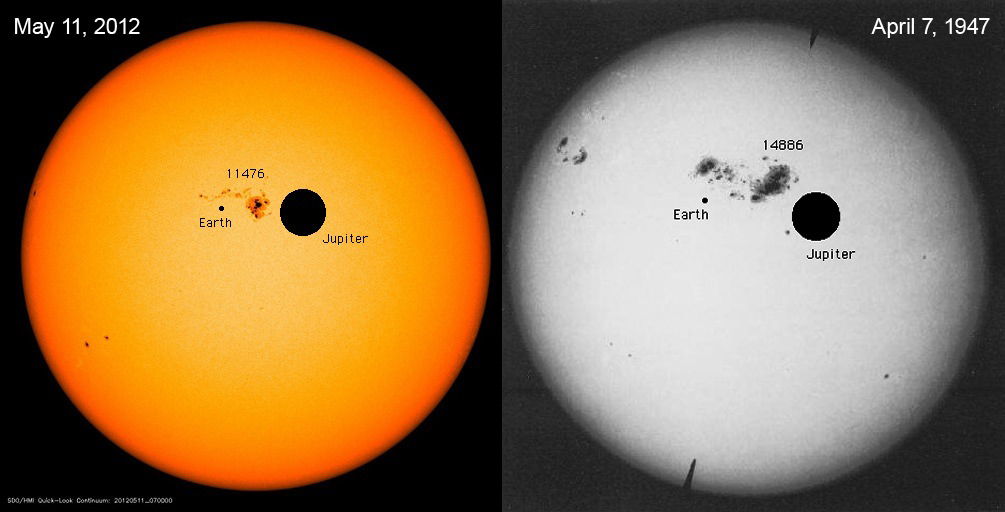
Sunspots from today and from 65 years ago, with planet sizes for comparison.
[/caption]
The short answer? Really big. The long answer? Really, really big.
The image above shows sunspot regions in comparison with the sizes of Earth and Jupiter, demonstrating the sheer enormity of these solar features.
Sunspots are regions where the Sun’s internal magnetic fields rise up through its surface layers, preventing convection from taking place and creating cooler, optically darker areas. They often occur in pairs or clusters, with individual spots corresponding to the opposite polar ends of magnetic lines.
(Read “What Are Sunspots?”)
The image on the left was acquired by NASA’s Solar Dynamics Observatory on May 11, 2012, showing Active Region 11476. The one on the right comes courtesy of the Carnegie Institution of Washington, and shows the largest sunspot ever captured on film, AR 14886. It was nearly the diameter of Jupiter — 88,846 miles (142,984 km)!
“The largest sunspots tend to occur after solar maximum and the larger sunspots tend to last longer as well,” writes SDO project scientist Dean Pesnell on the SDO is GO blog. “As we move through solar maximum in the northern hemisphere and look to the south to pick up the slack there should be plenty of sunspots to watch rotate by SDO.”
Sunspots are associated with solar flares and CMEs, which can send solar storms our way and negatively affect satellite operation and impact communications and sensitive electronics here on Earth. As we approach the peak of the current solar maximum cycle, it’s important to keep an eye — or a Solar Dynamics Observatory! — on the increasing activity of our home star.
(Image credit: NASA/SDO and the Carnegie Institution)
If a portion of Earth underwent a major cataclysm, how long would it take for life to recover? The 1980 eruption of Mount St. Helens is giving scientists an unprecedented opportunity to witness a recovery from devastation, as the eruption leveled the surrounding forest, blasted away hundreds of meters of the mountain’s summit, and claimed 57 human lives. Landsat satellites have tracked the what has happened on the mountain, and how the forest was reclaimed — all on its own. This video shows a timelapse of the recovery, with annual images from 1979-2011 from the Landsat satellites, which acquired the images seen here between 1979 and 2011. Continue reading “Watch How Life Recovers from Devastation”
We’ve shared the images and a previous timelapse of Earth’s northern hemisphere, but now here’s a breath-taking timelapse of the entire blue (and green!) marble as seen from Russia’s Elektro-L weather-forecasting satellite, orbiting at a geostationary height of about 36,000 km (22,300 miles). This new video was created by James Drake using some of the largest whole disk images of our planet, as each image is 121 megapixels, and the resolution is 1 kilometer per pixel. The satellite’s wide-angle Multichannel Scanning Unit (MSU) takes images every 15-30 minutes, showing the same viewpoint of Earth across progressive times of the day and the images are in four different wavelengths of light — three visible, and one infrared.
Image of Earth taken by ESA's Rosetta spacecraft in 2009
[/caption]
Researchers at the University of Maryland have discovered a way to identify and track sulfuric compounds in Earth’s marine environment, opening a path to either refute or support a decades-old hypothesis that our planet can be compared to a singular, self-regulating, living organism — a.k.a. the Gaia theory.
Proposed by scientists James Lovelock and Lynn Margulis in the 70s, the Gaia theory likens Earth to a self-supporting singular life form, similar to a cell. The theory claims that, rather than being merely a stage upon which life exists, life — in all forms — works to actively construct an Earthly environment in which it can thrive.
Although named after the Greek goddess of Earth, the Gaia theory is not so much about mythology or New Age mysticism as it is about biology, chemistry and geology — and how they all interact to make our world suitable for living things.
Once called the Gaia hypothesis, enough scientific cross-disciplinary support has since been discovered that it’s now commonly referred to as a theory.
Marine phytoplankton -- like these diatoms -- may produce sulfur compounds that can be transmitted into the air, affecting climate. (NOAA image)
One facet of the Gaia theory is that sulfur compounds would be created by microscopic marine organisms — such as phytoplankton and algae — and these compounds could be transmitted into the air, and eventually (in some form) to the land, thus helping to support a sulfur cycle.
Sulfur is a key element in both organic and inorganic compounds. The tenth most abundant element in the Universe, sulfur is crucial to climate regulation — as well as life as we know it.
In particular, two sulfur compounds — dimethylsulfoniopropionate and its atmospherically-oxidized version, dimethylsulfide — are considered to be likely candidates for the products created by marine life. It’s these two compounds that UMD researcher Harry Oduro, along with geochemist and professor James Farquhar and marine biologist Kathryn Van Alstyne (of Western Washington University) have discovered a way to track across multiple environments, from sea to air to land, allowing scientists to trace which isotopes are coming from what sources.
“What Harry did in this research was to devise a way to isolate and measure the sulfur isotopic composition of these two sulfur compounds,” said Farquhar. “This was a very difficult measurement to do right, and his measurements revealed an unexpected variability in an isotopic signal that appears to be related to the way the sulfur is metabolized.”
The team’s research can be used to measure how the organisms are producing the compounds, under which circumstances and how they are ultimately affecting their — and our — environment in the process.
“The ability to do this could help us answer important climate questions, and ultimately better predict climate changes,” said Farquhar. “And it may even help us to better trace connections between dimethylsulfide emissions and sulfate aerosols, ultimately testing a coupling in the Gaia hypothesis.”
Whether or not Earth can be called a singular — or possibly even sentient — living organism of which all organisms are contributing members thereof may still be up for debate, but it is fairly well-accepted that life can shape and alter its own environment (and in the case of humans, often for the worse.) Research like this can help science determine just how far-reaching those alterations may be.
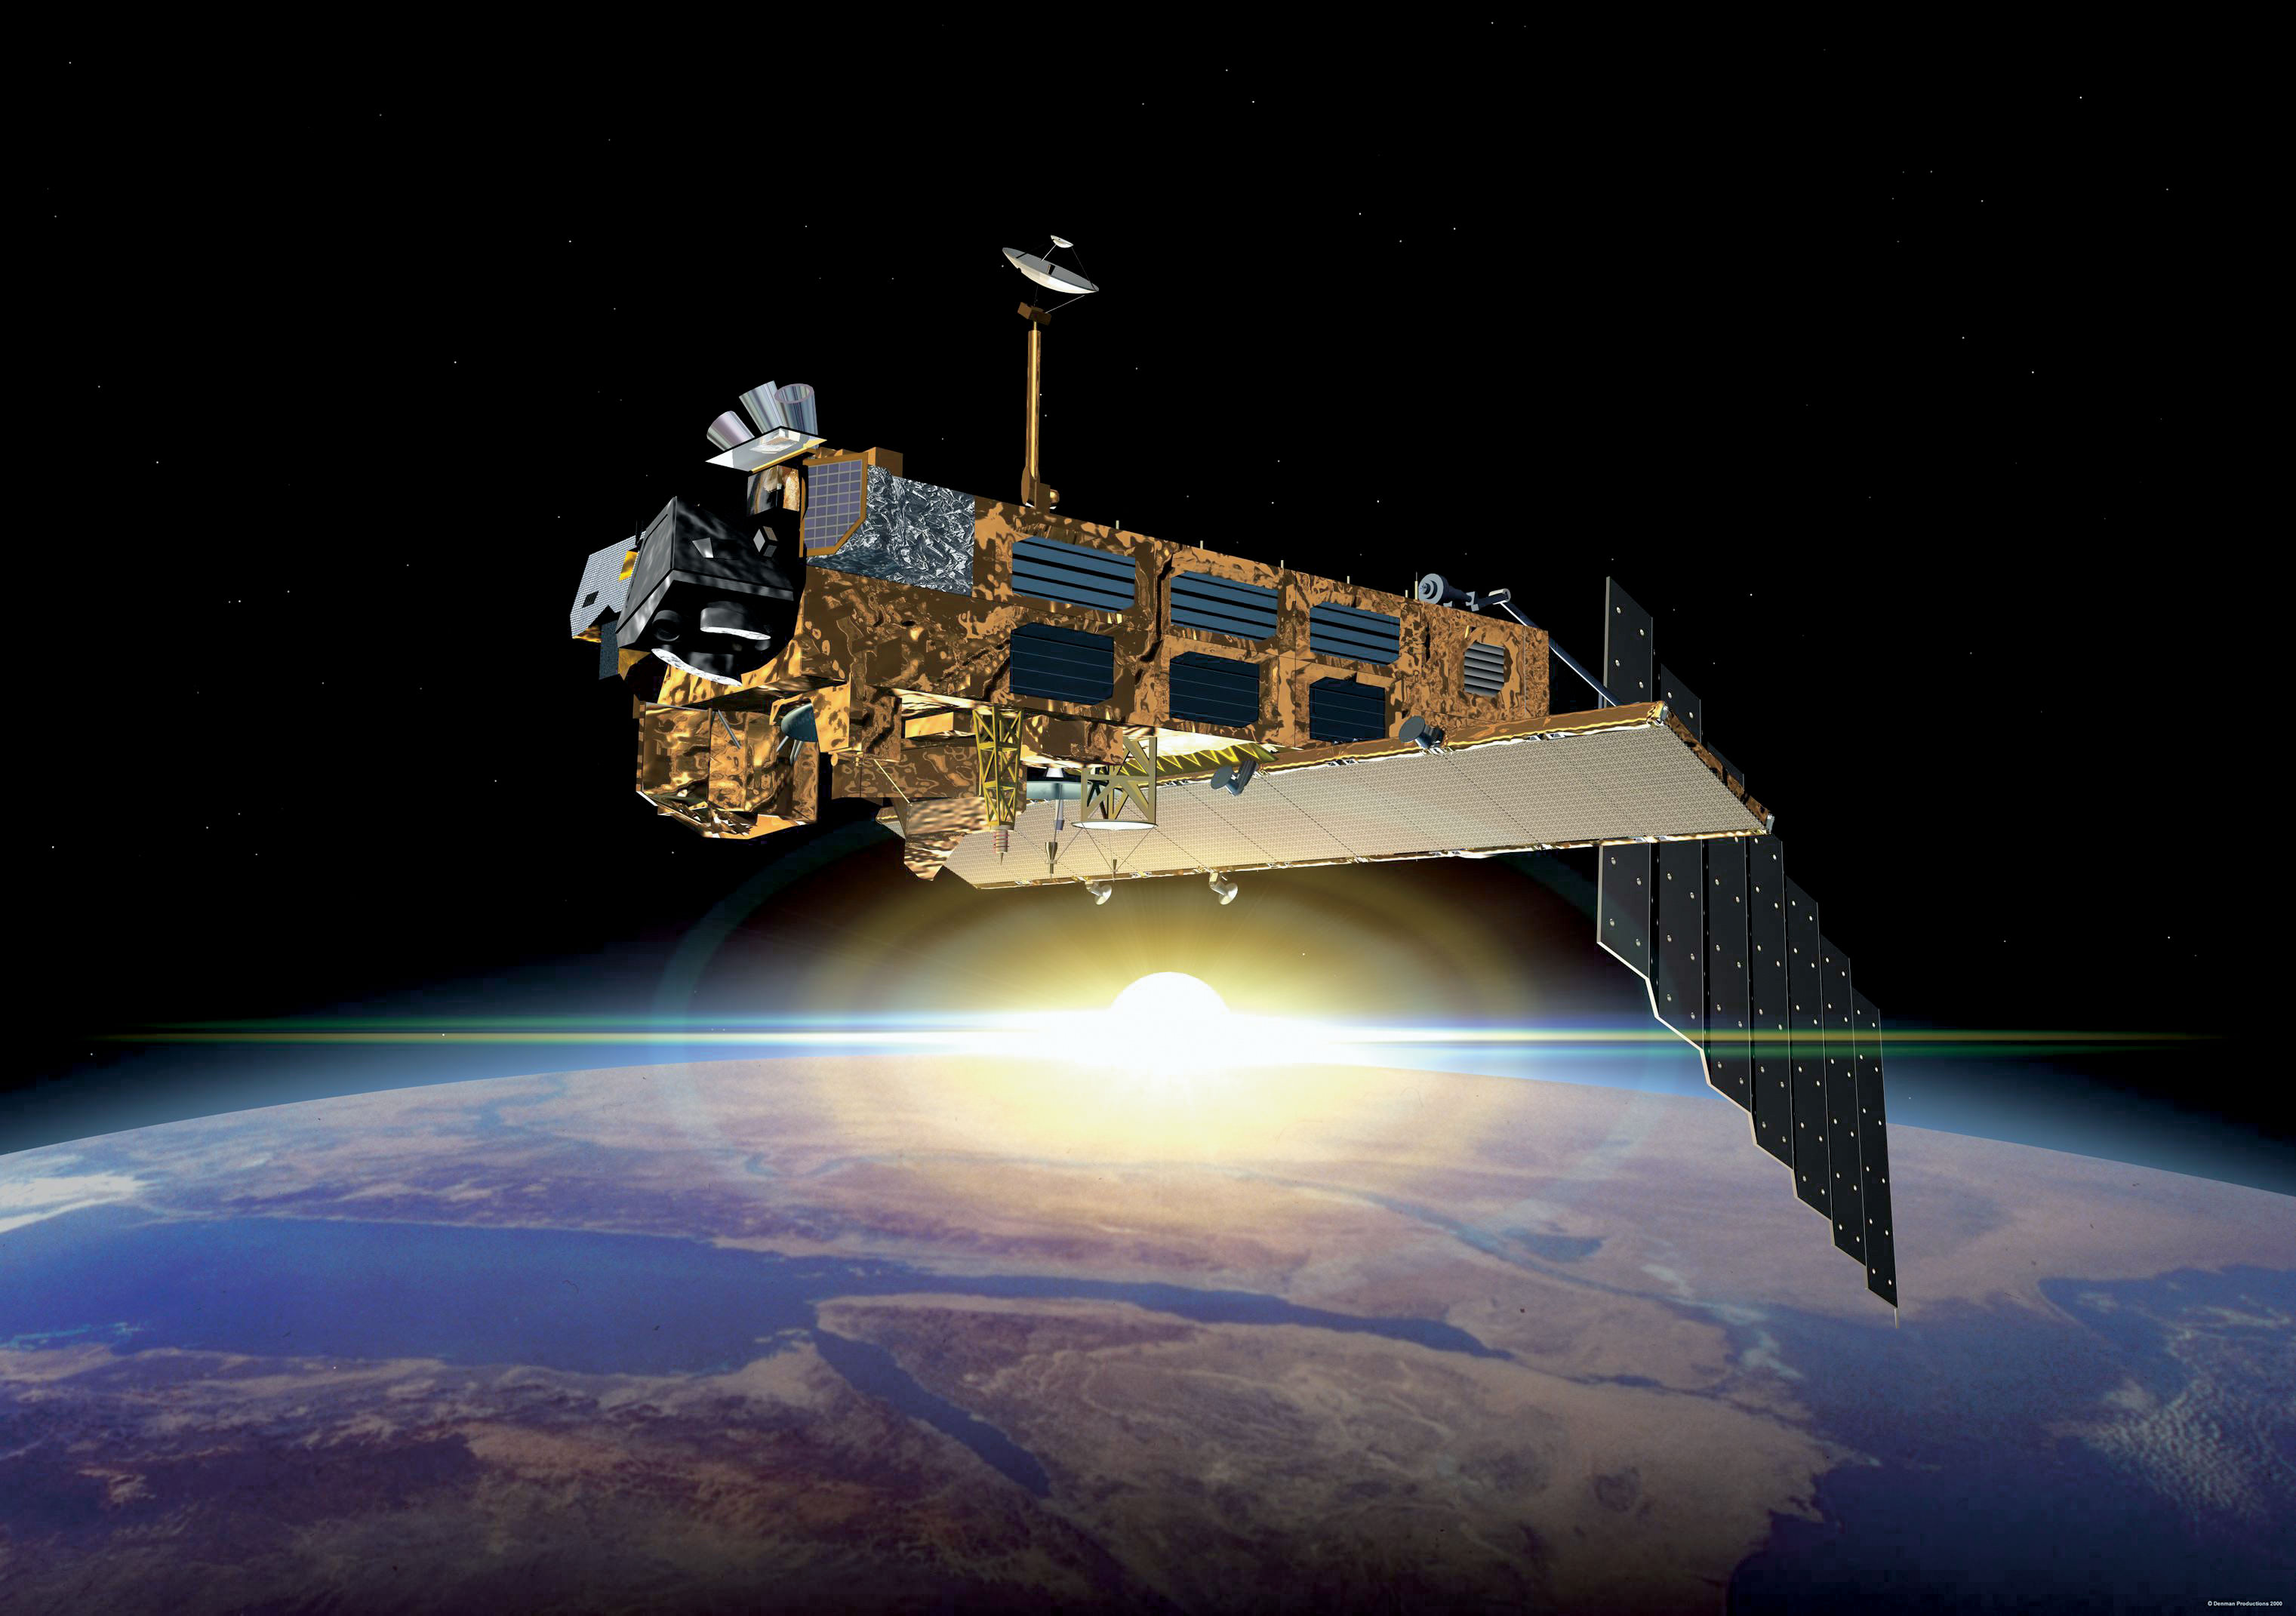
After ten years in orbit Envisat's mission has been declared over. (ESA)
[/caption]
Well, it’s official. After ten years of groundbreaking observation of our planet, ESA has declared the end of the Envisat mission after losing contact with the satellite on April 8, 2012. All attempts to re-establish communication with Envisat have so far been unsuccessful, and although recovery teams will continue to determine the cause of signal loss and try to regain a signal over the next several weeks, the mission — and the satellite — have been retired.
Having performed twice as long as originally planned, the hardworking Envisat has definitely earned its rest.
On April 8, the European Space Agency lost communication with the Earth-observation satellite, preventing reception of data as it passed over the Kiruna station in Sweden. Although later confirmed that the satellite is still in orbit, the recovery team has not been able to re-establish contact.
It’s thought that a loss of a power regulator could be blocking telemetry and telecommands from reaching Envisat, or else the satellite may have experienced a short-circuit and attempted to go into “safe mode” but experienced difficulties during the transition, leaving it in an unknown state.
ESA states that the chances of ever regaining communication with Envisat are extremely low.
While we had reported before on the last image received before falling silent, the image below is actually the final image from Envisat, an X-band image of the Canary Islands.
The final image from Envisat, acquired on April 8, 2012. (ESA/Edisoft)
During its lifetime, Envisat completed 50,000 orbits of Earth and returned over a thousand terabytes of data, containing invaluable measurements of our planet’s surface and atmosphere that were used in more than 2500 science publications.
The video below gives a fitting eulogy for a satellite that’s definitely overachieved and over-performed, giving us a decade of crucial observations of our world from orbit.
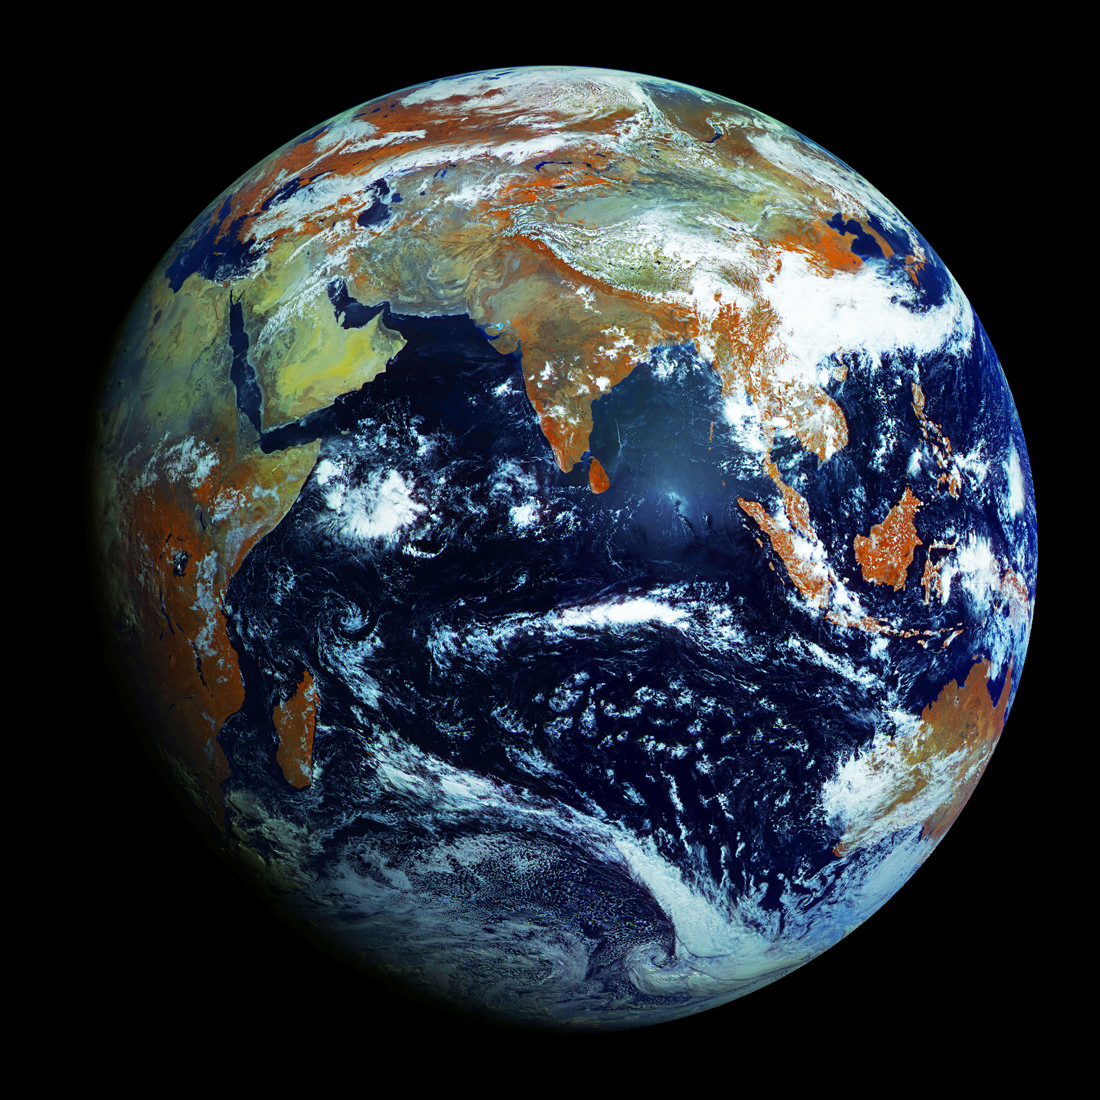
Full-disk image of Earth from Russia's Elektro-L satellite. (NTs OMZ)
[/caption]
Unlike most satellite images of Earth, this one was not assembled from multiple swath scans or digitally projected onto a globe model — it’s the full disk of our planet in captured as a single, enormous 121 megapixel image, acquired by Russia’s Elektro-L weather-forecasting satellite.
Like NASA’s GOES satellites, Elektro-L is parked in a geostationary orbit approximately 36,000 km (22,300 miles) above our planet. Unlike NASA’s satellites, however, Elektro-L captures images in near-infrared as well as visible wavelengths, providing detail about not only cloud movement but also vegetation variations. Its wide-angle Multichannel Scanning Unit (MSU) takes images every 15-30 minutes, showing the same viewpoint of Earth across progressive times of the day.
At a resolution of 0.62 miles per pixel, full-size Elektro-L images are some of the most detailed images of Earth acquired by a weather satellite.
Download the full-size image here (100+ megabytes).
Launched aboard a Zenit rocket on January 20, 2011, Elektro-L was the first major spacecraft to be developed in post-Soviet Russia. Parked over Earth at 76 degrees east longitude, Elektro-L provides local and global weather forecasting and analysis of ocean conditions, as well as “space weather” monitoring — measurements of solar radiation and how it interacts with Earth’s magnetic field. Its initial lifespan is projected to be ten years.
A second Elektro-L satellite is anticipated to launch in 2013.
Image credit: Russian Federal Space Agency / Research Center for Earth Operative Monitoring (NTS OMZ). See more images and video from Elektro-L on James Drake’s Planet Earth here. (Tip of the geostationary hat to Jesus Diaz at Gizmodo.)