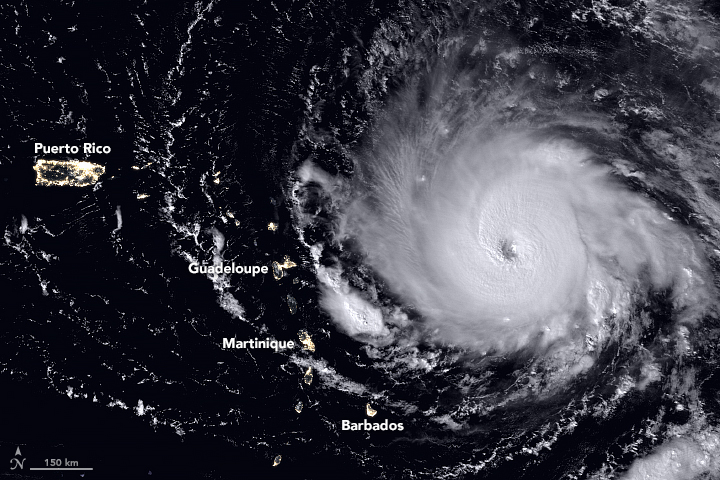
The Visible Infrared Imaging Radiometer Suite (VIIRS) on the Suomi NPP satellite captured this nighttime view of the Category 5 Hurricane Irma in the early hours of September 5, 2017. When the image was acquired, the storm’s center was moving due west. A National Hurricane Center forecast called for the hurricane to turn west-northwest toward the northern Leeward Islands. Credit: NASA, NOAA, Suomi NPP - VIIRS.
Record-setting Hurricane Irma barreled over the Caribbean islands of St. Martin, St. Barthelemy and Anguilla early Wednesday, destroying buildings with its sustained winds of 185 mph (297 kph), with rains and storm surges causing major flooding. The US National Hurricane Center listed the Category 5 Irma as the strongest Atlantic hurricane ever recorded north of the Caribbean and east of the Gulf of Mexico. The storm continues to roar on a path toward the U.S. and British Virgin Islands, Puerto Rico and possibly Florida, or along the southeast coast of the US.
This animation of NOAA’s GOES East satellite imagery from Sept. 3 at 8:15 a.m. EDT (1215 UTC) to Sept. 6 ending at 8:15 a.m. EDT (1215 UTC) shows Category 5 Hurricane Irma as it moved west and track over St. Martin by 8 a.m. EDT on Sept. 6:
Different models have Irma traveling on slightly different paths and officials from all the areas that might possibly be hit are telling people to prepare and follow evacuation orders. National Hurricane Center scientist Eric Blake said via twitter that some models had the storm going one way, and some another. But he cautioned everyone in a potential path should take precautions. “Model trends can be quite misleading- could just change right back. It is all probabilistic at this point. It could still miss [one particular area]. But chances of an extreme event is rising.”
The fleet of Earth-observing satellites are providing incredible views of this monster storm, and even astronauts on board the International Space Station are capturing views:
The International Space Station’s external cameras captured a dramatic view of Hurricane Irma as it moved across the Atlantic Ocean Sept. 5. pic.twitter.com/mc61pt2G8O
GOES-16 view of #HurricaneIrma at 30-second intervals covering 5-hour period ending at 352 AM CDT (9/6), including its passage over Barbuda. pic.twitter.com/WL6l6klPKw
While satellite views provide the most comprehensive view of Irma’s potential track, there’s also a more ‘hands-on’ approach to getting data on hurricanes. NOAA hurricane hunter Nick Underwood posted this video while his plane flew into Hurricane Irma yesterday. The plane’s specialized instruments can take readings on the storm that forecasters can’t get anywhere else:
In the meantime, a launch is scheduled from Cape Canaveral on Thursday, September 7. SpaceX is hoping to launch the US Air Force’s X-37B reusable spaceplane, but current forecasts put only a 50% chance of weather suitable enough on Thursday, and only 40% on Friday. We’ll keep you posted.
For the latest satellite views, the Twitter accounts above are posting regular updates.
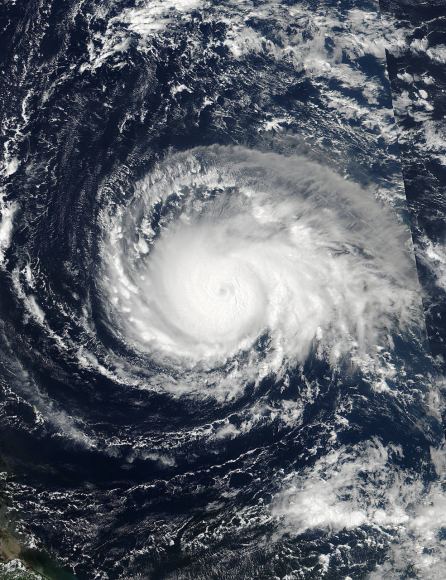
On Sept. 4 at 17:24 UTC, NASA-NOAA’s Suomi NPP satellite captured this view of Hurricane Irma as a Category 4 hurricane approaching the Leeward Islands. Credits: NOAA/NASA Goddard MODIS Rapid Response Team.
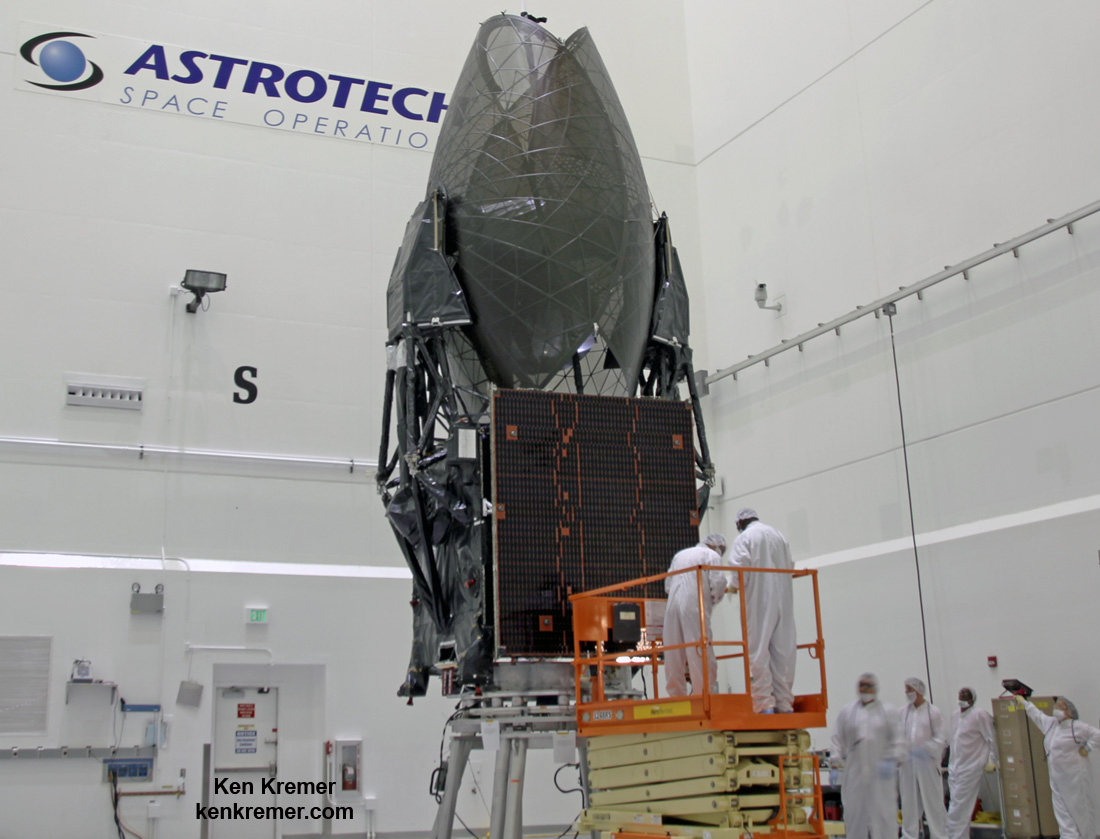
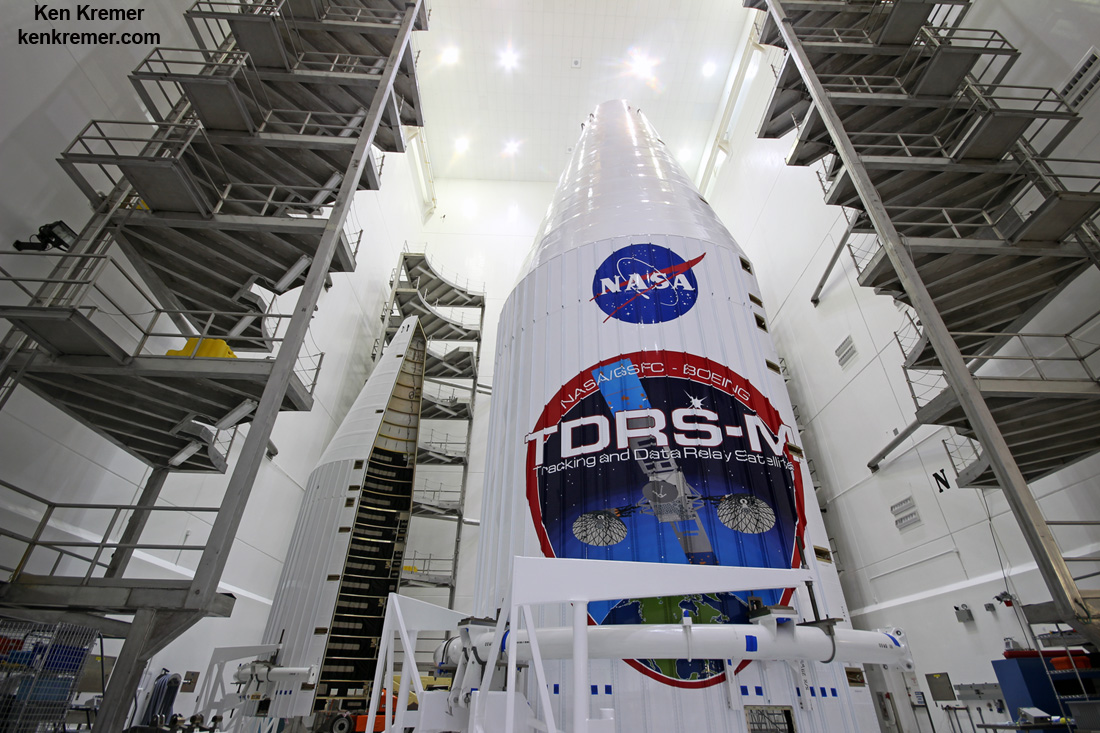
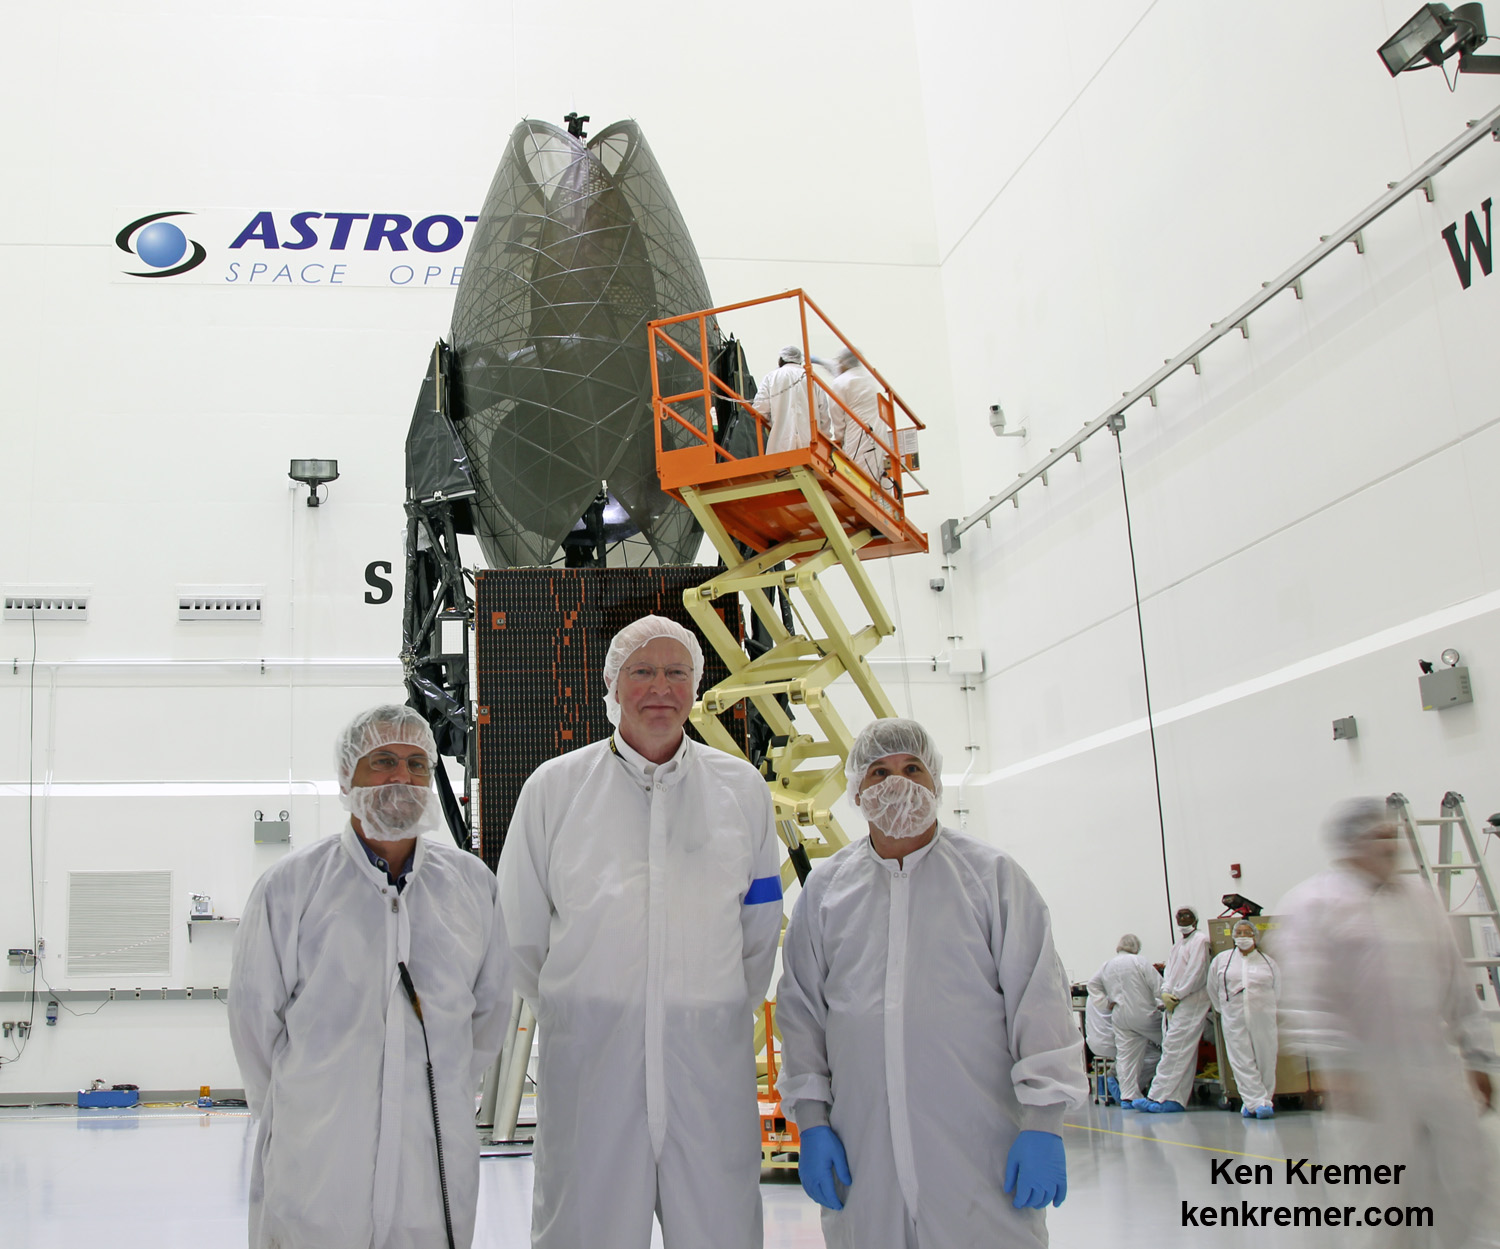
Inside the Astrotech payload processing facility in Titusville, FL,NASA's massive, insect like Tracking and Data Relay Satellite, or TDRS-M, spacecraft is undergoing preflight processing during media visit on 13 July 2017. TDRS-M will transmit critical science data gathered by the ISS, Hubble and numerous NASA Earth science missions. It is being prepared for encapsulation inside its payload fairing prior to being transported to Launch Complex 41 at Cape Canaveral Air Force Station for launch on a United Launch Alliance (ULA) Atlas V rocket on 3 August 2017. Credit: Ken Kremer/kenkremer.com
Inside the Astrotech payload processing facility in Titusville, FL,NASA’s massive, insect like Tracking and Data Relay Satellite, or TDRS-M, spacecraft is undergoing preflight processing during media visit on 13 July 2017. TDRS-M will transmit critical science data gathered by the ISS, Hubble and numerous NASA Earth science missions. It is being prepared for encapsulation inside its payload fairing prior to being transported to Launch Complex 41 at Cape Canaveral Air Force Station for launch on a United Launch Alliance (ULA) Atlas V rocket on 3 August 2017. Credit: Ken Kremer/kenkremer.com
ASTROTECH SPACE OPERATIONS/KENNEDY SPACE CENTER, FL – The last of NASA’s next generation Tracking and Data Relay Satellites (TRDS) designed to relay critical science data and research observations gathered by the International Space Station (ISS), Hubble and dozens of Earth-orbiting Earth science missions is undergoing final prelaunch clean room preparations on the Florida Space Coast while targeting an early August launch – even as the agency reviews the scheduling impact of a weekend “closeout incident” that “damaged” a key component.
Liftoff of NASA’s $408 million eerily insectoid-looking TDRS-M science relay comsat atop a United Launch Alliance (ULA) Atlas V rocket currently scheduled for August 3 may be in doubt following a July 14 work related incident causing damage to the satellite’s Omni S-band antenna while inside the Astrotech Space Operations facility in Titusville, Florida.
“The satellite’s Omni S-band antenna was damaged during final spacecraft closeout activities,” NASA said in an updated status statement provided to Universe Today earlier today, July 16. NASA did not provide any further details when asked.
Everything had been perfectly on track as of Thursday, July 13 as Universe Today participated in an up close media tour and briefing about the massive probe inside the clean room processing facility at Astrotech Space Operations in Titusville, Fl.
On July 13, technicians were busily working to complete final spacecraft processing activities before its encapsulation inside the nose cone of the ULA Atlas V rocket she will ride to space, planned for the next day on July 14. The satellite and pair of payload fairings were stacked in separate high bays at Astrotech on July 13.
Alas the unspecified “damage” to the TDRS-M Omni S-band antenna unfortunately took place on July 14.
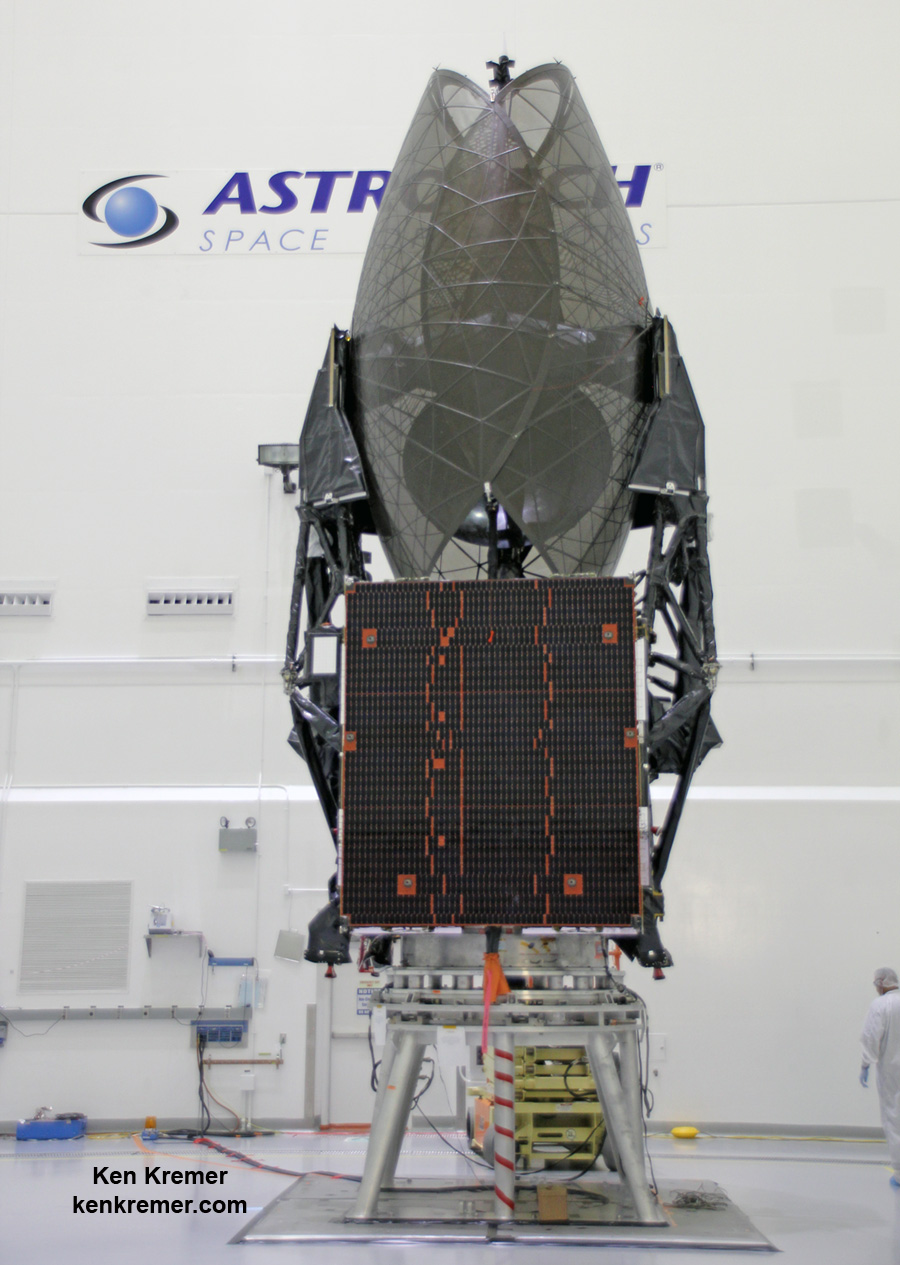
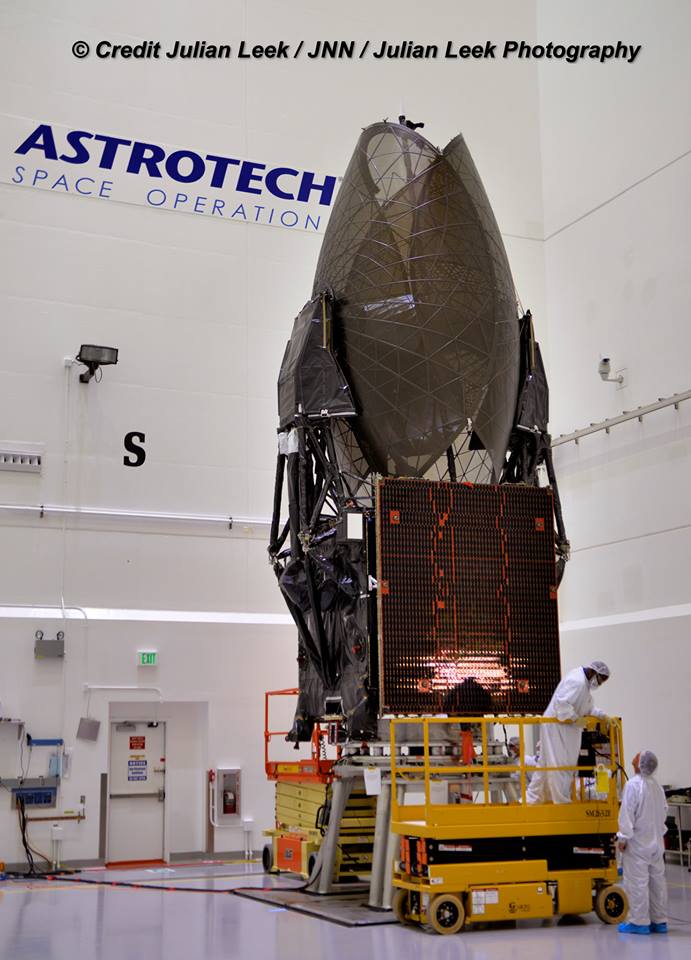
Up close clean room visit with NASA’s newest science data relay comsat – Tracking and Data Relay Satellite-M (TDRS-M) inside the Astrotech payload processing facility high bay in Titusville, FL. Two gigantic fold out antennae’s, plus space to ground antenna dish visible inside the ‘cicada like cocoon’ with solar arrays below. Omni S-band antenna at top. Launch on ULA Atlas V slated for August 2017 from Cape Canaveral Air Force Station, Fl. Credit: Ken Kremer/kenkremer.com
TDRS-M was built by Boeing and engineers are now analyzing the damage in a team effort with NASA. However it’s not known exactly during which closeout activity or by whom the damage occurred.
ULA CEO Tory Bruno tweeted that his company is not responsible and referred all questions to NASA. This may indicate that the antennae was not damaged during the encapsulation procedures inside the ULA payload fairing halves.
“NASA and Boeing are reviewing an incident that occurred with the Tracking and Data Relay Satellite (TDRS-M) on July 14 at Astrotech Space Operations in Titusville, Florida. The satellite’s Omni S-band antenna was damaged during final spacecraft closeout activities” stated NASA.
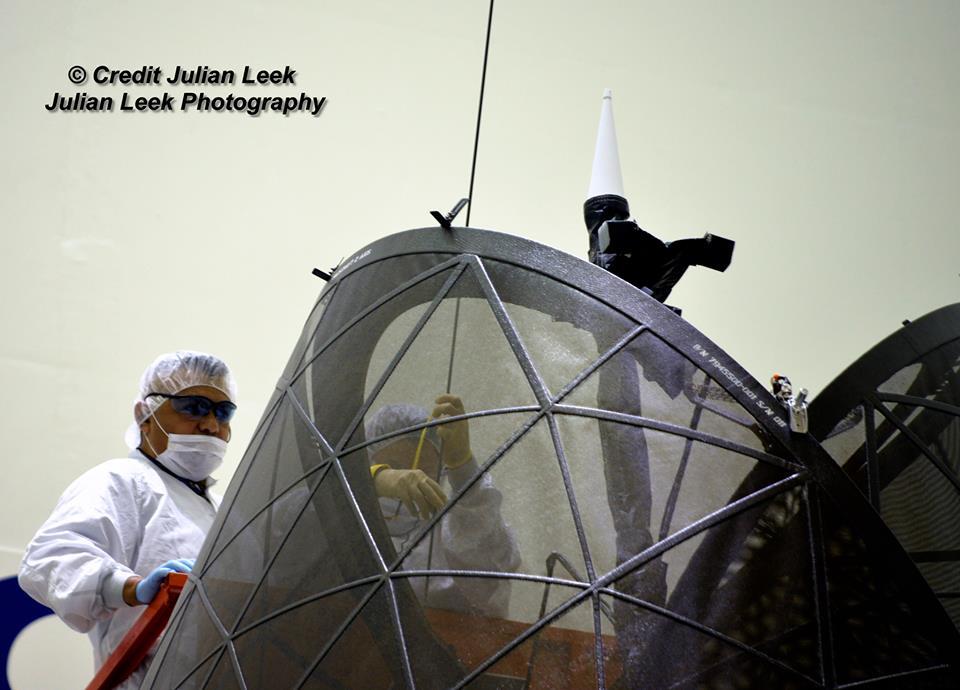
Up close look at the NASA TDRS-M satellite Omni S-band antenna damaged during clean room processing on July 14, 2017. Launch on ULA Atlas V is slated for Aug. 2017. Credit: Julian Leek
TDRS-M looks like a giant insect – or a fish depending on your point of view. It was folded into flight configuration for encapsulation in the clean room and the huge pair of single access antennas resembled a cocoon or a cicada. The 15 foot diameter single access antennas are large parabolic-style antennas and are mechanically steerable.
What does TDRS do? Why is it important? How does it operate?
“The existing Space Network of satellites like TDRS provide constant communications from other NASA satellites like the ISS or Earth observing satellites like Aura, Aqua, Landsat that have high bandwidth data that needs to be transmitted to the ground,” TDRS Deputy Project Manager Robert Buchanan explained to Universe Today during an interview in the Astrotech clean room.
“TRDS tracks those satellites using antennas that articulate. Those user satellites send the data to TDRS, like TDRS-M we see here and nine other TDRS satellites on orbit now tracking those satellites.”
“That data acquired is then transmitted to a ground station complex at White Sands, New Mexico. Then the data is sent to wherever those user satellites want the data to be sent is needed, such as a science data ops center or analysis center.”
Once launched and deployed in space they will “take about 30 to 40 days to fully unfurl,” Buchanan told me in the Astrotech clean room.
Astrotech is located just a few miles down the road from NASA’s Kennedy Space Center and the KSC Visitor Complex housing the finest exhibits of numerous spaceships, hardware items and space artifacts.
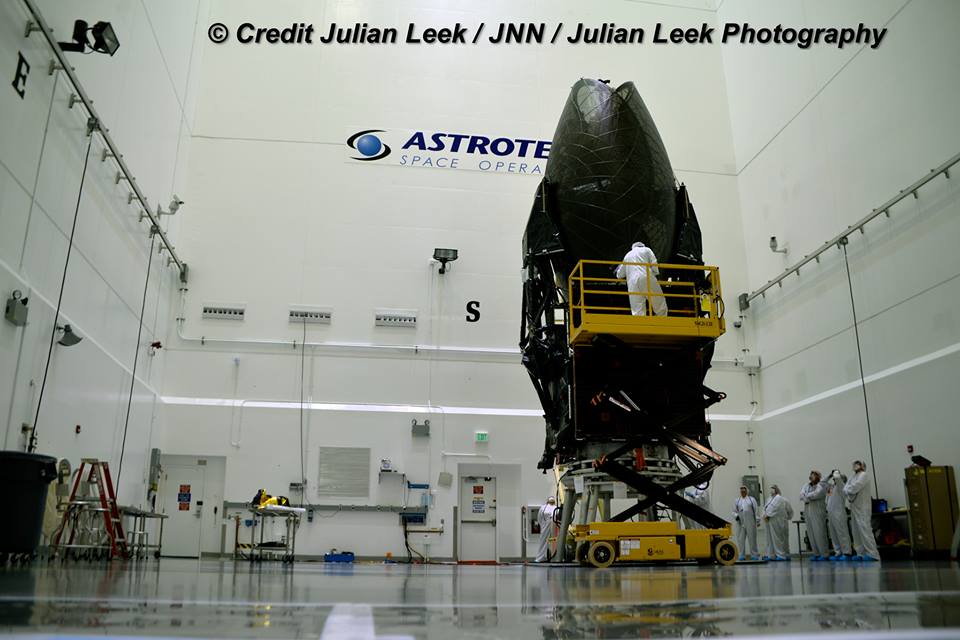
Preflight clean room processing inside the Astrotech payload processing facility preparing NASA’s Tracking and Data Relay Satellite, or TDRS-M, spacecraft for launch on ULA Atlas V in Aug. 2017. Credit: Julian Leek
At this time, the TDRS-M website countdown clock is still ticking down towards a ULA Atlas V blastoff on August 3 at 9:02 a.m. EDT (1302 GMT) from Space Launch Complex 41 (SLC-41) on Cape Canaveral Air Force Station, for a late breakfast delight.
The Aug. 3 launch window spans 40 minutes from 9:02 to 9:42 a.m. EDT.
Whether or not the launch date will change depends on the results of the review of the spacecraft’s health by NASA and Boeing. Several other satellites are also competing for launch slots in August.
“The mission team is currently assessing flight acceptance and schedule. TDRS-M is planned to launch Aug. 3, 2017, on an United Launch Alliance (ULA) Atlas V rocket from Cape Canaveral Air Force Station in Florida,” NASA explained.
NASA’s Tracking and Data Relay Satellite, or TDRS-M, spacecraft will be encapsulated inside these two protective payload fairing halves inside the Astrotech payload processing facility high bay in Titusville, FL. Launch on ULA Atlas V slated for August 2017 from Cape Canaveral Air Force Station, Fl. Credit: Ken Kremer/kenkremer.com
TDRS-M, spacecraft, which stands for Tracking and Data Relay Satellite – M is NASA’s new and advanced science data relay communications satellite that will transmit research measurements and analysis gathered by the astronaut crews and instruments flying abroad the International Space Station (ISS), Hubble Space Telescope and over 35 NASA Earth science missions including MMS, GPM, Aura, Aqua, Landsat, Jason 2 and 3 and more.
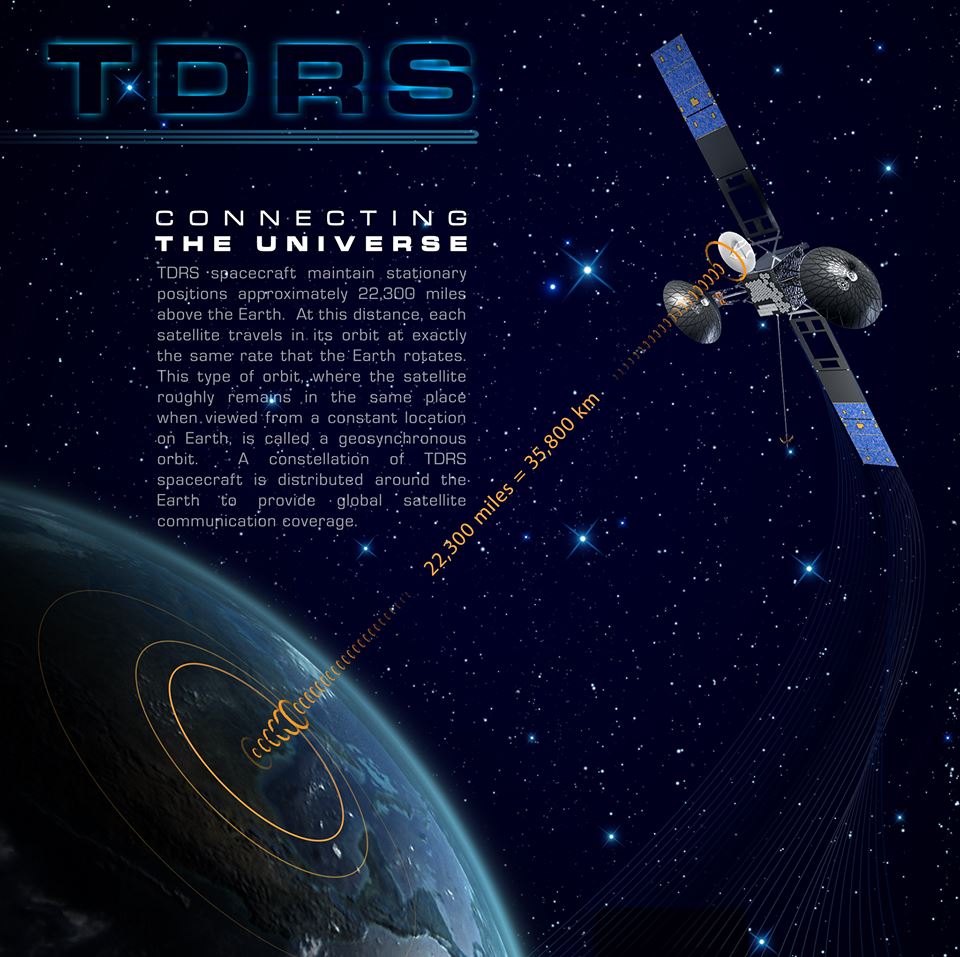
The TDRS constellation orbits 22,300 miles above Earth and provide near-constant communication links between the ground and the orbiting satellites.
Preflight clean room processing inside the Astrotech payload processing facility preparing NASA’s Tracking and Data Relay Satellite, or TDRS-M, spacecraft for launch on ULA Atlas V in Aug. 2017. Credit: Julian Leek
TRDS-M will have S-, Ku- and Ka-band capabilities. Ka has the capability to transmit as much as six-gigabytes of data per minute. That’s the equivalent of downloading almost 14,000 songs per minute says NASA.
The TDRS program is managed by NASA’s Goddard Space Flight Center in Greenbelt, Maryland.
TDRS-M is the third satellite in the third series of NASA’s American’s most powerful and most advanced Tracking and Data Relay Satellites. It is designed to last for a 15 year orbital lifetime.
The first TDRS satellite was deployed from the Space Shuttle Challenger in 1983 as TDRS-A.
TDRS-M was built by prime contractor Boeing in El Segundo, California and is the third of a three satellite series – comprising TDRS -K, L, and M. They are based on the Boeing 601 series satellite bus and will be keep the TDRS satellite system operational through the 2020s.
TDSR-K and TDRS-L were launched in 2013 and 2014.
The Tracking and Data Relay Satellite project is managed at NASA’s Goddard Space Flight Center.
TDRS-M was built as a follow on and replacement satellite necessary to maintain and expand NASA’s Space Network, according to a NASA description.
The gigantic satellite is about as long as two school buses and measures 21 meters in length by 13.1 meters wide.
It has a dry mass of 1800 kg (4000 lbs) and a fueled mass of 3,454 kilogram (7,615 lb) at launch.
Tracking and Data Relay Satellite artwork explains how the TDRS constellation enables continuous, global communications coverage for near-Earth spacecraft. Credit: NASA
TDRS-M will blastoff on a ULA Atlas V in the baseline 401 configuration, with no augmentation of solid rocket boosters on the first stage. The payload fairing is 4 meters (13.1 feet) in diameter and the upper stage is powered by a single-engine Centaur.
TDRS-M will be launched to a Geostationary orbit some 22,300 miles (35,800 km) above Earth.
“The final orbital location for TDRS-M has not yet been determined,” Buchanen told me.
The Atlas V booster is being assembled inside the Vertical Integration Facility (VIF) at SLC-41 and will be rolled out to the launch pad the day before liftoff with the TDRS-M science relay comsat comfortably encapsulated inside the nose cone.
NASA/contractor team poses with the Boeing built and to be ULA launched Tracking and Data Relay Satellite-M inside the inside the Astrotech payload processing facility clean room high bay in Titusville, FL, on July 13, 2017. Launch on ULA Atlas V slated for August 2017 from Cape Canaveral Air Force Station, Fl. Credit: Ken Kremer/kenkremer.com
Carefully secured inside its shipping container, the TDRS-M satellite was transported on June 23 by a US Air Force cargo aircraft from Boeing’s El Segundo, California facility to Space Coast Regional Airport in Titusville, Florida, for preflight processing at Astrotech.
Watch for Ken’s onsite TDRS-M and space mission reports direct from the Kennedy Space Center and Cape Canaveral Air Force Station, Florida.
Stay tuned here for Ken’s continuing Earth and Planetary science and human spaceflight news.
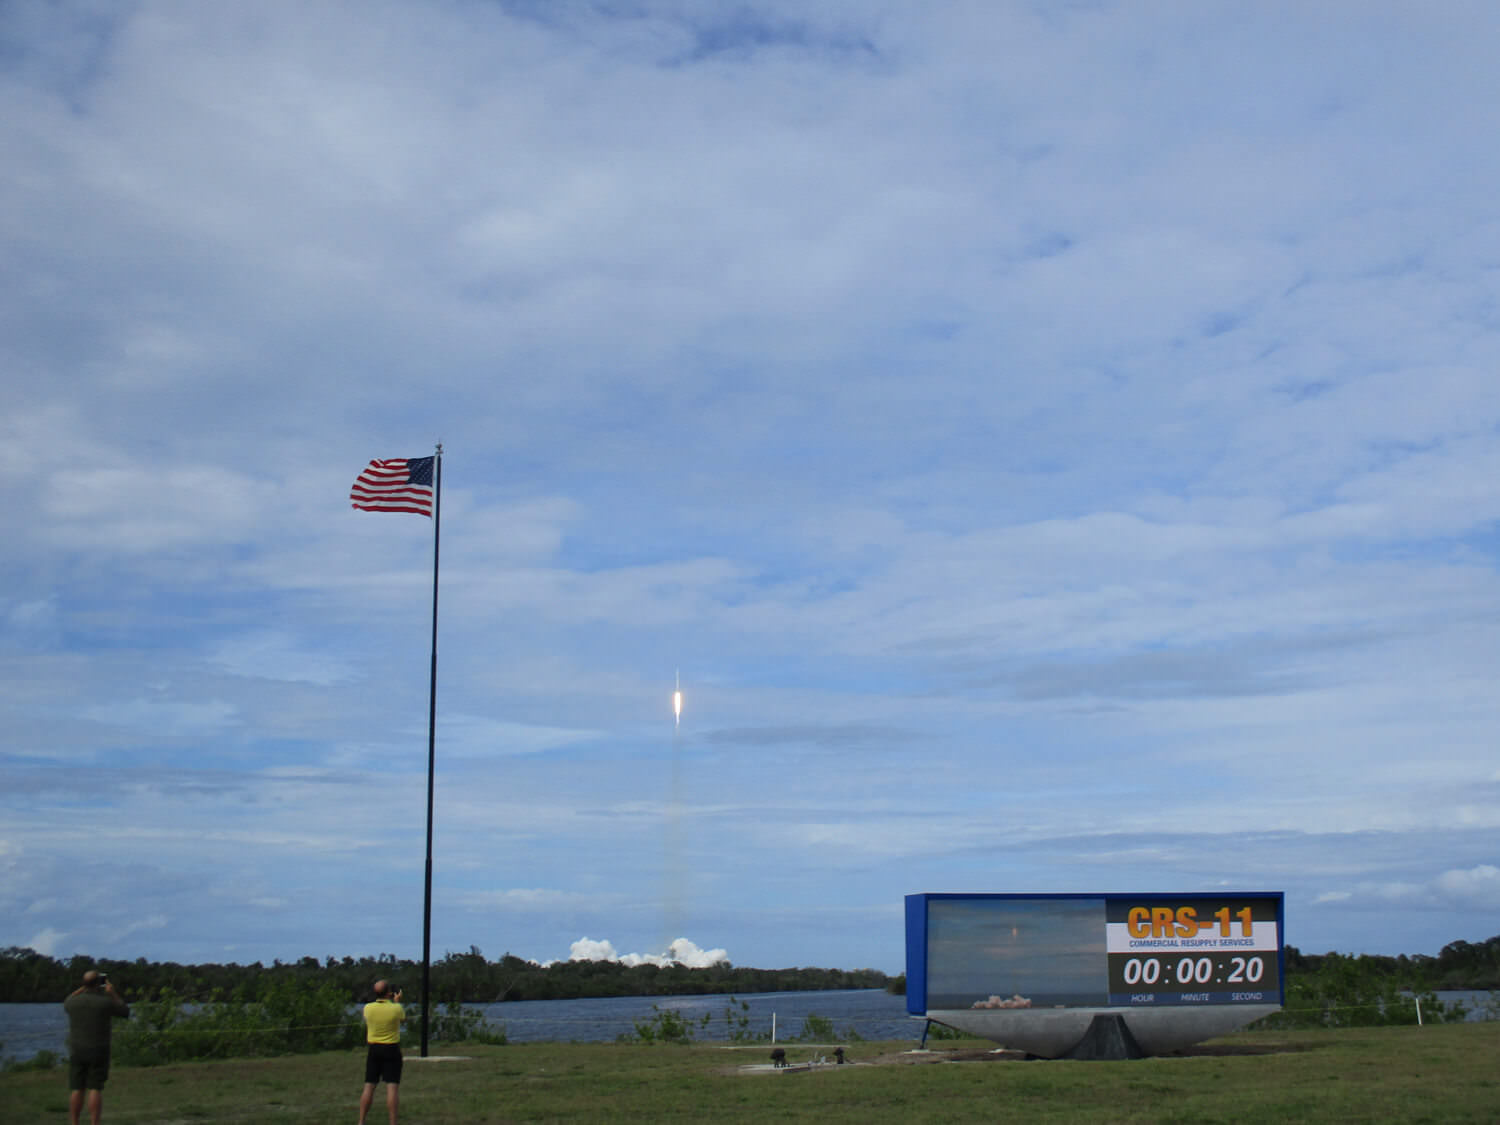
Blastoff of SpaceX Falcon 9 rocket from Launch Complex 39A at the Kennedy Space Center at 5:07 p.m. EDT on June 3, 2017, on Dragon CRS-11 resupply mission to the International Space Station (ISS) for NASA. Credit: Ken Kremer/kenkremer.com
Blastoff of SpaceX Falcon 9 rocket from Launch Complex 39A at the Kennedy Space Center) at 5:07 p.m. EDT on June 3, 2017, on Dragon CRS-11 resupply mission to the International Space Station (ISS) for NASA. Credit: Ken Kremer/kenkremer.com
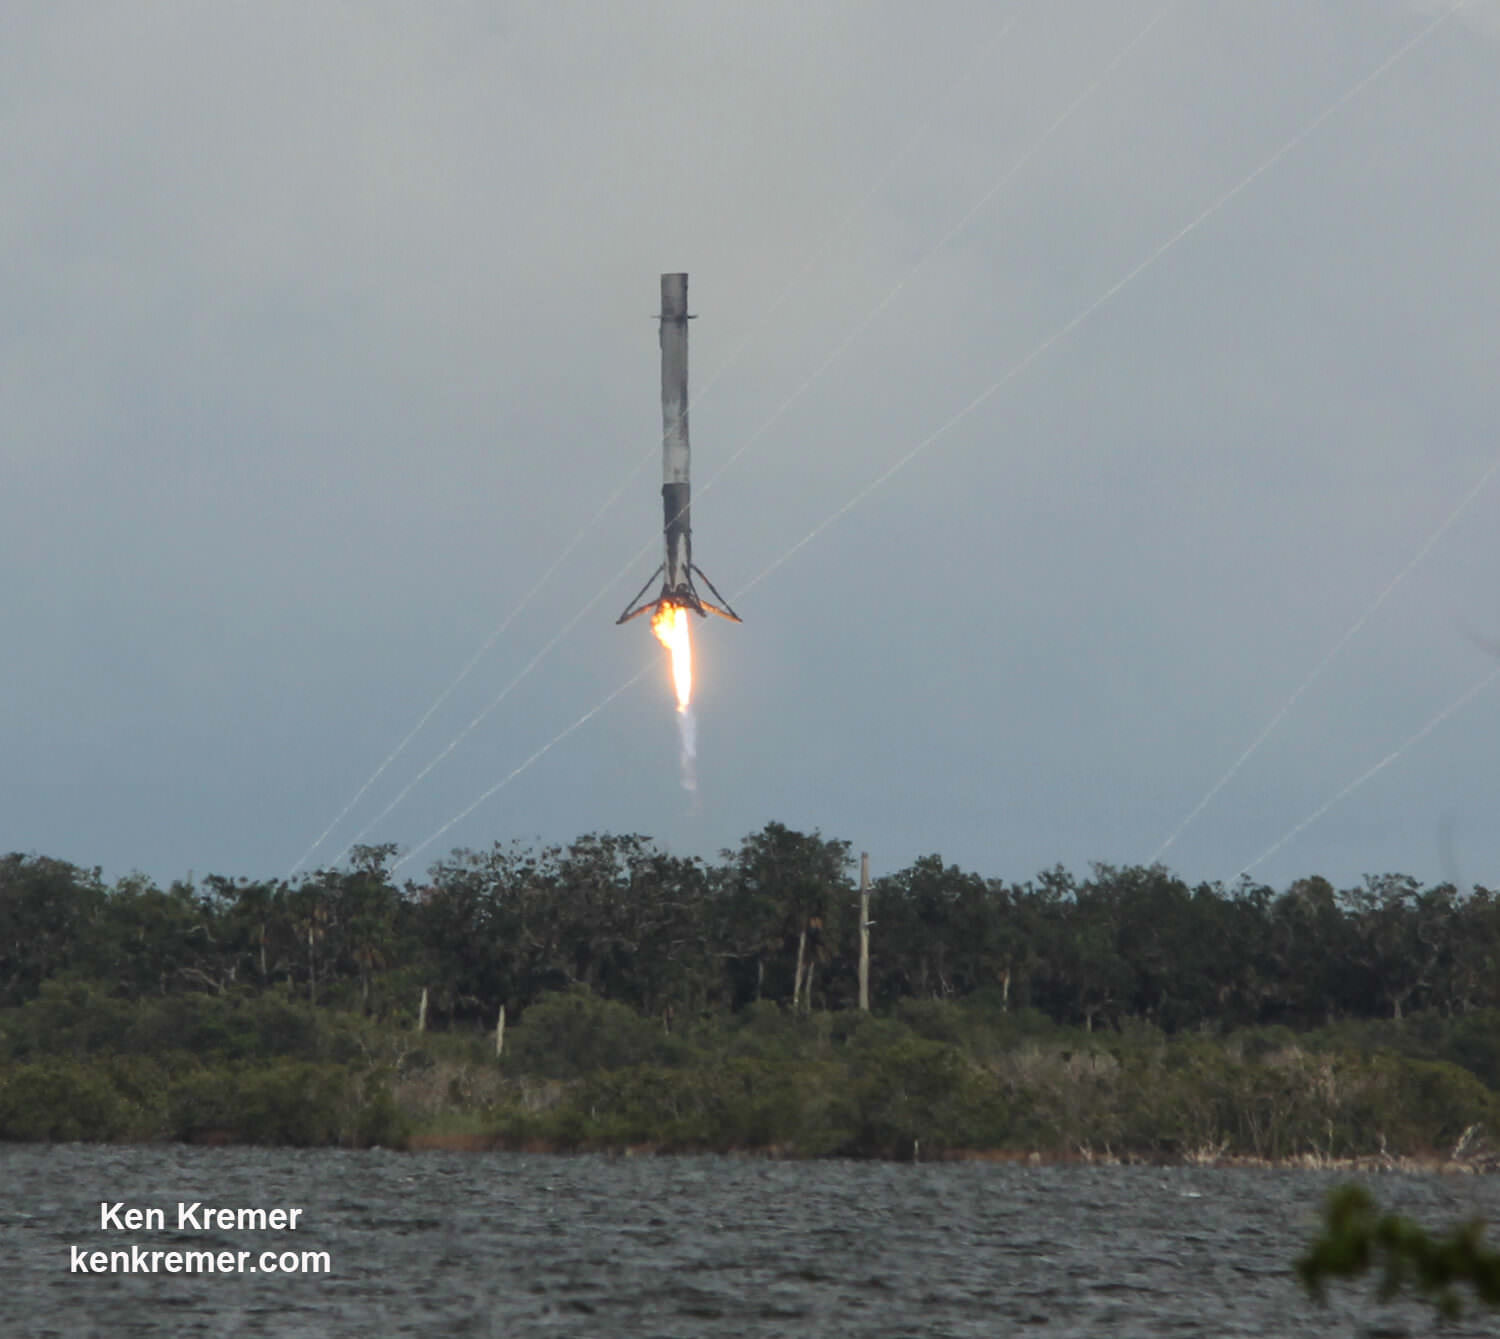
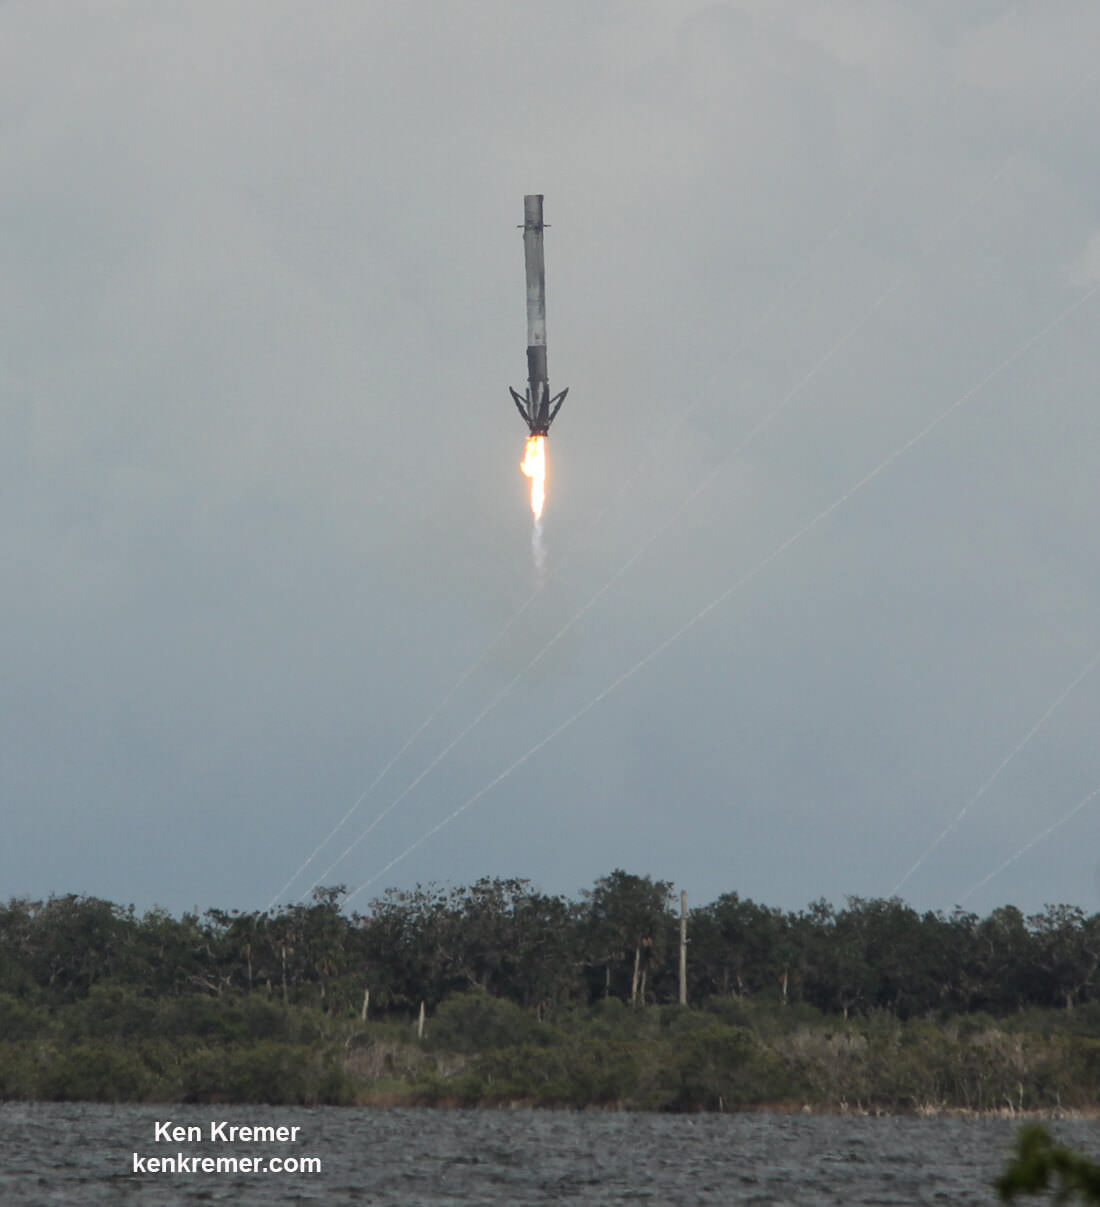
Nearly simultaneously the first stage booster accomplished another heart stopping and stupendous ground landing back at the Cape accompanied by multiple shockingly loud sonic booms screeching out dozens of miles (km) in all directions across the space coast region.
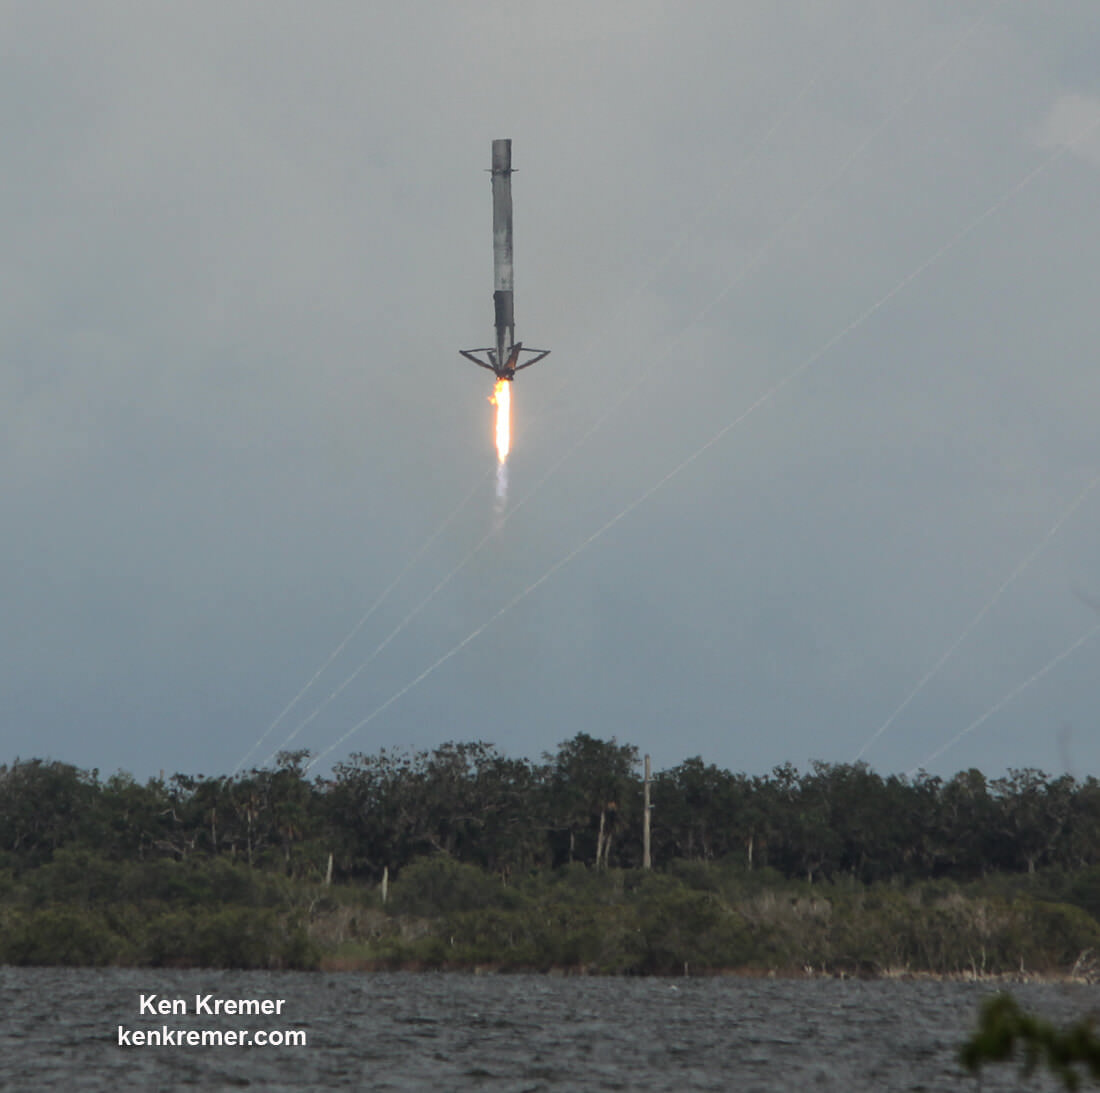
SpaceX Falcon 9 booster deploys quartet of landing legs moments before precision propulsive ground touchdown at Landing Zone 1 on Canaveral Air Force Station barely nine minutes after liftoff from Launch Complex 39A on 3 June 2017 from the Kennedy Space Center in Florida on the Dragon CRS-11 resupply mission to the International Space Station for NASA. Credit: Ken Kremer/Kenkremer.com
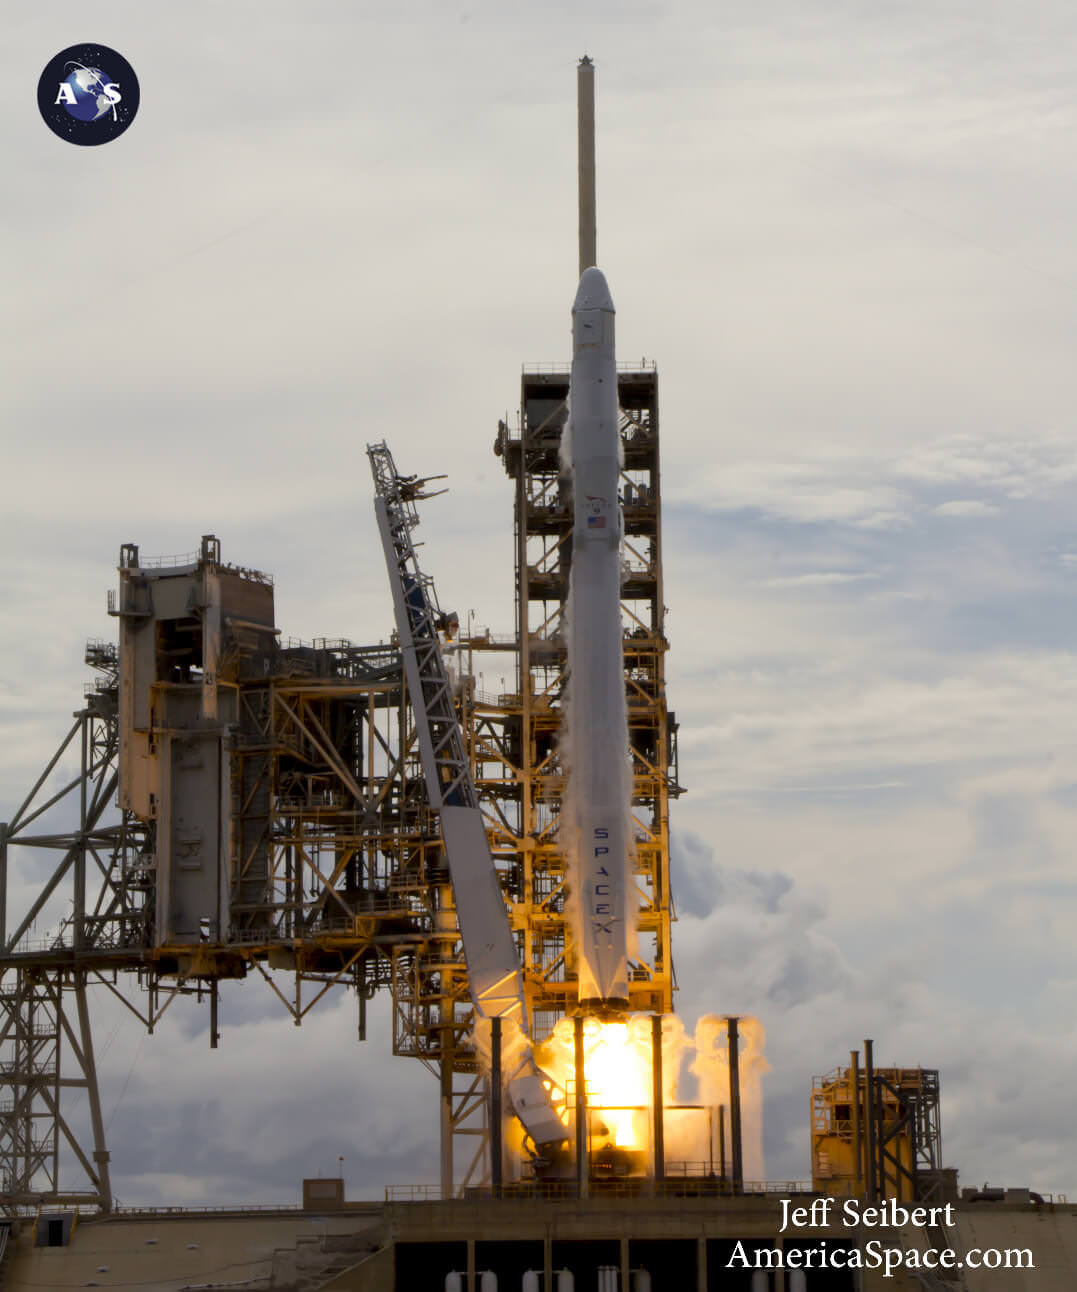
Liftoff of the SpaceX Falcon 9 rocket carrying the unmanned Dragon cargo freighter from seaside Launch Complex 39A at KSC in Florida took place during an instantaneous launch window at 5:07 p.m. EDT Saturday, June 3, after a predicted downpour held off just long enough for the SpaceX launch team to get the rocket safely off the ground.
The launch took place after a 48 hour scrub from Thursday June 1 forced by stormy weather and lightning strikes came within 10 miles of pad 39A less than 30 minutes from the planned liftoff time.
The backup crew of 40 new micestonauts are also aboard for a first of its kind osteoporosis science study – that seeks to stem the loss of bone density afflicting millions of people on Earth and astronauts crews in space by testing an experimental drug called NELL-1. The 40 originally designated mice lost their coveted slot and were swapped out Friday due to the scrub.
The 213-foot-tall (65-meter-tall) SpaceX Falcon 9 roared to life off pad 39A upon ignition of the 9 Merlin 1 D first stage engines generating 1.7 million pounds of liftoff thrust and successfully delivered the Dragon bolted on top to low Earth orbit on course for the space station and jam packed with three tons of essential cargo.
Loading of the densified liquid oxygen and RP-1 propellants into the Falcon 9 first and second stages starting about 70 minutes prior to ignition. Everything went off without a hitch.
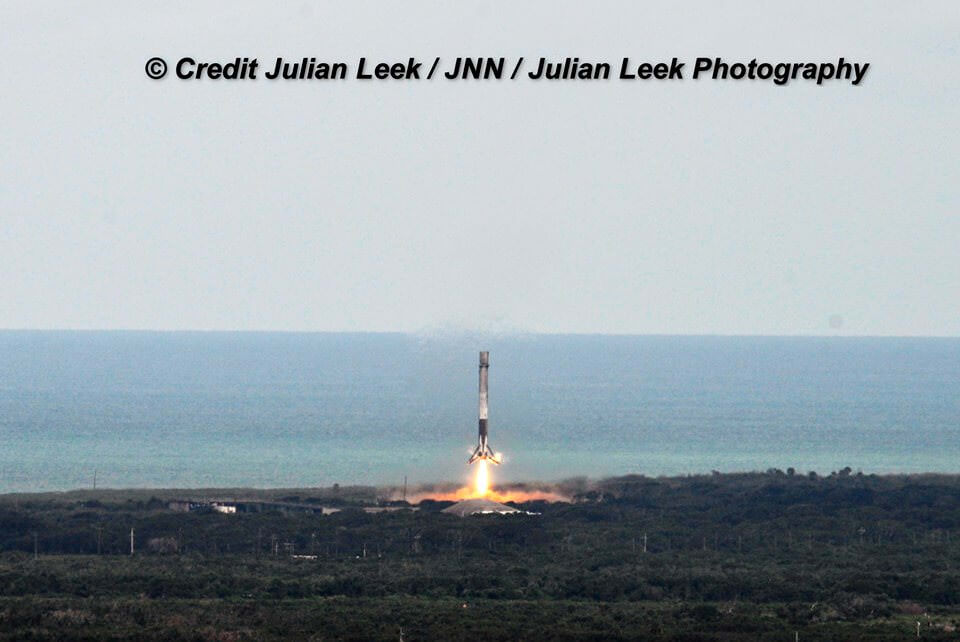
Final descent of the SpaceX Falcon 9 1st stage landing as seen from the NASA Causeway under heavily overcast skies after Jun 3, 2017 launch from pad 39A at the Kennedy Space Center. The booster successfully soft landed upright at Landing Zone-1 (LZ-1) accompanied by multiple sonic booms at Cape Canaveral Air Force Station, Florida, about 8 minutes after launch to the International Space Station (ISS). Note SpaceX logo lettering visible on booster skin. Credit: Ken Kremer/kenkremer.com
Dragon reached its preliminary orbit 10 minutes after launch and deployed its power generating solar arrays. It now set out on a carefully choreographed series of thruster firings to reach the space station Monday morning.
Following stage separation at 2 min 25 sec after liftoff, the first stage began a series of three burns (boostback, entry and landing) to carry out a precision propulsive ground landing back at Cape Canaveral Air Force Station, FL at Landing Zone-1 (LZ-1).
SpaceX Falcon 9 booster starts landing leg deployment moments before precision propulsive ground touchdown at Landing Zone 1 on Canaveral Air Force Station barely eight minutes after liftoff from pad 39A on 3 June 2017 from the Kennedy Space Center in Florida on the Dragon CRS-11 resupply mission to the International Space Station for NASA. Credit: Ken Kremer/Kenkremer.com
The 156-foot-tall (47-meter-tall) first stage successfully touched down upright at LZ-1 some 8 minutes after liftoff as I witnessed from the NASA Causeway and seen in photos from myself and colleagues herein.
LZ-1 is located about 9 miles (14 kilometers) south of the starting point at pad 39A.
Descent of SpaceX Falcon 9 1st stage towards Landing Zone-1 at Cape Canaveral after Jun 3, 2017 launch from pad 39A at the Kennedy Space Center. Credit: Julian Leek
Thus overall SpaceX has now successfully recovered 11 boosters; 5 by land and 6 by sea, over the past 18 months – in a feat straight out of science fiction but aimed at drastically slashing the cost of access to space as envisioned by SpaceX billionaire CEO and founder Elon Musk.
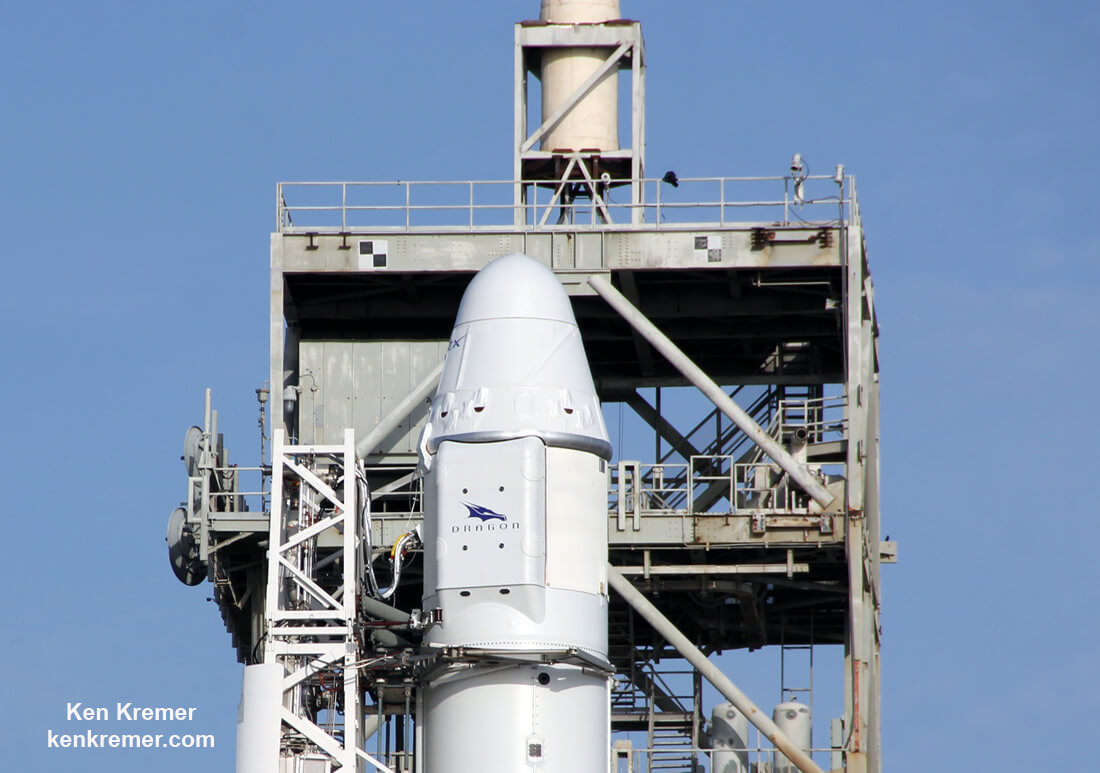
Another significant milestone for this flight is that it features the first reuse of a previously launched Dragon. It previously launched on the CRS-4 resupply mission.
The recycled Dragon has undergone some refurbishments to requalify it for flight but most of the structure is intact, according to SpaceX VP for Mission Assurance Hans Koenigsmann.
The 20-foot high, 12-foot-diameter Dragon is carrying almost 5,970 pounds of science experiments and research instruments, crew supplies, food water, clothing, hardware, gear and spare parts to the million pound orbiting laboratory complex. This will support over 62 of the 250 research investigations and experiments being conducted by Expedition 52 and 53 crew members.
See detailed CRS-11 cargo mission cargo below.
Blastoff of SpaceX Falcon 9 with reused Dragon CRS-11 cargo craft from Launch Complex 39A at NASA’s Kennedy Space Center in Florida at 5:07 p.m. on June 3, 2017. Credit: Julian Leek
Dragon CRS-11 marks SpaceX’s eleventh contracted commercial resupply services (CRS) mission to the International Space Station for NASA since 2012.
Falcon 9 streaked to orbit in spectacular fashion darting in and out of clouds for the hordes of onlookers and spectators who had gathered from around the globe to witness the spectacle of a rocket launch and booster landing first hand.
Recycled SpaceX Dragon CRS-11 cargo craft lifted off from Launch Complex 39A at NASA’s Kennedy Space Center in Florida at 5:07 p.m. June 3, 2017 carrying 3 tons of research equipment, cargo and supplies to Earth orbit and the International Space Station. Credit: Ken Kremer/kenkremer.com
Dragon is loaded with “major experiments that will look into the human body and out into the galaxy.”
The flight will deliver investigations and facilities that study neutron stars, osteoporosis, solar panels, tools for Earth-observation, and more.
The unpressurized trunk of the spacecraft also will transport 3 payloads for science and technology experiments and demonstrations.
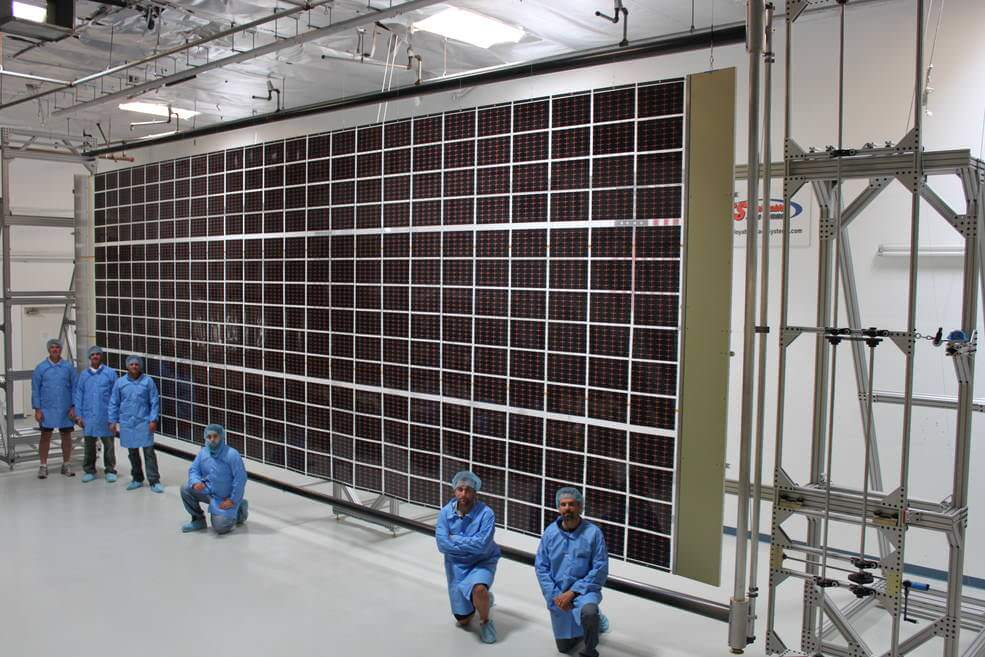
The truck payloads include the Roll-Out Solar Array (ROSA) solar panels, the Multiple User System for Earth Sensing (MUSES) facility which hosts Earth-viewing instruments and tools for Earth-observation and equipment to study neutron stars with the Neutron Star Interior Composition Explorer (NICER) payload.
NICER is the first ever space mission to study the rapidly spinning neutron stars – the densest objects in the universe. The launch coincidentally comes nearly 50 years after they were discovered by British astrophysicist Jocelyn Bell.
A second objective of NICER involves the first space test attempting to use pulsars as navigation beacons through technology called Station Explorer for X-Ray Timing and Navigation (SEXTANT).
Roll Out Solar Array (ROSA) is among the science investigations launching on the next SpaceX commercial resupply flight to the International Space Station, targeted for June 1, 2017. Credits: Deployable Space Systems, Inc.
If all goes well, Dragon will arrive at the ISS 2 days after launch and be grappled by Expedition 52 astronauts Peggy Whitson and Jack Fischer using the 57.7 foot long (17.6 meter long) Canadian-built robotic arm.
They will berth Dragon at the Earth-facing port of the Harmony module.
NASA TV will begin covering the Dragon rendezvous and grappling activities starting at 8:30 a.m. Monday.
Dragon CRS-11 is SpaceX’s second contracted resupply mission to launch this year for NASA.
The prior SpaceX cargo ship launched on Feb 19, 2017 on the CRS-10 mission to the space station. CRS-10 is further noteworthy as being the first SpaceX launch of a Falcon 9 from NASA’s historic pad 39A.
Overall CRS-11 marks the 100th launch from pad 39A and the sixth SpaceX launch from this pad.
SpaceX leased pad 39A from NASA in 2014 and after refurbishments placed the pad back in service this year for the first time since the retirement of the space shuttles in 2011. To date this is the sixth SpaceX launch from this pad.
Previous launches include 11 Apollo flights, the launch of the unmanned Skylab in 1973, 82 shuttle flights and five SpaceX launches.
June 3, 2017 liftoff of SpaceX Falcon 9 with reused Dragon CRS-11 cargo craft from Launch Complex 39A at NASA’s Kennedy Space Center in Florida at 5:07 p.m. on June 3, 2017. Credit: Jeff Seibert
Cargo Manifest for CRS-11:
TOTAL CARGO: 5970.1 lbs. / 2708 kg
TOTAL PRESSURIZED CARGO WITH PACKAGING: 3761.1 lbs. / 1665 kg
• Science Investigations 2356.7 lbs. / 1069 kg
• Crew Supplies 533.5 lbs. / 242 kg
• Vehicle Hardware 438.7 lbs. / 199 kg
• Spacewalk Equipment 123.4 lbs. / 56 kg
• Computer Resources 59.4 lbs. / 27 kg
UNPRESSURIZED 2209.0 lbs. / 1002 kg
• Roll-Out Solar Array (ROSA) 716.5 lbs. / 325 kg
• Neutron Star Interior Composition Explorer (NICER) 820.1 lbs. / 372 kg
• Multiple User System for Earth Sensing (MUSES) 672.4 lbs. / 305 kg
Watch for Ken’s onsite CRS-11 mission reports direct from the Kennedy Space Center and Cape Canaveral Air Force Station, Florida.
Stay tuned here for Ken’s continuing Earth and Planetary science and human spaceflight news.
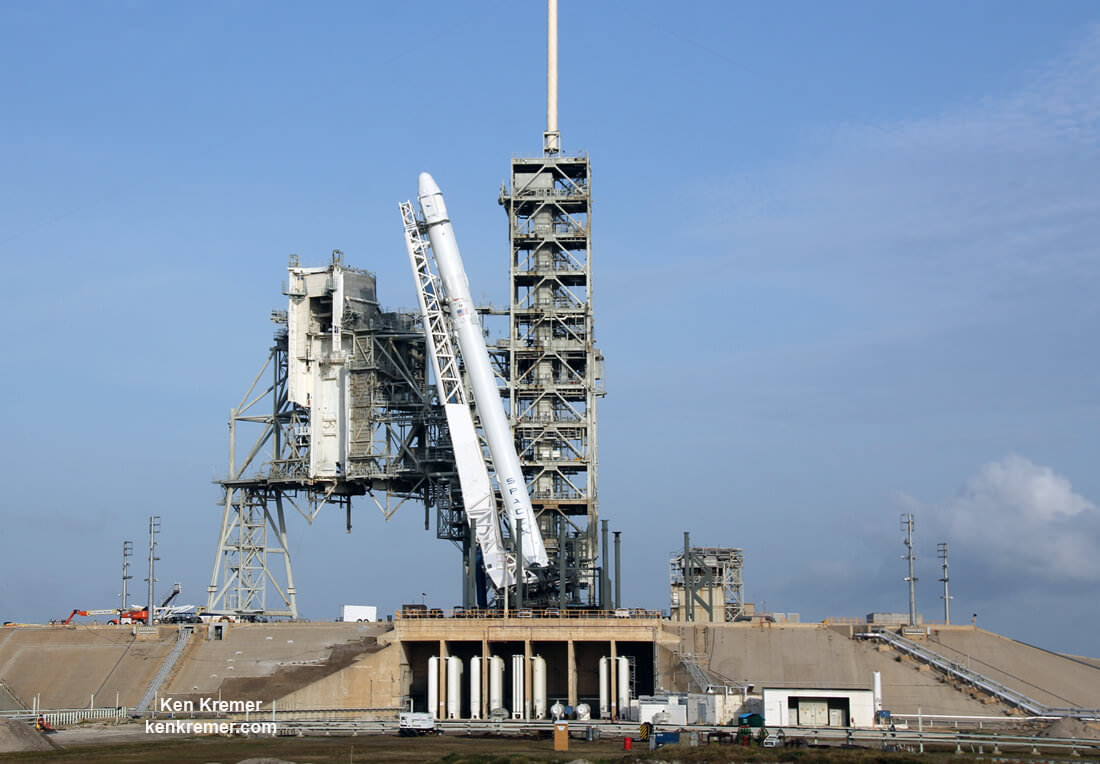
SpaceX Falcon 9 booster starts landing leg deployment moments before precision propulsive ground touchdown at Landing Zone 1 on Canaveral Air Force Station barely eight minutes after liftoff from pad 39A on 3 June 2017 from the Kennedy Space Center in Florida on the Dragon CRS-11 resupply mission to the International Space Station for NASA. Credit: Ken Kremer/Kenkremer.comLaunch of SpaceX Falcon 9 with reused Dragon CRS-11 cargo craft from Launch Complex 39A at NASA’s Kennedy Space Center in Florida at 5:07 p.m. on June 3, 2017 as seen from the Countdown clock at the KSC Press Site. Credit: Jean WrightUp close view of SpaceX Dragon CRS-11 resupply vessel atop Falcon 9 rocket and delivering 3 tons of science and supplies to the International Space Station (ISS) for NASA. Liftoff occurred 3 June 2017. Credit: Ken Kremer/Kenkremer.comSpaceX Falcon 9 rocket goes erect to launch position atop Launch Complex 39A at the Kennedy Space Center on 1 Jun 2017 as seen the morning before later afternoon launch from inside from the pad perimeter. Liftoff of the CRS-11 resupply mission to the International Space Station (ISS) occurred 3 June 2017. Credit: Ken Kremer/Kenkremer.com
Technicians at the DLR's Institute for Solar Research inspecting lamps in the Synlight. Image: DLR/Markus Hauschild.
Hydrogen is the most abundant element in the Universe. But here on Earth, it’s rather rare. That’s unfortunate, because in our warming world, its status as an emissions-free fuel makes it a coveted chemical. If German researchers are successful, their Synlight project will help make renewable hydrogen fuel a reality.
Dubbed the “artificial Sun”, the Synlight uses concentrated light to power Thermochemical Water Splitting (TWS.) Every school child knows you can produce hydrogen by electrolysis—running an electric current through water. But that takes an enormous amount of electricity. TWS might be a better way of getting hydrogen out of water, but it takes an enormous amount of energy too, and that’s what the German research is about.
When combusted with pure oxygen—inside a fuel cell for example—hydrogen’s only waste product is water. No greenhouse gases or particulates are produced. But if we want to use it to power our cars, buses, trucks, and even airplanes, we need enormous amounts of it. And we need to produce it cost-effectively.
“Renewable energies will be the mainstay of global power supply in the future.” – Karsten Lemmer DLR Executive Board Member
The idea is to use the heat generated by Concentrated Solar Power (CSP) to extract hydrogen from water, thereby eliminating the need for electricity. CSP systems use mirrors or lenses to concentrate a large area of sunlight into a small area. The heat from that action can be used to power TWS. The Synlight project in Germany is demonstrating the viability of TWS by mimicking the effect of concentrated sunlight. In doing so, researchers there are building what’s being called the world’s largest artificial Sun.
Each of Synlight’s 149 zenon short-arc lamps can be controlled individually. Image: DLR/Synlight/Markus Hauschild
German researchers at the German Aerospace Center (DLR) at Julich near Cologne built the Synlight, a system of 149, high power lamps of the type used in film projections. When all these lamps are turned on, Synlight produces light that is about 10,000 times more intense than natural sunlight on Earth. When all the lamps are aimed at a single spot, Synlight generates temperatures up to 3000 Celsius. The challenge now is to develop materials and processes that can operate in such an extreme temperature.
The 15m tall Synlight experiment is housed in this building in Julich. The building contains 3 separate radiation chambers for different experiments. Image: DLR CC By 3.0
The Synlight system itself uses an enormous amount of electrical power to operate. But that’s often the case with experimental facilities. The Synlight project will mimic the effect of intense, continuous solar energy, something that is not readily available in Germany. By building a test facility powered by electricity, researchers will be able to reliably perform experiments without being delayed or affected by cloudy weather.
“Fuels, propellants and combustibles acquired using solar power offer immense potential for long-term storage and the production of chemical raw materials, and the reduction of carbon dioxide emissions. Synlight will enhance our research in this field.” – Karsten Lemmer, DLR Executive Board Member
As Johannes Remmel, the North Rhine-Westphalia Minister for Climate Protection, said, “”We need to expand existing technology in practical ways in order to achieve renewable energy targets, but the energy transition will falter without investments in innovative research, in state-of-the-art technologies and in global lighthouse projects like Synlight.”
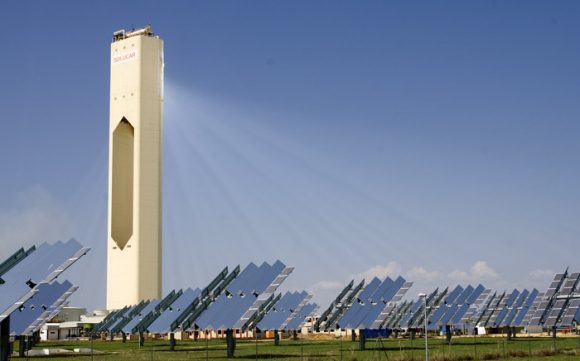
The DLR is involved in the PS10 solar power tower in Spain. The PS10 is the world’s fist commercial concentrating solar power tower. Image: By afloresm – SOLUCAR PS10, CC BY 2.0, https://commons.wikimedia.org/w/index.php?curid=2821733
This is not the German Aerospace Center’s first foray in concentrated solar power. They’re involved in a number of projects to advance concentrated solar power and thermal water splitting. The DLR is a partner in the Hydrosol II pilot in Spain. It’s a reactor for solar thermochemical hydrogen production that has been in operation since 2008. They’re also involved in the first commercially operated solar tower plant, an 11 megawatt system in Spain called the PS10 solar power tower.
Artist's impression of ice age Earth at glacial maximum. Credit: Wikipedia Commons/Ittiz
Scientists have known for some time that the Earth goes through cycles of climatic change. Owing to changes in Earth’s orbit, geological factors, and/or changes in Solar output, Earth occasionally experiences significant reductions in its surface and atmospheric temperatures. This results in long-term periods of glaciation, or what is more colloquially known as an “ice age”.
These periods are characterized by the growth and expansion of ice sheets across the Earth’s surface, which occurs every few million years. By definition we are still in the last great ice age – which began during the late Pliocene epoch (ca. 2.58 million years ago) – and are currently in an interglacial period, characterized by the retreat of glaciers.
Definition:
While the term “ice age” is sometime used liberally to refer to cold periods in Earth’s history, this tends to belie the complexity of glacial periods. The most accurate definition would be that ice ages are periods when ice sheets and glaciers expand across the planet, which correspond to significant drops in global temperatures and can last for millions of years.
The Antarctic ice sheet, which expanded during the last ice age. Credit: Wikipedia Commons/Stephen Hudson
During an ice age, there are significant temperature differences between the equator and the poles, and temperatures at deep-sea levels have also been shown to drop. This allows for large glaciers (comparable to continents) to expand, covering much of the surface area of the planet. Since the Pre-Cambrian Era (ca. 600 million years ago), ice ages have occurred at widely space intervals about about 200 million years.
History of Study:
The first scientist to theorize about past glacial periods was the 18th century Swiss engineer and geographer Pierre Martel. In 1742, while visiting an Alpine valley, he wrote about the dispersal of large rocks in erratic formations, which the locals attributed to the glaciers having once extended much further. Similar explanations began to emerge in the ensuing decades for similar patterns of boulder distribution in other parts of he world.
From the middle of the 18th century onward, European scholars increasingly began to contemplate ice as a means of transporting rocky material. This included the presence of boulders in coastal areas in the Baltic states and the Scandinavian peninsula. However, it was Danish-Norwegian geologist Jens Esmark (1762–1839) who first argued the existence of a sequence of world wide ice ages.
This theory was detailed in a paper he published in 1824, in which he proposed that changes in Earth’s climate (which were due to changes in its orbit) were responsible. This was followed in 1832 by German geologist and forestry professor Albrecht Reinhard Bernhardi speculating about how the polar ice caps may have once reached as far as the temperate zones of the world.
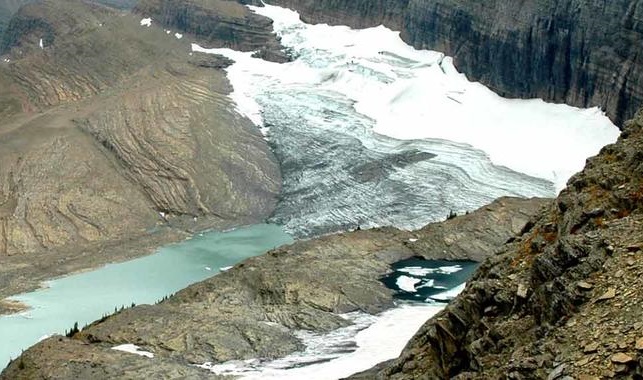
Overlook of the Grinnell Glacier in Glacier National Park, Montana. Credit: USGS
At this same time, German botanist Karl Friedrich Schimper and Swiss-American biologist Louis Agassiz began independently developing their own theory about global glaciation, which led toSchimper coining the term “ice age” in 1837. By the late 19th century, ice age theory gradually began to gain widespread acceptance over the notion that the Earth cooled gradually from its original, molten state.
By the 20th century, Serbian polymath Milutin Milankovic developed his concept of Milankovic cycles, which linked long-term climate changes to periodic changes in the Earth’s orbit around the Sun. This offered a demonstrable explanation for ice ages, and allowed scientists to make predictions about when significant changes in Earth’s climate might occur again.
Evidence for Ice Ages:
There are three forms of evidence for ice age theory, which range from the geological and the chemical to the paleontological (i.e. the fossil record). Each has its particular benefits and drawbacks, and has helped scientists to develop a general understanding of the effect ice ages have had on geological record for the past few billion years.
Geological: Geological evidence includes rock scouring and scratching, carved valleys, the formation of peculiar types of ridges, and the deposition of unconsolidated material (moraines) and large rocks in erratic formations. While this sort of evidence is what led to ice age theory in the first place, it remains temperamental.
For one, successive glaciation periods have different effects on a region, which tends to distort or erase geological evidence over time. In addition, geological evidence is difficult to date exactly, causing problems when it comes to getting an accurate assessment of how long glacial and interglacial periods have lasted.
Horseshoe-shaped lateral moraines at the margin of the Penny Ice Cap on Baffin Island, Nunavut, Canada. Lateral moraines are accumulations of debris along the sides of a glacier formed by material falling from the valley wall. Credit: NASA/Michael Studinger
Chemical: This consists largely of variations in the ratios of isotopes in fossils discovered in sediment and rock samples. For more recent glacial periods, ice cores are used to construct a global temperature record, largely from the presence of heavier isotopes (which lead to higher evaporation temperatures). They often contain bubbles of air as well, which are examined to assess the composition of the atmosphere at the time.
Limitations arise from various factors, however. Foremost among these are isotope ratios, which can have a confounding effect on accurate dating. But as far as the most recent glacial and interglacial periods are concerned (i.e. during the past few million years), ice core and ocean sediment core samples remain the most trusted form of evidence.
Paleontological: This evidence consists of changes in the geographical distribution of fossils. Basically, organisms that thrive in warmer conditions become extinct during glacial periods (or become highly restricted in lower latitudes), while cold-adapted organisms thrive in these same latitudes. Ergo, reduced amounts of fossils in higher latitudes is an indication of the spread of glacial ice sheets.
This evidence can also be difficult to interpret because it requires that the fossils be relevant to the geological period under study. It also requires that sediments over wide ranges of latitudes and long periods of time show a distinct correlation (due to changes in the Earth’s crust over time). In addition, there are many ancient organisms that have shown the ability to survive changes in conditions for millions of years.
As a result, scientists rely on a combined approach and multiple lines of evidence wherever possible.
Ice ages are characterized by a drop in average global temperatures, resulting in the expansion of ice sheets globally. Credit: NASA
Causes of Ice Ages:
The scientific consensus is that several factors contribute to the onset of ice ages. These include changes in Earth’s orbit around the Sun, the motion of tectonic plates, variations in Solar output, changes in atmospheric composition, volcanic activity, and even the impact of large meteorites. Many of these are interrelated, and the exact role that each play is subject to debate.
Earth’s Orbit: Essentially, Earth’s orbit around the Sun is subject to cyclic variations over time, a phenomenon also known as Milankovic (or Milankovitch) cycles. These are characterized by changing distances from the Sun, the precession of the Earth’s axis, and the changing tilt of the Earth’s axis – all of which result in a redistribution of the sunlight received by the Earth.
The most compelling evidence for Milankovic orbital forcing corresponds closely to the most recent (and studied) period in Earth’s history (circa. during the last 400,000 years). During this period, the timing of glacial and interglacial periods are so close to changes in Milankovic orbital forcing periods that it is the most widely accepted explanation for the last ice age.
Tectonic Plates: The geological record shows an apparent correlation between the onset of ice ages and the positions of the Earth’s continents. During these periods, they were in positions which disrupted or blocked the flow of warm water to the poles, thus allowing ice sheets to form.
The Earth’s Tectonic Plates. Credit: msnucleus.org
This in turn increased the Earth’s albedo, which reduces the amount of solar energy absorbed by the Earth’s atmosphere and crust. This resulted in a positive feedback loop, where the advance of ice sheets further increased the Earth’s albedo and allowed for more cooling and more glaciation. This would continue until the onset of a greenhouse effect ended the period of glaciation.
Based on past ice-ages, three configurations have been identified that could lead to an ice age – a continent sitting atop the Earth’s pole (as Antarctica does today); a polar sea being land-locked (as the Arctic Ocean is today); and a super continent covering most of the equator (as Rodinia did during the Cryogenian period).
In addition, some scientists believe that the Himalayan mountain chain – which formed 70 million years ago – has played a major role in the most recent ice age. By increasing the Earth’s total rainfall, it has also increased the rate at which CO² has been removed from the atmosphere (thereby decreasing the greenhouse effect). Its existence has also paralleled the long-term decrease in Earth’s average temperature over the past 40 million years.
Atmospheric Composition: There is evidence that levels of greenhouse gases fall with the advance of ice sheets and rise with their retreat. According to the “Snowball Earth” hypothesis – in which ice completely or very nearly covered the planet at least once in the past – the ice age of the late Proterozoic was ended by an increase in CO² levels in the atmosphere, which was attributed to volcanic eruptions.
Image of the Harding Ice Field on Alaska’s Kenai Peninsula. Credit: US Fish and Wildlife Service
However, there are those who suggest that increased levels of carbon dioxide may have served as a feedback mechanism, rather than the cause. For example, in 2009, an international team of scientists produced a study – titled “The Last Glacial Maximum” – that indicated that an increase in solar irradiance (i.e. energy absorbed from the Sun) provided the initial change, whereas greenhouse gases accounted for the magnitude of change.
Major Ice Ages:
Scientists have determined that at least five major ice ages took place in Earth’s history. These include the Huronian, Cryogenian, Andean-Saharan, Karoo, and the Qauternary ice ages. The Huronian Ice Age is dated to the early Protzerozoic Eon, roughly 2.4 to 2.1 billion years ago, based on geological evidence observed to the north and north-east of Lake Huron (and correlated to deposits found in Michigan and Western Australia).
The Cryogenian Ice Age lasted from roughly 850 to 630 million years ago, and was perhaps the most severe in Earth’s history. It is believed that during this period, the glacial ice sheets reached the equator, thus leading to a “Snowball Earth” scenario. It is also believed that ended due to a sudden increase in volcanic activity that triggered a greenhouse effect, though (as noted) this is subject to debate.
The Andean-Saharan Ice Age occurred during the Late Ordovician and the Silurian period (roughly 460 to 420 million years ago). As the name suggests, the evidence here is based on geological samples take from the Tassili n’Ajjer mountain range in the western Sahara, and correlated by evidence obtained from the Andean mountain chain in South America (as well as the Arabian peninsula and the south Amazon basin).
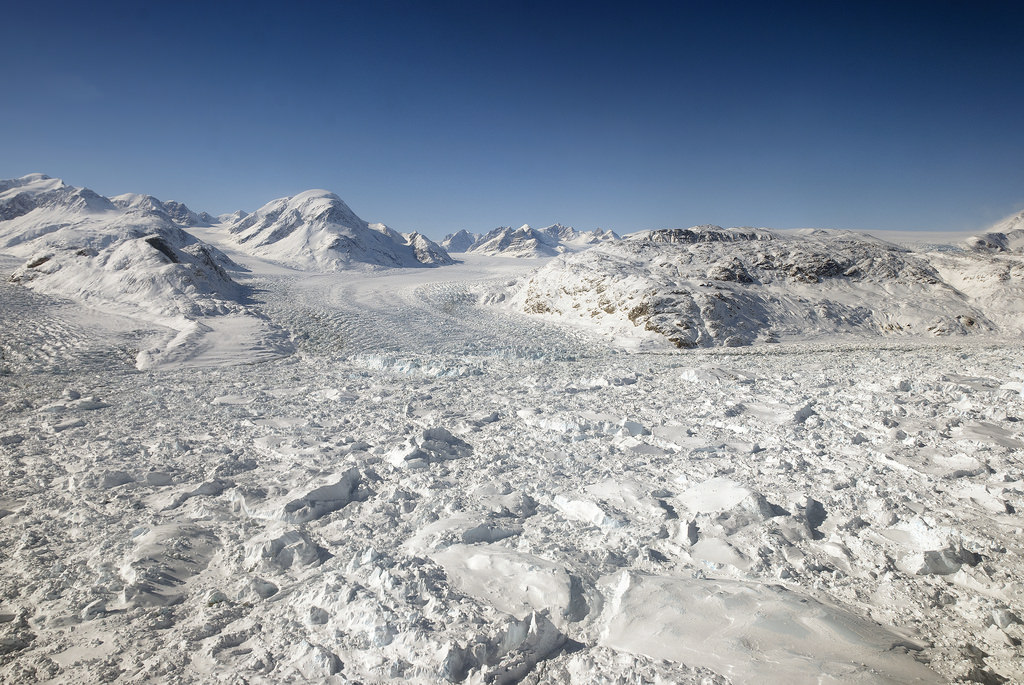
Floating ice at the calving front of Greenland’s Kangerdlugssuaq glacier, photographed in 2011 during Operation IceBridge. Credit: NASA/Michael Studinger
The Karoo Ice Age is attributed to the evolution of land plants during the onset of the Devonian period (ca. 360 to 260 million years ago) which caused a long-term increase in planetary oxygen levels and a reduction in CO² levels – leading to global cooling. It is named after sedimentary deposits that were discovered in the Karoo region of South Africa, with correlating evidence found in Argentina.
The current ice age, known as the Pliocene-Quaternary glaciation, started about 2.58 million years ago during the late Pliocene, when the spread of ice sheets in the Northern Hemisphere began. Since then, the world has experienced several glacial and interglacial periods, where ice sheets advance and retreat on time scales of 40,000 to 100,000 years.
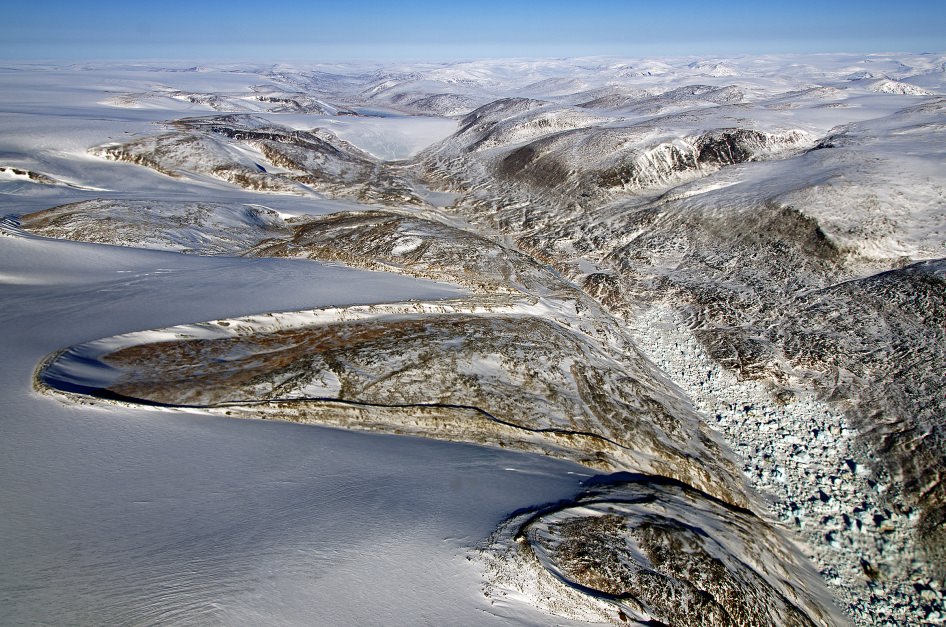
The Earth is currently in an interglacial period, and the last glacial period ended about 10,000 years ago. What remains of the continental ice sheets that once stretched across the globe are now restricted to Greenland and Antarctic, as well as smaller glaciers – like the one that covers Baffin Island.
Anthropogenic Climate Change:
The exact role played by all the mechanisms that ice ages are attributed to – i.e. orbital forcing, solar forcing, geological and volcanic activity – are not yet entirely understood. However, given the role of carbon dioxide and other greenhouse gas emissions, there has been a great deal of concern in recent decades what long-term effects human activity will have on the planet.
For instance, in at least two major ice ages, the Cryogenian and Karoo Ice Ages, increases and decreases in atmospheric greenhouse gases are believed to have played a major role. In all other cases, where orbital forcing is believed to be the primary cause of an ice age ending, increased greenhouse gas emissions were still responsible for the negative feedback that led to even greater increases in temperature.
The addition of CO2 by human activity has also played a direct role in climatic changes taking place around the world. Currently, the burning of fossil fuels by humans constitutes the largest source of emissions of carbon dioxide (about 90%) worldwide, which is one of the main greenhouse gases that allows radiative forcing (aka. the Greenhouse Effect) to take place.
In 2013, the National Oceanic and Atmospheric Administration announced that CO² levels in the upper atmosphere reached 400 parts per million (ppm) for the first time since measurements began in the 19th century. Based on the current rate at which emissions are growing, NASA estimates that carbon levels could reach between 550 to 800 ppm in the coming century.
If the former scenario is the case, NASA anticipates a rise of 2.5 °C (4.5 °F) in average global temperatures, which would be sustainable. However, should the latter scenario prove to be the case, global temperatures will rise by an average of 4.5 °C (8 °F), which would make life untenable for many parts of the planet. For this reason, alternatives are being sought out for development and widespread commercial adoption.
What’s more, according to a 2012 research study published in Nature Geoscience – titled “Determining the natural length of the current interglacial” – human emissions of CO² are also expected to defer the next ice age. Using data on Earth’s orbit to calculate the length of interglacial periods, the research team concluded that the next ice (expected in 1500 years) would require atmospheric CO² levels to remain beneath around 240?ppm.
Learning more about the longer ice ages as well the shorter glacial periods that have taken place in Earth’s past is important step towards understanding how Earth’s climate changes over time. This is especially important as scientists seek to determine how much of modern climate change is man-made, and what possible counter-measures can be developed.
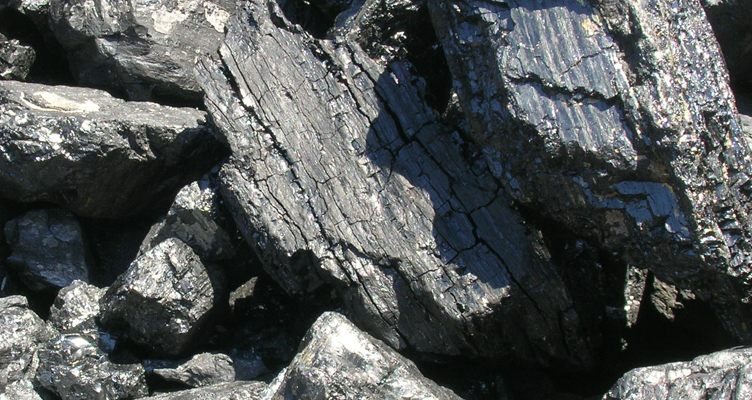
Fossil fuels, like coal, still account for the majority of energy production worldwide. Credit: energy.gov
The term “fossil fuels” is thrown about quite a lot these days. More often than not, it comes up in the context of environmental issues, Climate Change, or the so-called “energy crisis”. In addition to be a major source of pollution, humanity’s dependence on fossil fuels has led to a fair bit of anxiety in recent decades, and fueled demands for alternatives.
But just what are fossil fuels? While most people tend to think of gasoline and oil when they hear these words, it actually applies to many different kinds of energy sources that are derived from decomposed organic material. How humanity came to be so dependent on them, and what can we look to in order to replace them, are some of the biggest concerns facing us today.
Definition:
Fossil fuels refers to energy sources that are formed as a result of the anaerobic decomposition of living matter that contains energy as a result of ancient photosynthesis. Typically, these organisms have been dead for millions of years, with some dating back as far as the Cryogenian Period (ca. 650 million years ago).
The Bryan Mound Strategic Petroleum Reserve, located in Brazoria Country, Texas. Credit: energy.gov
Fossil fuels contain high percentages of carbon and stored energy in their chemical bonds. They can take the form of petroleum, coal, natural gas, and other combustible, hydrocarbon compounds. Whereas petroleum and natural gas are formed by the decomposition of organisms, coal and methane are the results of the decomposition of terrestrial plants.
In the case of the former, it is believed that large quantities of phytoplankton and zooplankton settled on the bottoms of seas or lakes millions of years ago. Over the course of many millions of years, this organic matter mixed with mud and was buried under heavy layers of sediment. The resulting heat and pressure caused the organic matter to become chemically altered, eventually forming carbon compounds.
In the case of the latter, the source was dead plant matter that was covered in sediment during the Carboniferous period – i.e. the end of Devonian Period to the beginning of the Permian Period (ca. 300 and 350 million years ago). Over time, these deposits either solidified or became gaseous, creating coal fields, methane and natural gases.
Modern Uses:
Coal has been used since ancient times as a fuel, often in furnaces to melt metal ores. Unprocessed and unrefined oil has also been burned for centuries in lamps for the sake of lighting, and semi-solid hydrocarbons (like tar) were used for waterproofing (largely on the bottoms of boats and on docks) and for embalming.
Widespread use of fossil fuels as sources of energy began during the Industrial Revolution (18th – 19th century), where coal and oil began replacing animal sources (i.e. whale oil) to power steam engines. By the time of the Second Industrial Revolution (ca. 1870 – 1914), oil and coal began to be used to power electrical generators.
The invention of the internal combustion engine (i.e. automobiles) increased demands for oil exponentially, as did the development of aircraft. The petrochemical industry emerged concurrently, with petroleum being used to manufacture products ranging from plastics to feedstock. In addition, tar (a leftover product from petroleum extraction) became widely used in the construction of roads and highways.
Fossil fuels became central to modern manufacturing, industry and transportation because of how they produce significant amounts of energy per unit mass. As of 2015, according to the International Energy Agency (IEA) the world’s energy needs are still predominantly provided for by sources like coal (41.3%) and natural gas (21.7%), though oil has dropped to just 4.4%.
The fossil fuel industry also accounts for a major share of the global economy. In 2014, global coal consumption exceeded 3.8 billion metric tons, and accounted for US $46 billion in revenue in the US alone. In 2012, global oil and gas production reached over 75 million barrels per day, while the global revenue generated by the industry reached about US $1.247 trillion.
Countries of the world ranked in terms of their annual production of oil. Credit: Wikipedia Commons/Ali Zifan
The fossil fuel industry also enjoys a great deal of government protection and incentives worldwide. A 2014 report from the IEA indicated that the fossil fuel industry collects $550 billion a year in global government subsidies. However, a 2015 study by the International Monetary Fund (IMF) indicated that the real cost of these subsidies to governments worldwide is around US $5.3 trillion (or 6.5 % of global GDP).
Environmental Effects:
The connection between fossil fuels and air pollution in industrialized nations and major cities has been evident since the Industrial Revolution. Pollutants generated by the burning of coal and oil include carbon dioxide, carbon monoxide, nitrogen oxides, sulfur dioxide, volatile organic compounds and heavy metals, all of which have been linked to respiratory illnesses and increased risks of disease.
The burning of fossil fuels by humans is also the largest source of emissions of carbon dioxide (about 90%) worldwide, which is one of the main greenhouse gases that allows radiative forcing (aka. the Greenhouse Effect) to take place, and contributes to global warming.
In 2013, the National Oceanic and Atmospheric Administration announced that CO² levels in the upper atmosphere reached 400 parts per million (ppm) for the first time since measurements began in the 19th century. Based on the current rate at which emissions are growing, NASA estimates that carbon levels could reach between 550 to 800 ppm in the coming century.
If the former scenario is the case, NASA anticipates a rise of 2.5 °C (4.5 °F) in average global temperatures, which would be sustainable. However, should the latter scenario prove to be the case, global temperatures will rise by an average of 4.5 °C (8 °F), which would make life untenable for many parts of the planet. For this reason, alternatives are being sought out for development and widespread commercial adoption.
Alternatives:
Due to the long-term effects of fossil fuel-use, scientists and researchers have been developing alternatives for over a century. These include concepts like hydroelectric power – which has existed since the late 19th century – where falling water is used to spin turbines and generate electricity.
Since the latter half of the 20th century, nuclear power has also been looked to as an alternative to coal and petroleum. Here, slow-fission reactors (which rely on uranium or the radioactive decay of other heavy elements) are used to heat water, which in turn generates steam to spin turbines.
Since the mid-2oth century, several more methods have been proposed that range from the simple to the highly sophisticated. These include wind power, where changes in airflow pushes turbines; solar power, where photovoltaic cells convert the Sun’s energy (and sometimes heat) into electricity; geothermal power, which relies on steam tapped from the Earth’s crust to rotate turbines; and tidal power, where changes in the tides push turbines.
The spherical tokamak MAST at the Culham Centre for Fusion Energy (UK). Photo: CCFE
Alternative fuels are also being derived from biological sources, where plant and biological sources are used to replace gasoline. Hydrogen is also being developed as a power source, ranging from hydrogen fuel cells to water being used to powering internal combustion and electric engines. Fusion power is also being developed, where atoms of hydrogen are fused inside reactors to generate clean, abundant energy.
By the middle of the 21st century, fossil fuels are expected to have become obsolete, or at least declined significantly in terms of their use. But from a historical standpoint, they have been associated with the largest and most prolonged explosions in human growth. Whether humanity will survive the long-term effects of this growth – which has included an intense amount of fossil fuel burning and greenhouse gas emissions – remains to be seen.
Artist's concept of a space-based solar array. Credit NASA/SAIC
In recent years, alternative energy has been the subject of intense interest and debate. Thanks to the threat of Climate Change, and the fact that average global temperatures continue to rise year after year, the drive to find forms of energy that will reduce humanity’s reliance on fossil fuels, coal, and other polluting methods has naturally intensified.
While most concepts for alternative energy are not new, it has only been in the past few decades that the issue has become pressing. And thanks to improvements in technology and production, the costs of most forms of alternative energy has been dropping while efficiency has been increasing. But just what is alternative energy, and what is the likelihood of it becoming mainstream?
Definition:
Naturally, there is some debate as to what “alternative energy” means and what it can be applied to. On the one hand, the term can refer to forms of energy that do not increase humanity’s carbon footprint. In this respect, it can include things as nuclear facilities, hydroelectric power, and even things like natural gas and “clean coal”.
Residential solar panels in Germany. Credit: Wikimedia Commons/ Sideka Solartechnik
On the other hand, the term is also used to refer to what are currently considered to be non-traditional methods of energy – such as solar, wind, geothermal, biomass, and other recent additions. This sort of classification rules out methods like hydroelectric, which have been around for over a century and are therefore quite common to certain regions of the world.
Another factor is that alternative energy sources are considered to be “clean”, meaning that they don’t produce harmful pollutants. As already noted, this can refer to carbon dioxide but also other emissions like carbon monoxide, sulfur dioxide, nitrogen oxide, and others. Within these parameters, nuclear energy is not considered an alternative energy source because it produces radioactive waste that is highly toxic and must be stored.
In all cases, however, the term is used to refer to forms of energy that will come to replace fossil fuels and coal as the predominant form of energy production in the coming decades.
Types of Alternative Energy:
Strictly speaking, there are many types of alternative energy. Once again, definitions become a bit of a sticking point, and the term has been used in the past to refer to any method that was considered non-mainstream at the time. But applying the term broadly to mean alternatives to coal and fossil fuels, it can include any or all of the following:
Hydroelectricity: This refers to energy generated by hydroelectric dams, where falling water (i.e. rivers or canals) are channeled through an apparatus to spin turbines and generate electricity.
A nuclear power plant, releasing hot steam as a byproduct of its slow fission process. Credit: Wikipedia Commons/Emmelie Callewaert
Nuclear Power: Energy that is produced through slow-fission reactions. Rods of uranium or other radioactive elements heat water to generate steam, which in turn spins turbines to generate electricity.
Solar Power: Energy harnessed directly from the Sun, where photovoltaic cells (usually composed of silicon substrate, and arranged in large arrays) convert the Sun’s rays directly into electrical energy. In some cases, the heat produced by sunshine is harnessed to produce electricity as well, which is known as solar-thermal power.
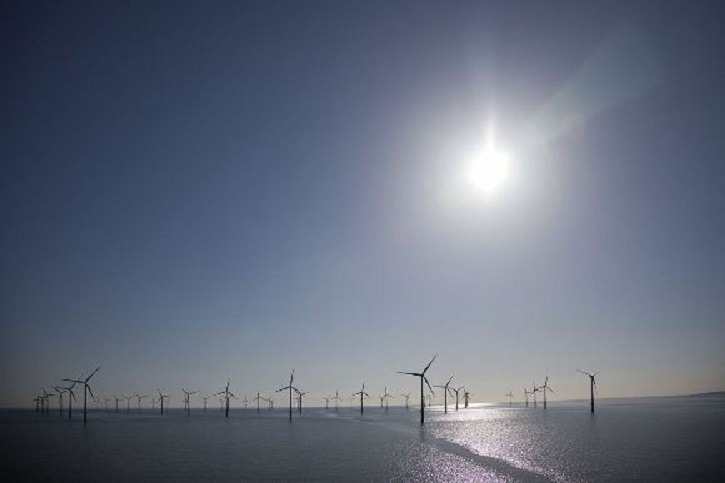
Wind Power: Energy generated by air flow, where large wind-turbines are spun by wind to generate electricity.
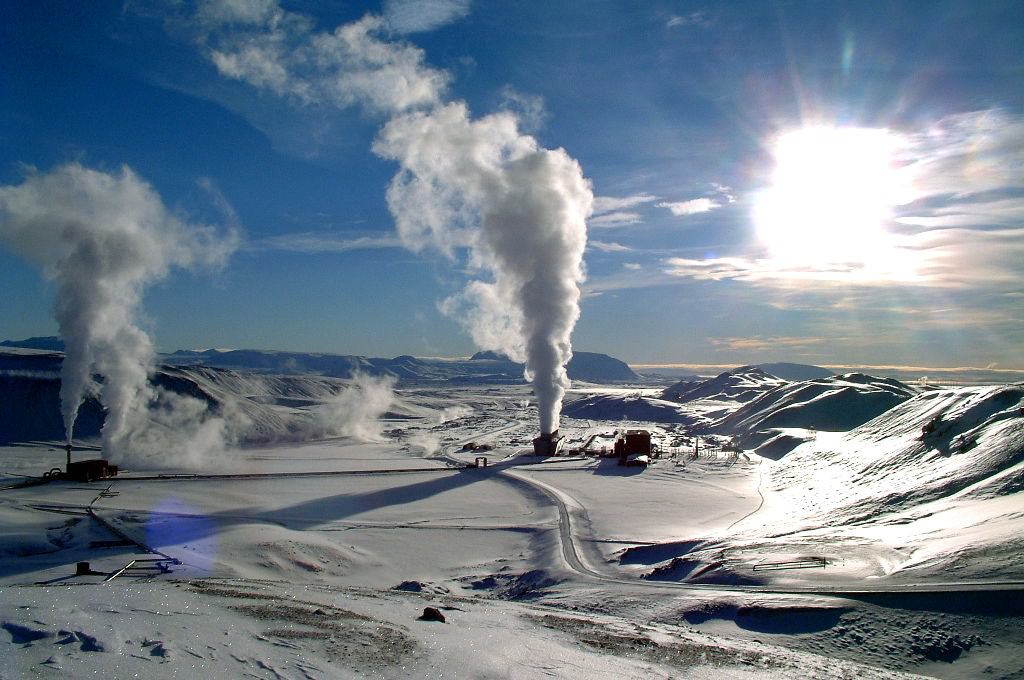
Geothermal Power: Energy generated by heat and steam produced by geological activity in the Earth’s crust. In most cases, this consists of pipes being placed in the ground above geologically active zones to channel steam through turbines, thus generating electricity.
Tidal Power: Energy generated by tidal harnesses located around shorelines. Here, the daily changes in tides causes water to flow back and forth through turbines, generating electricity that is then transferred to power stations along the shore.
Biomass: This refers to fuels that are derived from plants and biological sources – i.e. ethanol, glucose, algae, fungi, bacteria – that could replace gasoline as a fuel source.
Hydrogen: Energy derived from processes involving hydrogen gas. This can include catalytic converters, where water molecules are broken apart and reunited by electrolysis; hydrogen fuel cells, where the gas is used to power internal combustion engines or heated and used to spin turbines; or nuclear fusion, where atoms of hydrogen fuse under controlled conditions to release incredible amounts of energy.
The Mega Ampere Spherical Tokamak (MAST) reactor at the Culham Centre for Fusion Energy (UK). Credit: CCFE
Alternative and Renewable Energy:
In many cases, alternative sources of energy are also renewable. However, the terms are not entirely interchangeable, owing to the fact that many forms of alternative energy rely on a finite resource. For instance, nuclear power relies on uranium or other heavy elements that must be mined.
Meanwhile, wind, solar, tidal, geothermal and hydroelectric power all rely on sources that are entirely renewable. The Sun’s rays are the most abundant energy source of all and, while limited by weather and diurnal patters, are perennial – and therefore inexhaustible from an industry standpoint. Wind is also a constant, thanks to the Earth’s rotation and pressure changes in our atmosphere.
Development:
Currently, alternative energy is still very much in its infancy. However, this picture is rapidly changing, owing to a combination of political pressure, worldwide ecological disasters (drought, famine, flooding, storm activity), and improvements in renewable energy technology.
For instance, as of 2015, the world’s energy needs were still predominantly provided for by sources like coal (41.3%) and natural gas (21.7%). Hydroelectric and nuclear power constituted 16.3% and 10.6%, respectively, while “renewables” (i.e. solar, wind, biomass etc.) made up just 5.7%.
In Denmark, wind power accounts for 28% of electrical production and is cheaper than coal power. Credit: denmark.dk
This represented a significant change from 2013, when the global consumption of oil, coal and natural gas was 31.1%, 28.9%, and 21.4%, respectively. Nuclear and hydroelectric power made up 4.8% and 2.45, while renewable sources made up just 1.2%.
In addition, there has been an increase in the number of international agreements regarding the curbing of fossil fuel use and the development of alternative energy sources. These include the Renewable Energy Directive signed by the European Union in 2009, which established goals for renewable energy usage for all member states for the year of 2020.
Basically, the agreement stated that the EU fulfill at least 20% of its total energy needs with renewables by 2020, and that at least 10% of their transport fuels come from renewable sources by 2020. In November of 2016, the European Commission revised these targets, establishing that a minimum of 27% of the EUs energy needs come from renewables by 2030.
In 2015, the United Nations Framework Convention on Climate Change (UNFCCC) met in Paris to come up with a framework for greenhouse gas mitigation and the financing of alternative energy that would go into effect by 2020. This led to The Paris Agreement, which was adopted on December 12th, 2015 and opened for signatures on April 22nd (Earth Day), 2016, at the UN Headquarters in New York.
The Krafla a geothermal power station located i0n Iceland. Credit: Wikipedia Commons/Ásgeir Eggertsson
Several countries and states have also been noted fore their leadership in the field of alternative energy development. For instance, in Denmark, wind power provides up to 140% of the country’s demand for electricity, with the surplus being provided to neighboring countries like Germany and Sweden.
Iceland, thanks to its location in the North Atlantic and its active volcanoes, achieved 100% reliance on renewable energy by 2012 through a combination of hydroelectricity and geothermal power. In 2016, Germany’s policy of phasing out reliance on oil and nuclear power resulted in the country reaching a milestone on May 15th, 2016 – where nearly 100% of its demand for electricity came from renewable sources.
The state of California has also made impressive strides in terms of its reliance on renewable energy in recent years. In 2009, 11.6 percent of all electricity in the state came from renewable resources such as wind, solar, geothermal, biomass and small hydroelectric facilities. Thanks to multiple programs that encourage switching to renewable energy sources, this reliance increased to 25% by 2015.
Based on the current rates of adoption, the long-term prospects for alternative energy are extremely positive. According to a 2014 report by the International Energy Agency (IEA), photovoltaic solar power and solar thermal power will account for 27% of global demand by 2050 – making it the single largest source of energy. Similarly, a 2013 report on wind power indicated that by 2050, wind could account for up to 18% of global demand.
The IEA’s World Energy Outlook 2016 also claims that by 2040, natural gas, wind and solar will eclipse coal and oil as the predominant sources of energy. And some even go as far to say that – thanks to developments in solar, wind, and fusion power technology – fossil fuels will become obsolete by 2050.
As with all things, the adoption of alternative energy has been gradual. But thank to the growing problem of Climate Change and rising demand for electricity worldwide, the rate at which clean and alternative methods are being adopted has become exponential in recent years. Sometime during this century, humanity may reach the point of becoming carbon neutral, and not a moment too soon!
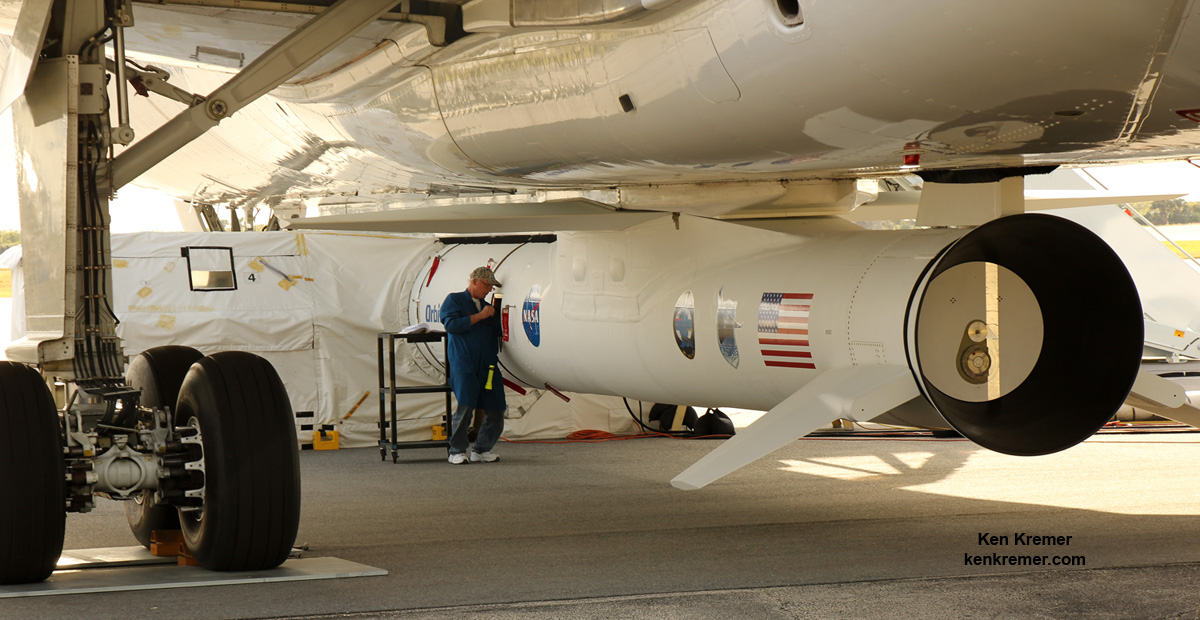
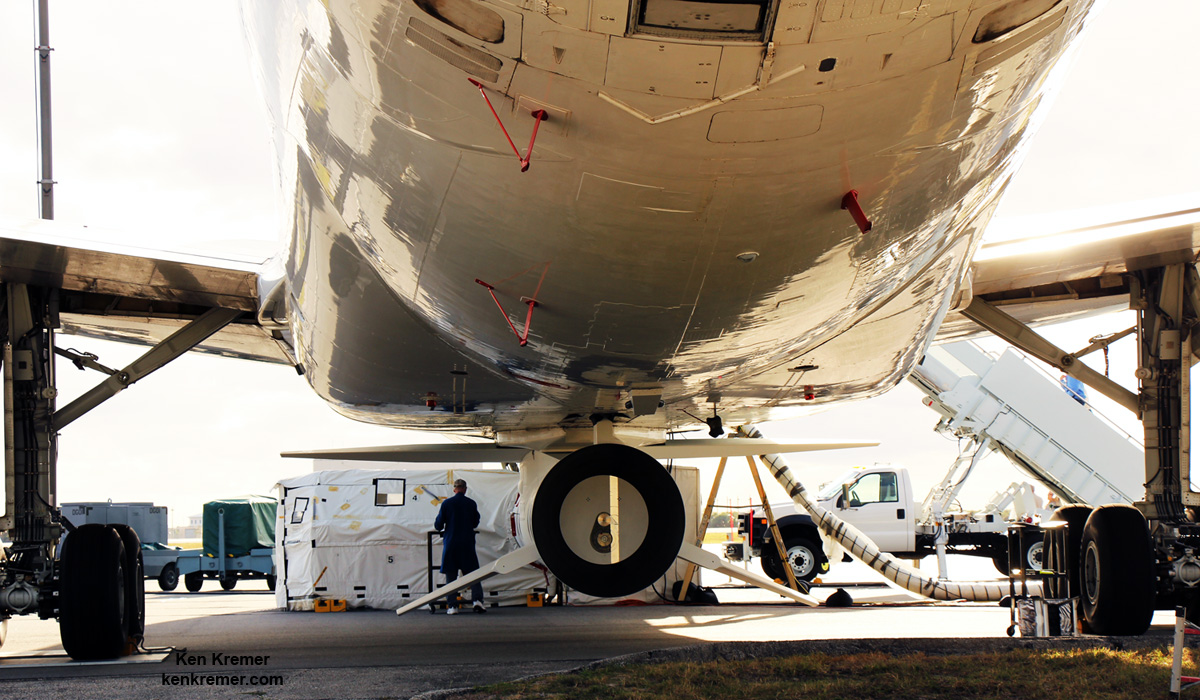
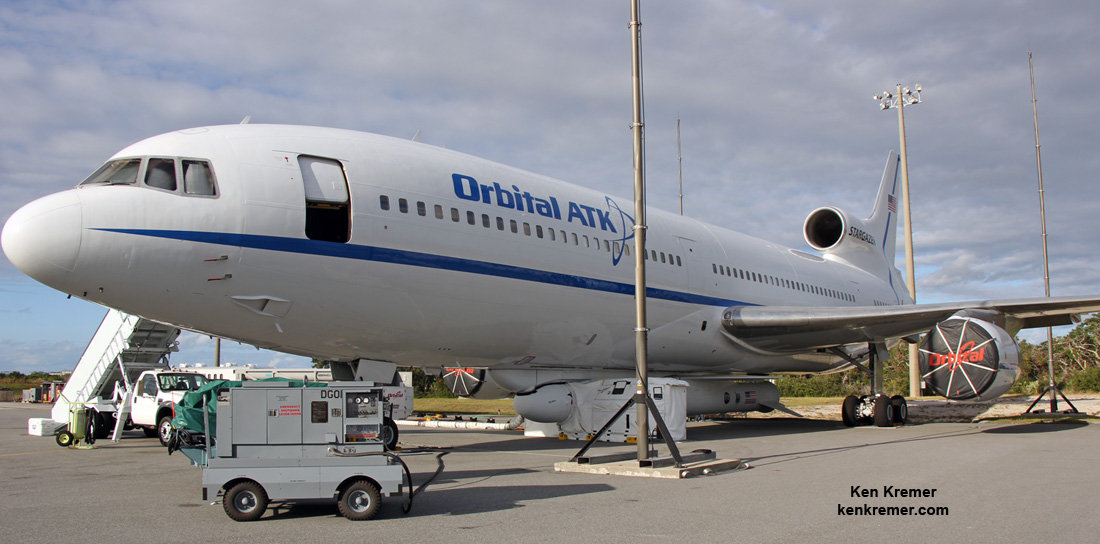
An Orbital ATK L-1011 “Stargazer” aircraft carrying a Pegasus XL rocket with NASA’s CYGNSS spacecraft takes off from the Skid Strip at Cape Canaveral Air Force Station, Florida on Dec. 12, 2016. Credit: Ken Kremer/kenkremer.com
An Orbital ATK L-1011 “Stargazer” aircraft carrying a Pegasus XL rocket with NASA’s CYGNSS spacecraft takes off from the Skid Strip at Cape Canaveral Air Force Station, Florida on Dec. 12, 2016. Credit: Ken Kremer/kenkremer.com
KENNEDY SPACE CENTER, FL – Monday’s (Dec. 12) planned launch of NASA’s innovative Cyclone Global Navigation Satellite System (CYGNSS) hurricane microsatellite fleet was aborted when a pump in the hydraulic system that releases the Pegasus air-launch booster from its L-1011 carrier aircraft failed in flight. UPDATE: launch delayed to Dec 15, story revised
NASA and Orbital ATK confirmed this afternoon that the launch of the Orbital ATK commercial Pegasus-XL rocket carrying the CYGNSS small satellite constellation has been rescheduled again to Thursday, Dec. 15 at 8:26 a.m. EST from a drop point over the Atlantic Ocean.
Late last night the launch was postponed another day from Dec. 14 to Dec. 15 to solve a flight parameter issue on the CYGNSS spacecraft. New software was uploaded to the spacecraft that corrected the issue, NASA officials said.
“NASA’s launch of CYGNSS spacecraft is targeted for Thursday, Dec. 15,” NASA announced.
“We are go for launch of our #Pegasus rocket carrying #CYGNSS tomorrow, December 15 from Cape Canaveral Air Force Station,” Orbital ATK announced.
An Orbital ATK L-1011 “Stargazer” aircraft carrying a Pegasus XL rocket with NASA’s CYGNSS spacecraft takes off from the Skid Strip at Cape Canaveral Air Force Station, Florida on Dec. 12. Credit: Ken Kremer/kenkremer.com
“The CYGNSS constellation consists of eight microsatellite observatories that will measure surface winds in and near a hurricane’s inner core, including regions beneath the eyewall and intense inner rainbands that previously could not be measured from space,” according to a NASA factsheet.
Despite valiant efforts by the flight crew to restore the hydraulic pump release system to operation as the L-1011 flew aloft near the Pegasus drop zone, they were unsuccessful before the launch window ended and the mission had to be scrubbed for the day by NASA Launch Director Tim Dunn.
The Pegasus/CYGNSS vehicle is attached to the bottom of the Orbital ATK L-1011 Stargazer carrier aircraft.
Orbital ATK L-1011 “Stargazer” aircraft carrying a Pegasus XL rocket with NASA’s CYGNSS spacecraft takes off from the Skid Strip at Cape Canaveral Air Force Station, Florida on Dec. 12, 2016. Credit: Ken Kremer/kenkremer.com
The hydraulic release system passed its pre-flight checks before takeoff of the Stargazer.
“Launch of the Pegasus rocket was aborted due to an issue with the launch vehicle release on the L-1011 Stargazer. The hydraulic release system operates the mechanism that releases the Pegasus rocket from the carrier aircraft. The hydraulic system functioned properly during the pre-flight checks of the airplane,” said NASA.
A replacement hydraulic pump system component was flown in from Mojave, California, and successfully installed and checked out. Required crew rest requirements were also met.
Technician works on Orbital ATK Pegasus XL rocket with NASA’s CYGNSS payload on board on Dec. 10, 2016 in this rear side view showing the first stage engine. They are mated to the bottom of the Orbital ATK L-1011 Stargazer aircraft at the Skid Strip at Cape Canaveral Air Force Station in Florida. Launch is slated for Dec. 12, 2016. Credit: Ken Kremer/kenkremer.com
The one-hour launch window opens at 8:20 a.m and the actual deployment of the rocket from the L-1011 Tristar is timed to occur 5 minutes into the window at 8:26 a.m.
NASA’s Pegasus/CYGNUS launch coverage and commentary will be carried live on NASA TV – beginning at 7 a.m. EDT
Orbital ATK is also providing launch and mission update at:
twitter.com/OrbitalATK
The weather forecast from the Air Force’s 45th Weather Squadron at Cape Canaveral has significantly increased to predicting a 90% chance of favorable conditions on Thursday, Dec. 15.
The primary weather concerns are for flight cumulus clouds.
The Pegasus rocket cannot fly through rain or clouds due to a negative impact and possible damage on the rocket’s thermal protection system (TPS).
In the event of a delay, the range is also reserved for Friday, Dec. 16 where the daily outlook remains at a 90% chance of favorable weather conditions.
Rear view into the first stage engine of Orbital ATK Pegasus XL rocket that will launch NASA’s CYGNSS experimental hurricane observation payload on Dec. 14, 2016. They are mated to the bottom of the Orbital ATK L-1011 Stargazer aircraft at the Skid Strip at Cape Canaveral Air Force Station in Florida. Credit: Ken Kremer/kenkremer.com
After Stargazer takes off from the Skid Strip early Thursday around 6:30 a.m. EST, it will fly north to a designated drop point box about 126 miles east of Daytona Beach, Florida over the Atlantic Ocean. The crew can search for a favorable launch point if needed, just as they did Monday morning.
The drop box point measures about 40-miles by 10-miles (64-kilometers by 16-kilometers). The flight crew flew through the drop box twice on Monday, about a half an hour apart, as they tried to repair the hydraulic system by repeatedly cycling it on and off and sending commands.
“It was not meeting the prescribed launch release pressures, indicating a problem with the hydraulic pump,” said NASA CYGNSS launch director Tim Dunn.
“Fortunately, we had a little bit of launch window to work with, so we did a lot of valiant troubleshooting in the air. As you can imagine, everyone wanted to preserve every opportunity to have another launch attempt today, so we did circle around the race once, resetting breakers on-board the aircraft, doing what we could in flight to try to get that system back into function again.”
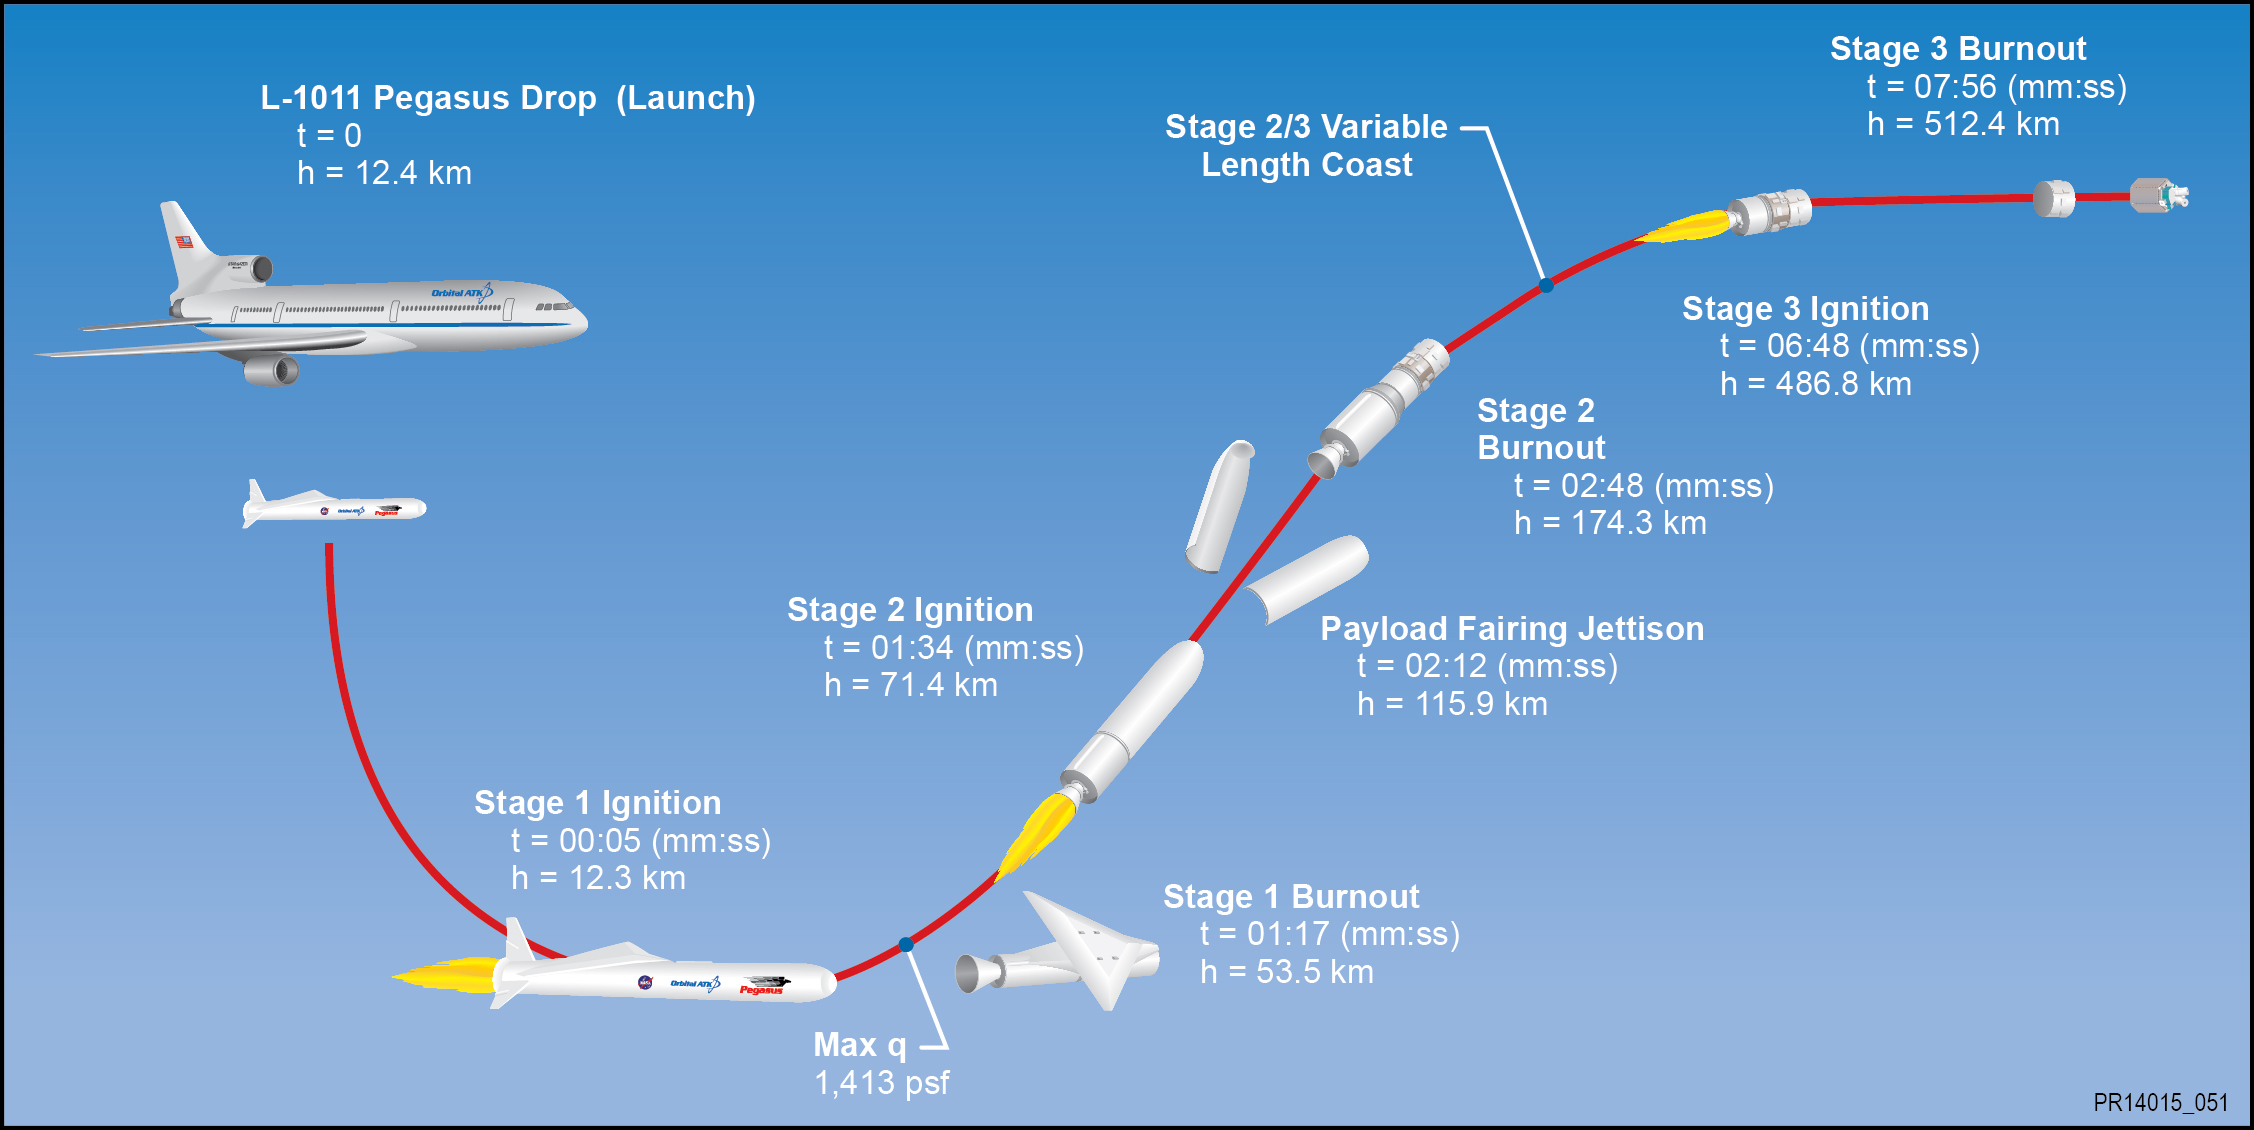
The rocket will be dropped for a short freefall of about 5 seconds to initiate the launch sewuence. It launches horizontally in midair with ignition of the first stage engine burn, and then tilts up to space to begin the trek to LEO.
Here’s a schematic of key launch events:
Schematic of Orbital ATK L-1011 aircraft and Pegasus XL rocket air drop launch of NASA’s CYGNSS microsatellite fleet. Credit: Orbital ATK
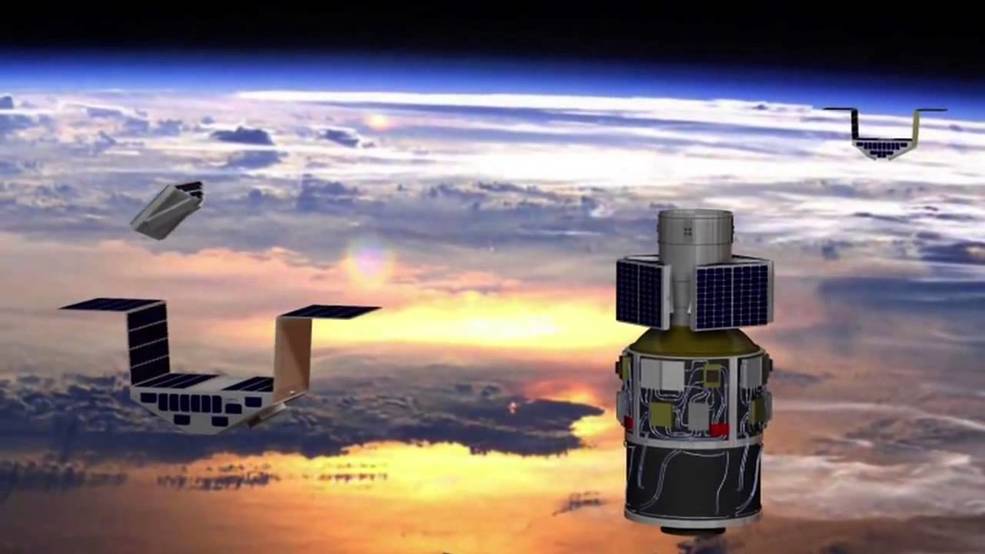
The $157 million fleet of eight identical spacecraft comprising the Cyclone Global Navigation Satellite System (CYGNSS) system will be delivered to low Earth orbit by the Orbital ATK Pegasus XL rocket.
The nominal mission lifetime for CYGNSS is two years but the team says they could potentially last as long as five years or more if the spacecraft continue functioning.
Artist’s concept of the deployment of the eight Cyclone Global Navigation Satellite System (CYGNSS) microsatellite observatories in space. Credits: NASA
Pegasus launches from the Florida Space Coast are infrequent. The last once took place over 13 years ago in April 2003 for the GALEX mission.
Typically they take place from Vandenberg Air Force Base in California or the Reagan Test Range on the Kwajalein Atoll.
CYGNSS counts as the 20th Pegasus mission for NASA.
The CYGNSS spacecraft were built by Southwest Research Institute in San Antonio, Texas. Each one weighs approx 29 kg. The deployed solar panels measure 1.65 meters in length.
The solar panels measure 5 feet in length and will be deployed within about 15 minutes of launch.
The Orbital ATK L-1011 Stargazer aircraft at the Skid Strip at Cape Canaveral Air Force Station in Florida. Attached beneath the Stargazer is the Orbital ATK Pegasus XL with NASA’s CYGNSS payload on board, being processed for launch on Dec. 12, 2016. Credit: Ken Kremer/kenkremer.com
The Space Physics Research Laboratory at the University of Michigan College of Engineering in Ann Arbor leads overall mission execution in partnership with the Southwest Research Institute in San Antonio, Texas.
The Climate and Space Sciences and Engineering Department at the University of Michigan leads the science investigation, and the Earth Science Division of NASA’s Science Mission Directorate oversees the mission.
Stay tuned here for Ken’s continuing Earth and Planetary science and human spaceflight news.
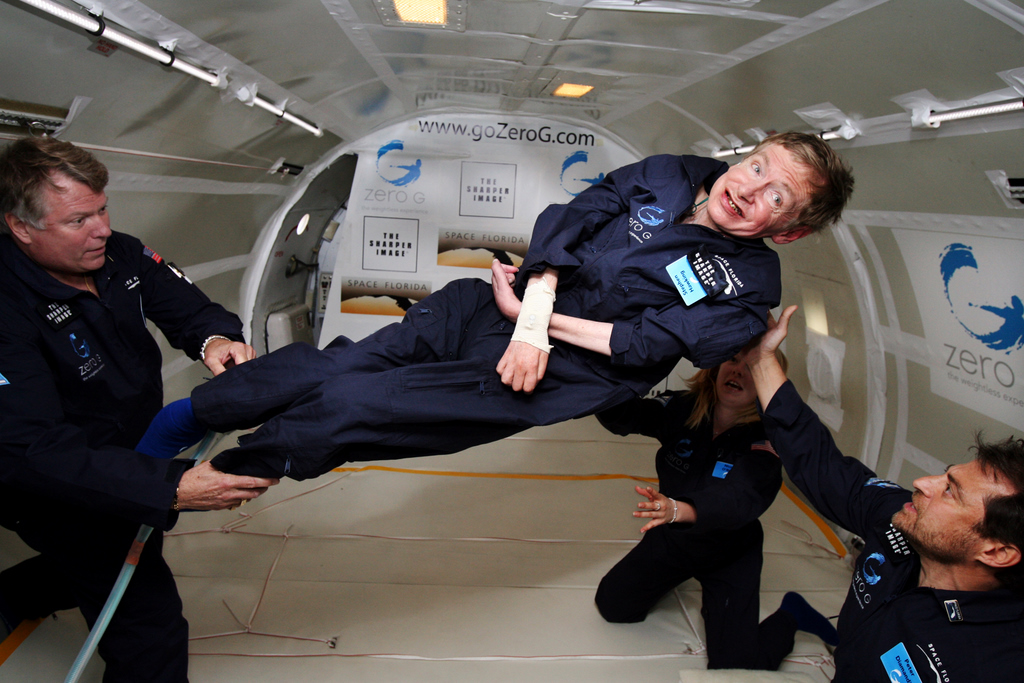
Professor Stephen Hawking enjoying a lighter moment, and not contemplating the end of humanity. Image credit: Zero G
If you’re thinking of having yourself cryogenically suspended and awakened in some future paradise, you might want to set your alarm clock for no later than 1,000 years from now. According to the BBC, Stephen Hawking will be saying this much in the 2016 Reith Lectures – a series of lectures organized by the BBC that explore the big challenges faced by humanity.
In Hawking’s first lecture, which will be broadcast on February 26th on the BBC, Hawking covers the topic of black holes, whether or not they have hair, and other concepts about these baffling objects.
But at the end of the lecture, he responded to audience questions about humanity’s capacity for self destruction. Hawking said that 1,000 years might be all we have until we meet our demise at the hands of our own scientific and technological advances.
As we have become increasingly advanced both scientifically and technologically, Hawking says, we will be creating “new ways that things can go wrong.” Hawking mentioned nuclear war, global warming, and genetically engineered viruses as things that could cause our extinction.
Nuclear War
Through the Cold War, annihilation at the hands of our own nuclear weapons was a real danger. The threat of a nuclear launch in response to a real or perceived threat was real. The resulting retaliation and counter-retaliation was a risk faced by everyone on the planet. And the two superpowers had enough warheads between them to potentially wipe out life on Earth.
One nuclear explosion can ruin your whole day. Image: Andrew Kuznetsov, CC by 2.0
The USA and the USSR have reduced their stockpiles of nuclear weapons in recent decades, but there are still enough warheads around to wipe us out. The possibility of a rogue state like North Korea setting off a nuclear confrontation is still very real. By the time Hawking’s 1,000 year time-frame has passed, we’ll either have solved this problem, or we won’t be here.
Global Warming
Earth is getting warmer, and though the Earth has warmed and cooled many times in its history, this time we only have ourselves to blame. We’ve been inadvertently enriching our atmosphere with carbon since the Industrial Revolution. All that carbon is creating a nice insulating layer around Earth, as it traps heat that would normally radiate into space. If we reach some of the “tipping points” that scientists talk about, like the melting of permafrost and the subsequent release of methane, we could be in real trouble.
Global Mean Surface Temperature. Image: NASA, Goddard Institute for Space Studies
Different climate engineering schemes have been thought up to counteract global warming, like seeding the upper atmosphere with reflective molecules, and having fleets of ships around the equator spraying sea mist into the air to partially block out the sun. Or even extracting carbon from the atmosphere. But how realistic or effective those counter-measures might be is not clear.
Genetically Engineered Viruses
As a weapon, a virus can be cheap and effective. There’ve been programs in the past to develop biological weapons. The temptation to use genetic science to create extremely deadly viruses may prove too great.
Smallpox and Viral Hemorrhagic Fevers have been weaponized, and as our genetic manipulation abilities grow, it’s possible, or even likely, that somebody somewhere will attempt develop even more dangerous viral weapons. They may be doing it right now.
Hawking never mentioned AI in his talk, but it fits in with the discussion. As our machines get smarter and smarter, will they deduce that the only chance for survival is to remove or reduce the human population? Who knows. But Hawking himself, as well as other thinkers, have been warning us that there may be a catastrophic downside to our achievements in AI.
A Google driverless car: Looks harmless, doesn’t it? Image: Michael Shick http://creativecommons.org/licenses/by-sa/4.0
We may love the idea of driverless cars, and computer assistants like SIRI. But as numerous science fiction stories have warned us (Skynet in the Terminator series being my favorite,) it may be a small step from very helpful AI that protects us and makes our lives easier, to AI that decides existence would be a whole lot better without us pesky humans around.
The Technological Singularity is the point at which artificially intelligent systems “wake up” and become—more or less—conscious. These AI machines would start to improve themselves recursively, or build better and smarter machines. At this point, they would be a serious danger to humanity.
Drones are super popular right now. They flew off the shelves at Christmas, and they’re great toys. But once we start seeing drones with primitive but effective AI, patrolling the property of the wealthy, it’ll be time to start getting nervous.
Extinction May Have To Wait
As our scientific and technological prowess grows, we’ll definitely face new threats, just like Hawking says. But, that same progress may also protect us, or make us more resilient. Hawking says, “We are not going to stop making progress, or reverse it, so we have to recognise the dangers and control them. I’m an optimist, and I believe we can.” So do we.
Maybe you’ll be able to hit the snooze button after all.
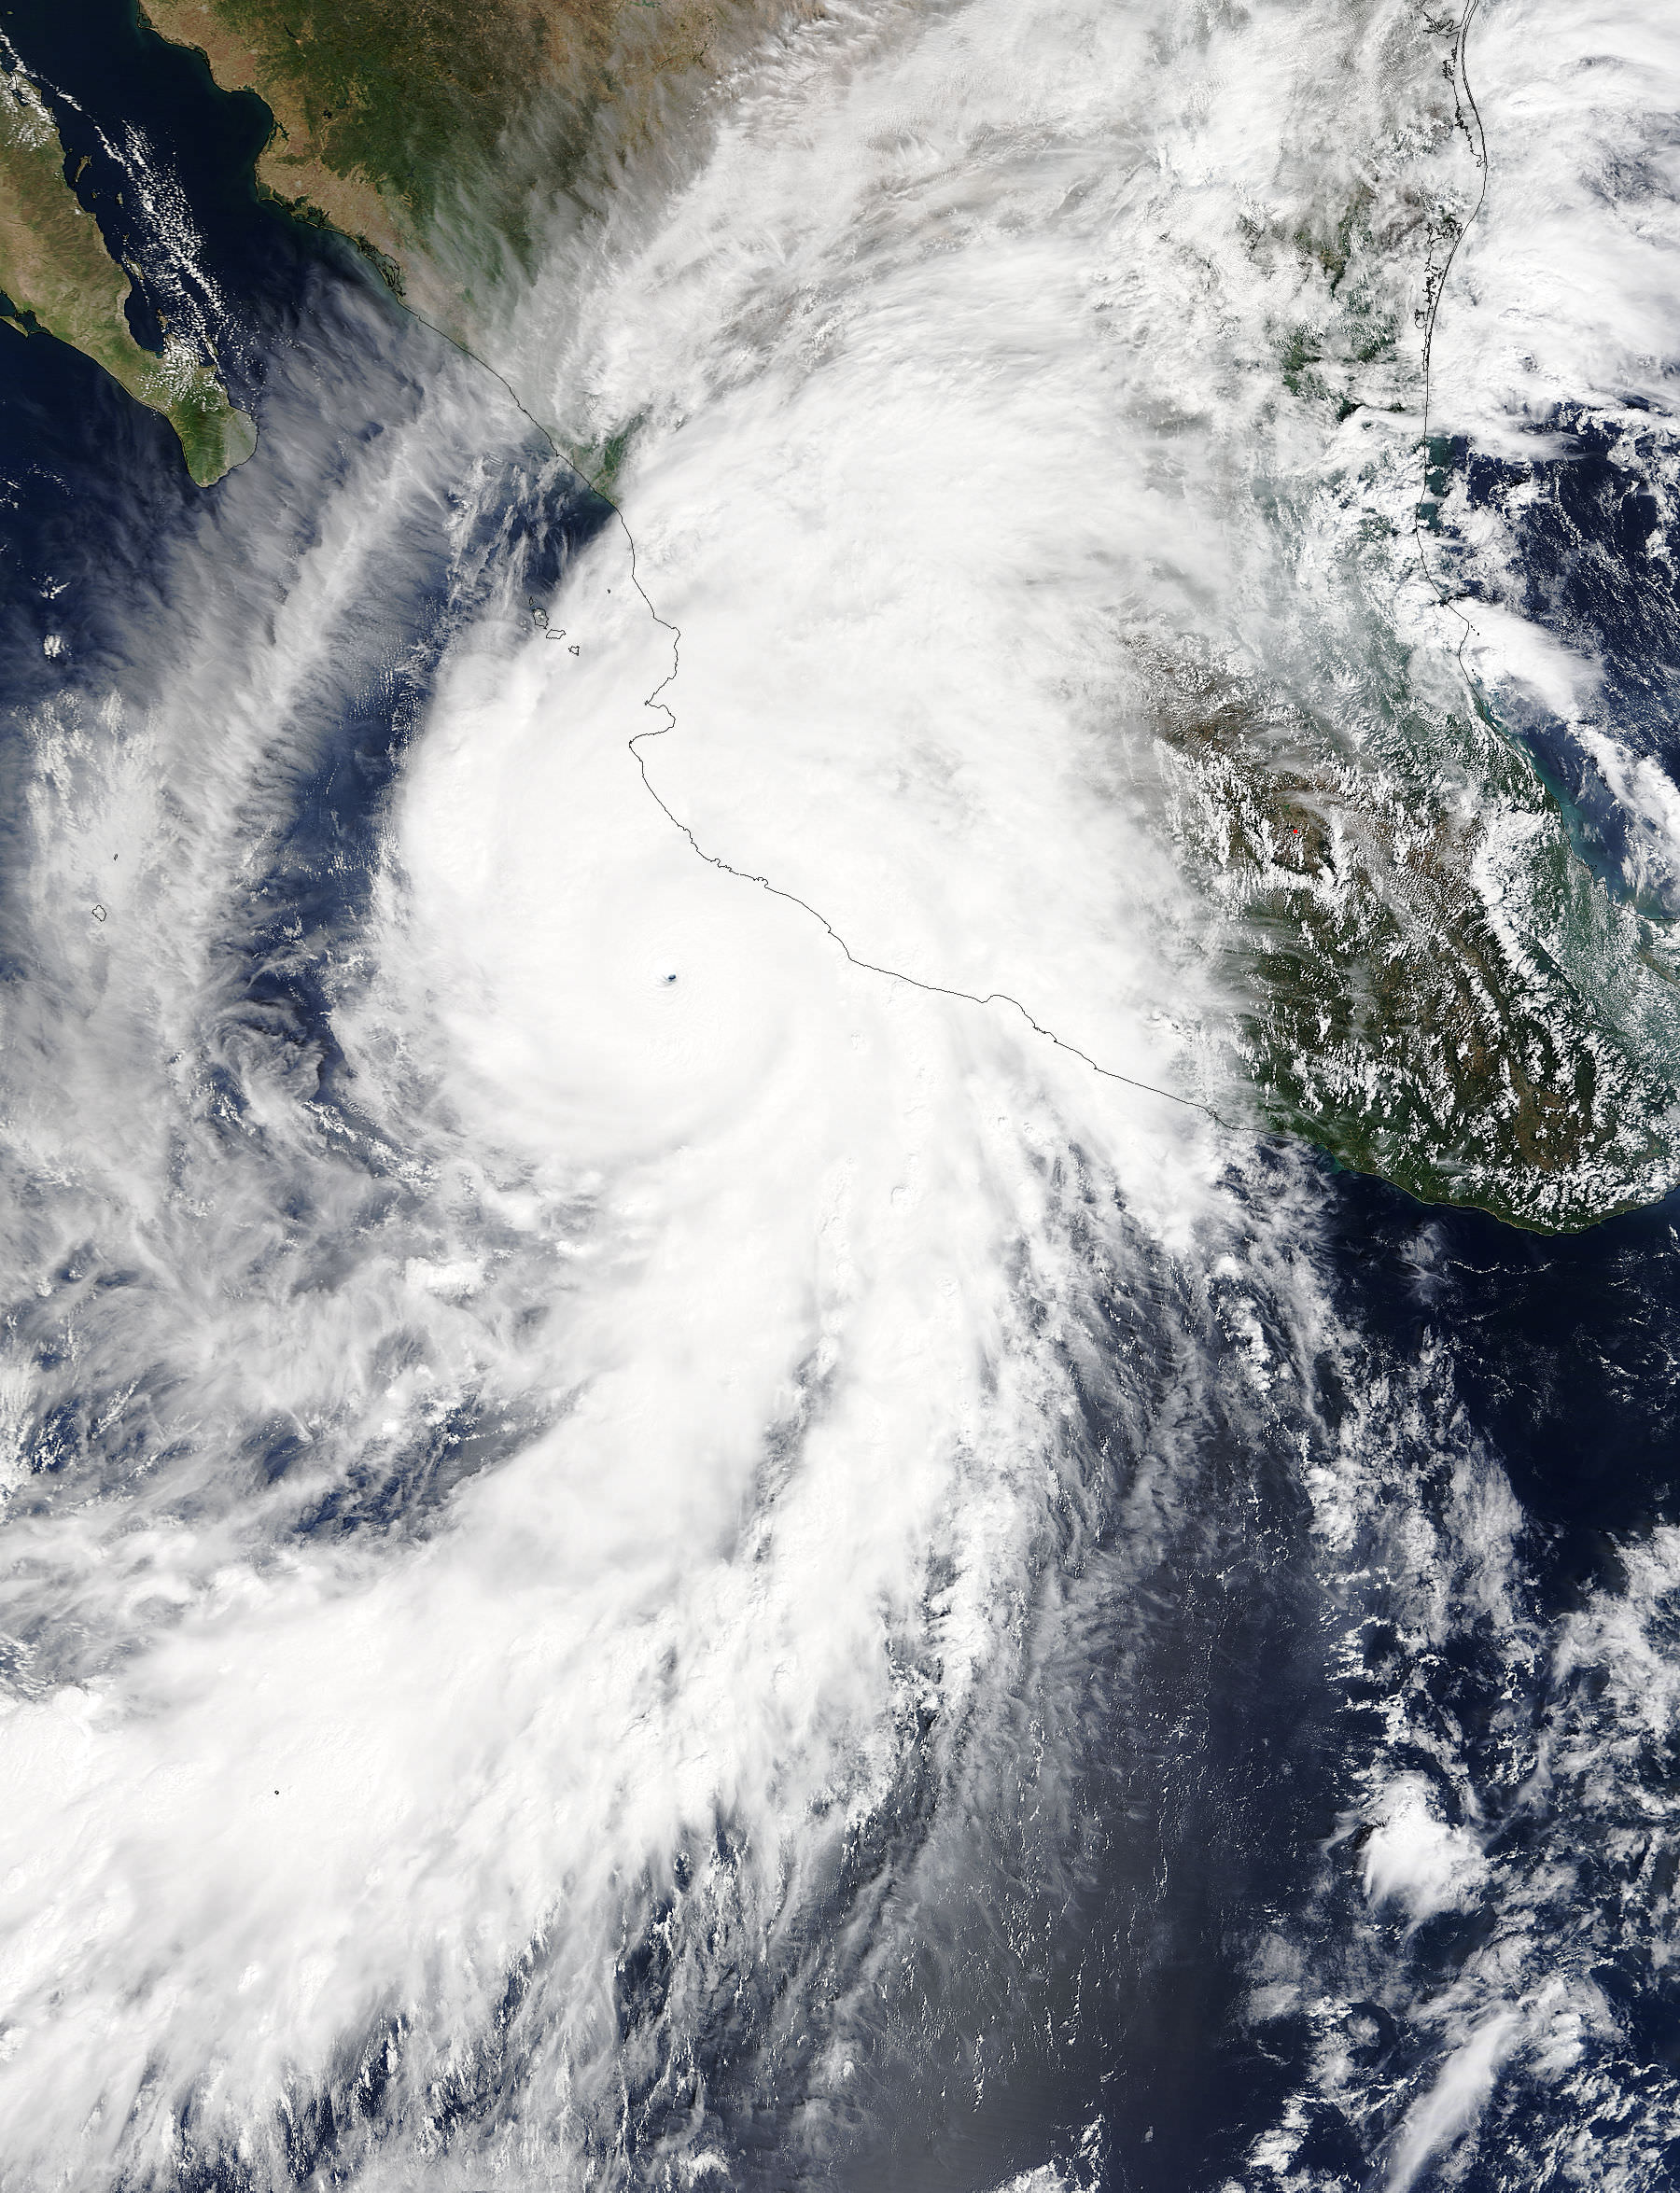
“Hurricane #Patricia approaches #Mexico. It's massive. Be careful” in this image taken by NASA astronaut Scott Kelly aboard the ISS on Oct. 23, 2015. Credit: NASA/Scott Kelly
“Hurricane #Patricia approaches #Mexico. It’s massive. Be careful” in this image taken by NASA astronaut Scott Kelly aboard the ISS on Oct. 23, 2015. Credit: NASA/Scott Kelly
More images and videos below[/caption]
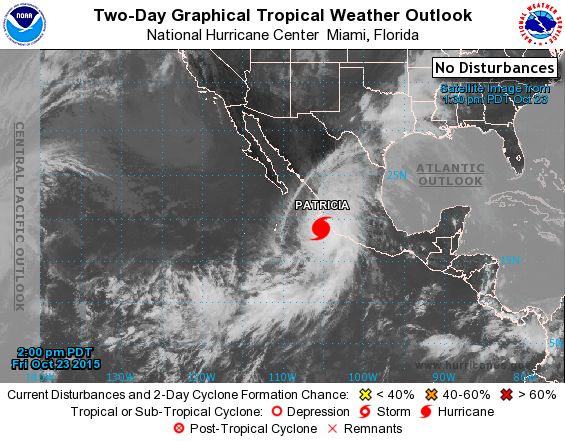
Hurricane Patricia, the strongest storm in recorded history with winds exceeding 190 mph (305 km/h) is right now menacing millions in Mexico after suddenly intensifying with little warning over the past day, threatening widespread catastrophic destruction as it barrels towards frightened residents along the nations Pacific coast and makes landfall this evening, Friday, Oct. 23.
Other NASA and NOAA weather satellites are actively monitoring and measuring the strongest storm on the planet right now.
“Hurricane #Patricia approaches #Mexico. It’s massive. Be careful,” Kelly wrote on his twitter account with a pair of images taken from the ISS.
Patricia unexpectedly intensified quite rapidly to a Category 5 storm from a tropical storm in the space of just 24 hours from yesterday to today with the significant potential for loss of life and likely widespread catastrophic damage.
This morning Patricia had sustained winds of 190 mph (305 km/h) , on the Saffir-Simpson Hurricane Wind Scale, with gusts up to 235 mph. That’s comparable to an EF-4 tornado, but its much wider.
Weather forecasters say that unusually warm waters, possibly from the current El Niño weather pattern may be causing the rapid intensification of the storm to unprecedented power never before seen.
On Oct. 23 at 17:30 UTC (1:30 p.m. EDT) NASA’s Terra satellite saw the eastern quadrant of Hurricane Patricia over Mexico and the storm’s pinhole eye. Credits: NASA’s Goddard MODIS Rapid Response Team
“Hurricane #Patricia looks menacing from @space_station. Stay safe below,” tweeted Kelly, who just broke the American record for most time spent in space.
Patricia is making landfall near the tourist resort of Puerto Vallarta, the town of Cuixmala and the city of Manzanillo along Mexico’s Pacific coast, as it slightly weakens to 165 mph (265 km/h) with destructive force.
Here is the latest Hurricane Patricia animation from NOAA:
Patricia is the most powerful storm ever to make landfall and many millions live in its path that is expected to track eastwards across inland areas of Mexico and then move up into the United States at Texas with flooding rains.
The Mexican government has warned millions to take shelter to evacuate. Over 15000 tourists have been evacuated from Puerto Vallarta to other regions. But the effort was hampered since the airport has been closed.
Catastrophic destruction to homes, businesses and infrastructure is feared.
Some 10 to 20 inches of rain is expected along the coast, causing mudslides across Mexico.
Waves heights exceeding 30 feet are also expected.
Heavy rains and flash flooding will continue into the US with the heaviest downpours expected in Texas and Louisiana.
Hurricane Patricia on Oct. 23, 2015 from the National Hurricane Center
Here’s the 7 PM CDT advisory from the National Hurricane Center:
“EXTREMELY DANGEROUS HURRICANE PATRICIA MOVING FARTHER INLAND OVER SOUTHWESTERN MEXICO”
“The center of Hurricane Patricia was located near latitude 19.5 North, longitude 104.9 West. Patricia ismoving toward the north-northeast near 15 mph (24 km/h) and this motion is expected to continue with some increase in forward speed tonight and Saturday. On the forecast track, the center of Patricia should continue to move inland over southwestern Mexico.
Patricia is expected to move quickly north-northeastward across western and northern Mexico through Saturday.
Satellite images indicate that Patricia has continued to weaken, and maximum sustained winds are estimated to be near 160 mph (260 km/h) with higher gusts. Patricia is a category 5 hurricane on the Saffir-Simpson Hurricane Wind Scale. Patricia is forecast to rapidly weaken over the mountains of Mexico and dissipate on Saturday.
Hurricane force winds extend outward up to 35 miles (55 km) from the center and tropical storm force winds extend outward up to 175 miles (280 km).
The estimated minimum central pressure is 924 mb (27.29 inches).”
Here’s a video of Hurricane Patricia from the ISS taken today, Oct 23, 2015.
Video caption: Outside the International Space Station, cameras captured dramatic views of Hurricane Patricia at 12:15 p.m. EDT on October 23, 2015 as the mammoth system moved north at about 10 mph, heading for a potentially catastrophic landfall along the southwest coast of Mexico sometime during the day, according to the National Hurricane Center. Packing winds of 200 miles per hour, Patricia is the strongest in recorded history in the southeastern Pacific Ocean. The National Hurricane Center says that once Patricia crosses the Mexican coast it should weaken quickly and dissipate Oct. 24 due to upper level winds and mountainous terrain, but likely will introduce copious amounts of rainfall to the Texas coast through the weekend. Credit: NASA
Stay tuned here for Ken’s continuing Earth and planetary science and human spaceflight news.