See EPIC Views of Rotating Earth Daily from NASA’s New DSCOVR Observatory Website

Earth rotates through an entire day as captured in this animation of 22 still images taken on Sept. 17, 2015 by NASA’s Earth Polychromatic Imaging Camera (EPIC) camera on the Deep Space Climate Observatory (DSCOVR) spacecraft. Credits: NASA

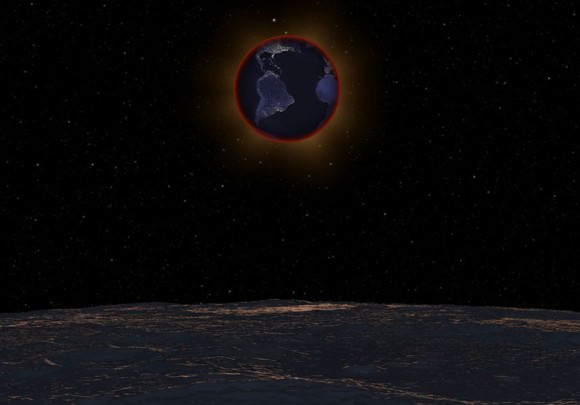
At long last, beautiful new high resolution views of the rotating Earth can be seen daily by everyone at a new NASA website – all courtesy of images taken by NASA’s EPIC camera on board the Deep Space Climate Observatory (DSCOVR) spacecraft. And as seen in the time-lapse animation above, they provide a wonderful new asset for students everywhere to learn geography that’s just a finger tip away!

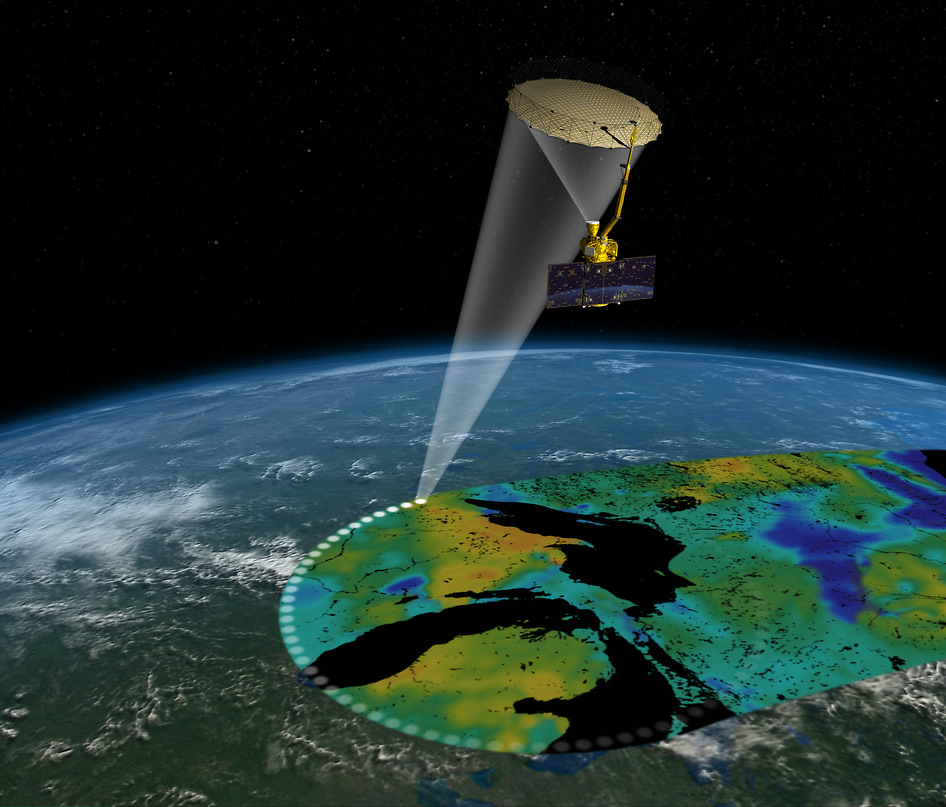
The EPIC camera, which stands for Earth Polychromatic Imaging Camera (EPIC), is located a million miles away on the DSCOVR real time space weather monitoring satellite and is designed to take full disk color images of the sunlit side of our home planet multiple times per day.

The EPIC NASA images are literally just a finger tip away, after a 17 year wait to get the satellite into the launch queue since it was first proposed by former VP Al Gore. They are all easily viewed at NASA’s new EPIC camera website which went online today, Monday, October 19, 2015.

To see the daily sequence of rotating images, visit the EPIC website link: http://epic.gsfc.nasa.gov/

This EPIC image was taken on Oct.17 and shows the Australian continent and a portion of Asia.

EPIC image taken on Oct. 17, 2015 showing the continent of Australia and a portion of Asia. Credit: NASA

An annotated guide map illustration identifying the visible land masses accompanies each EPIC image and follows along as the Earth rotates daily.

What a great geography learning tool for student classrooms worldwide!

Annotated guide map identifying the visible land masses accompanies each EPIC image. Credit: NASA

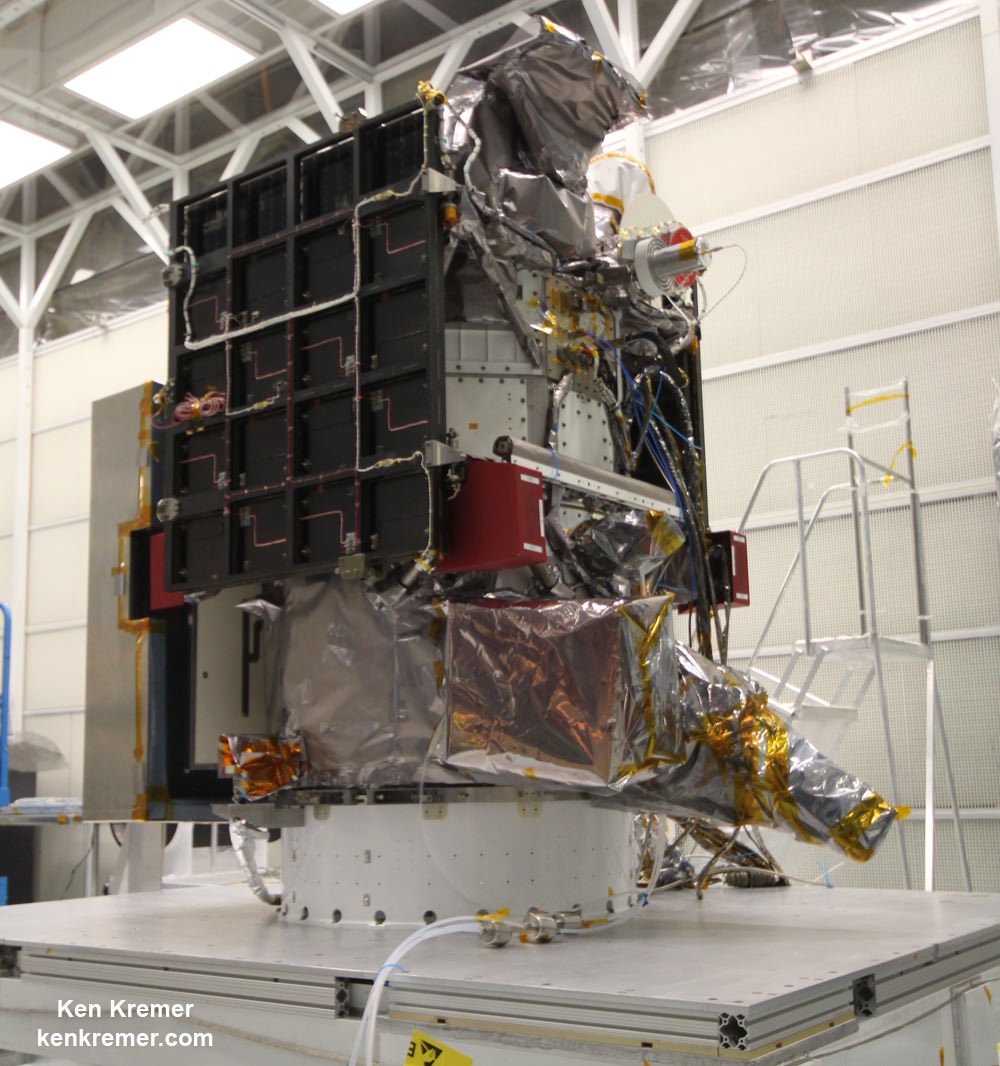
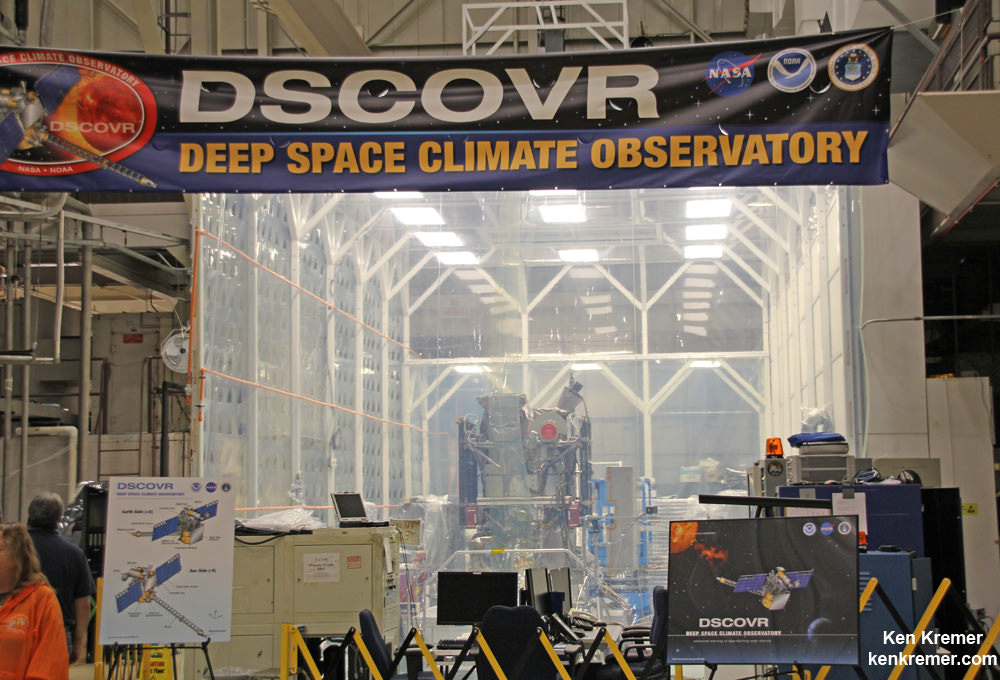
DSCOVR is a joint mission between NOAA, NASA, and the U.S Air Force (USAF) that is managed by NOAA. The satellite and science instruments were provided by NASA and NOAA.

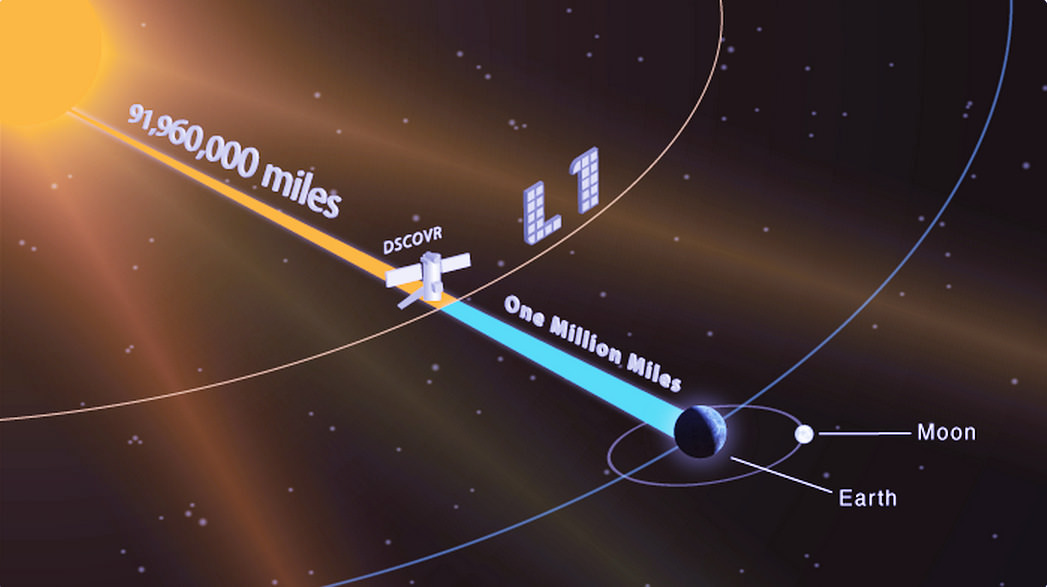
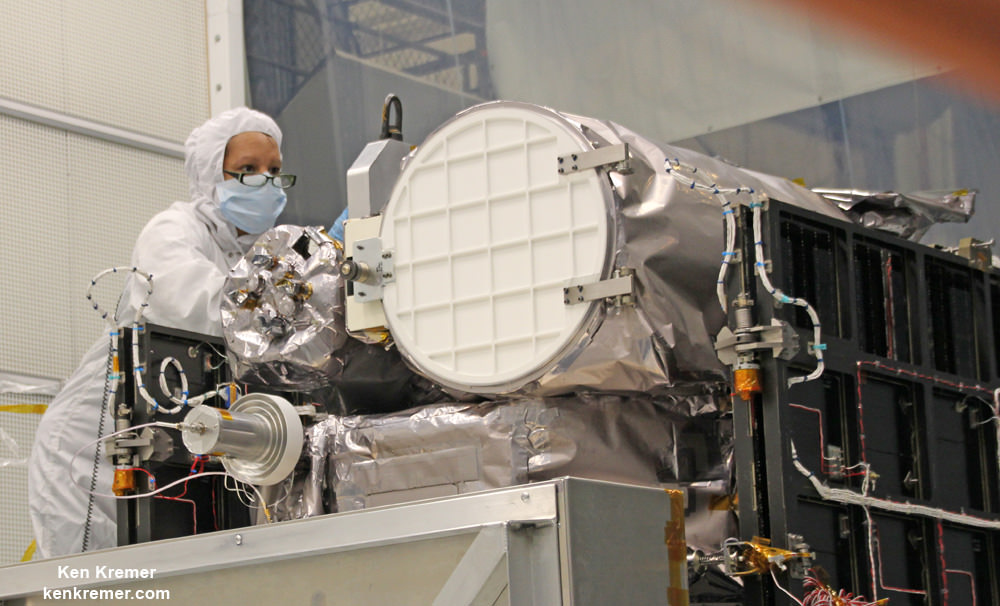
EPIC is a four megapixel CCD camera and telescope mounted on DSCOVR and orbiting around the L1 Lagrange Point – a neutral gravity point that lies on the direct line between Earth and the sun.

NASA says that once per day they will post “at least a dozen new color images of Earth acquired from 12 to 36 hours earlier” taken by the agency’s EPIC camera. The EPIC images will be stored in an archive searchable by date and continent.

The image sequence will show “the Earth as it rotates, thus revealing the whole globe over the course of a day.”

“The effective resolution of the DSCOVR EPIC camera is somewhere between 6.2 and 9.4 miles (10 and 15 kilometers),” said Adam Szabo, DSCOVR project scientist at NASA’s Goddard Space Flight Center, Greenbelt, Maryland, in a statement.

“The color Earth images are created by combining three separate single-color images to create a photographic-quality image equivalent to a 12-megapixel camera. The camera takes a series of 10 images using different narrowband filters — from ultraviolet to near infrared — to produce a variety of science products. The red, green and blue channel images are used to create the color images. Each image is about 3 megabytes in size.”

EPIC will capture “a constant view of the fully illuminated Earth as it rotates, providing scientific observations of ozone, vegetation, cloud height and aerosols in the atmosphere.”

Technician works on NASA Earth science instruments and Earth imaging EPIC camera (white circle) housed on NOAA/NASA Deep Space Climate Observatory (DSCOVR) inside NASA Goddard Space Flight Center clean room in November 2014.  Credit: Ken Kremer/kenkremer.com
Technician works on NASA Earth science instruments and Earth imaging EPIC camera (white circle) housed on NOAA/NASA Deep Space Climate Observatory (DSCOVR) inside NASA Goddard Space Flight Center clean room in November 2014. Credit: Ken Kremer/kenkremer.com

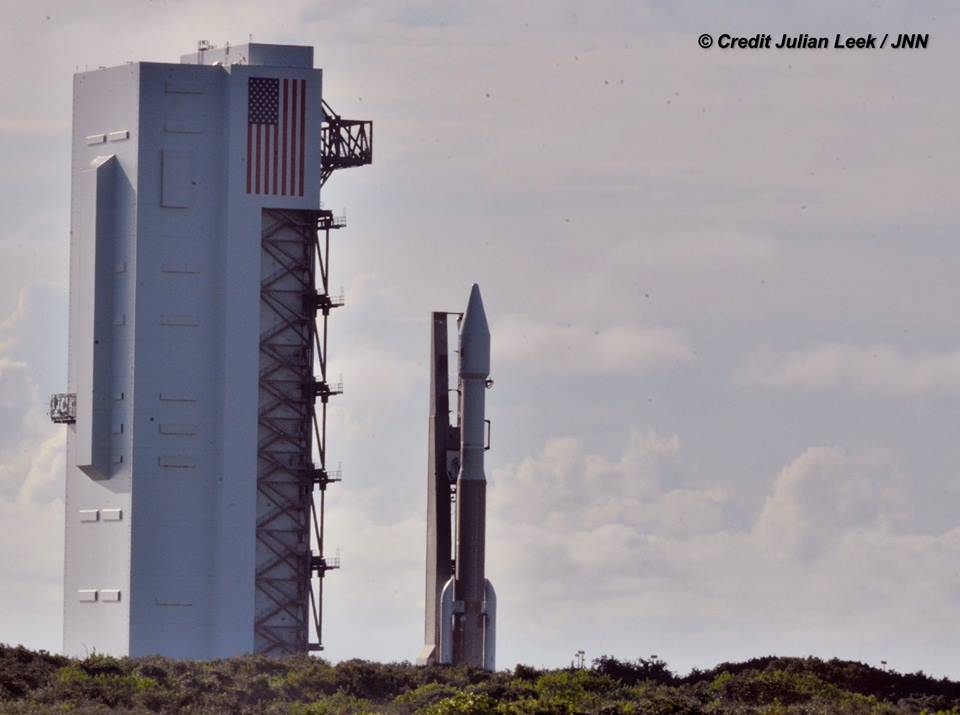
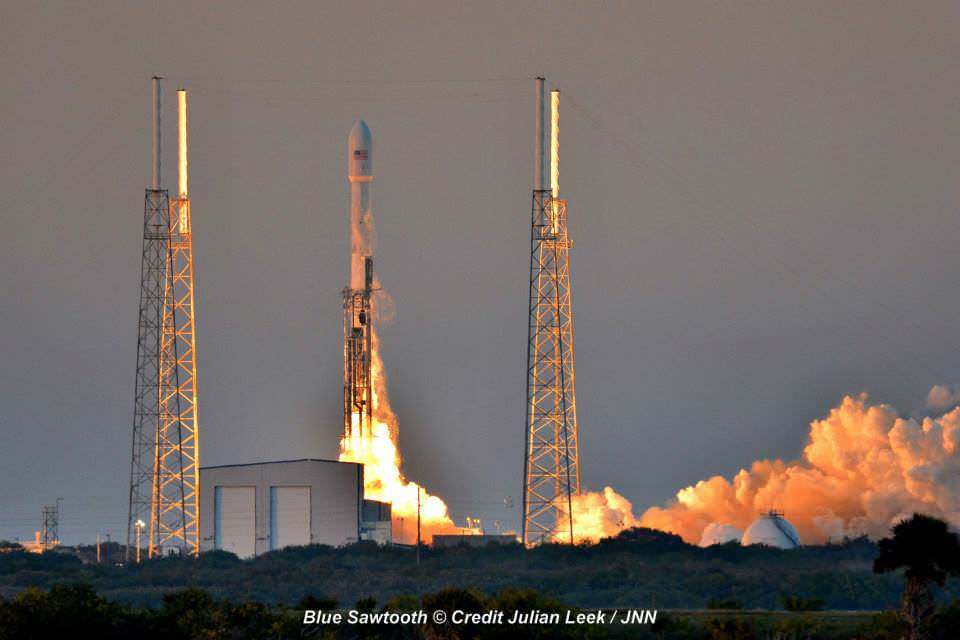
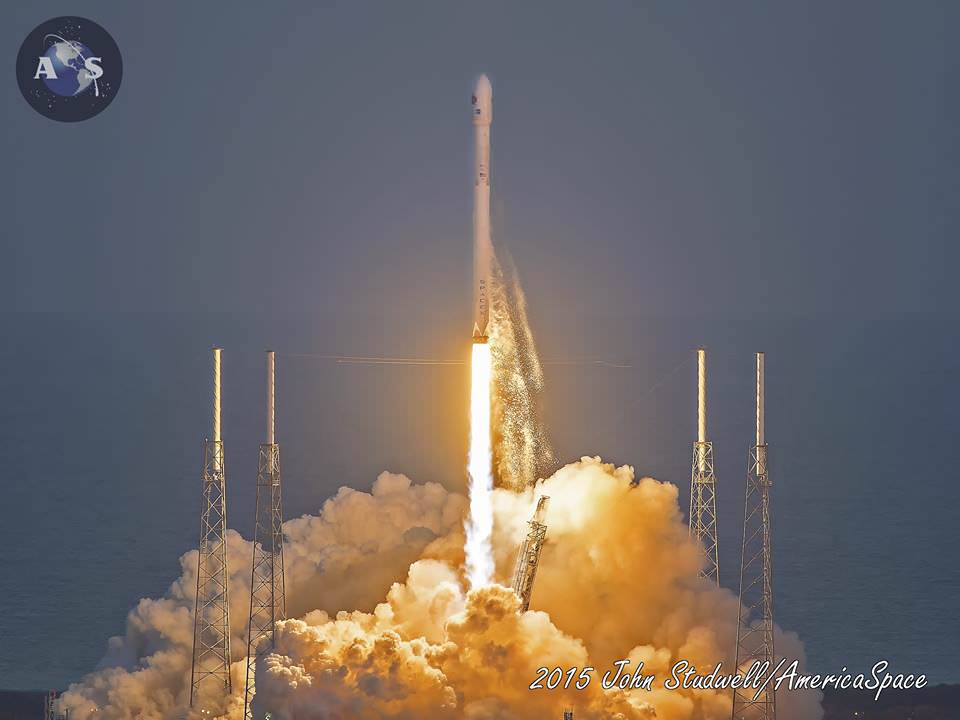
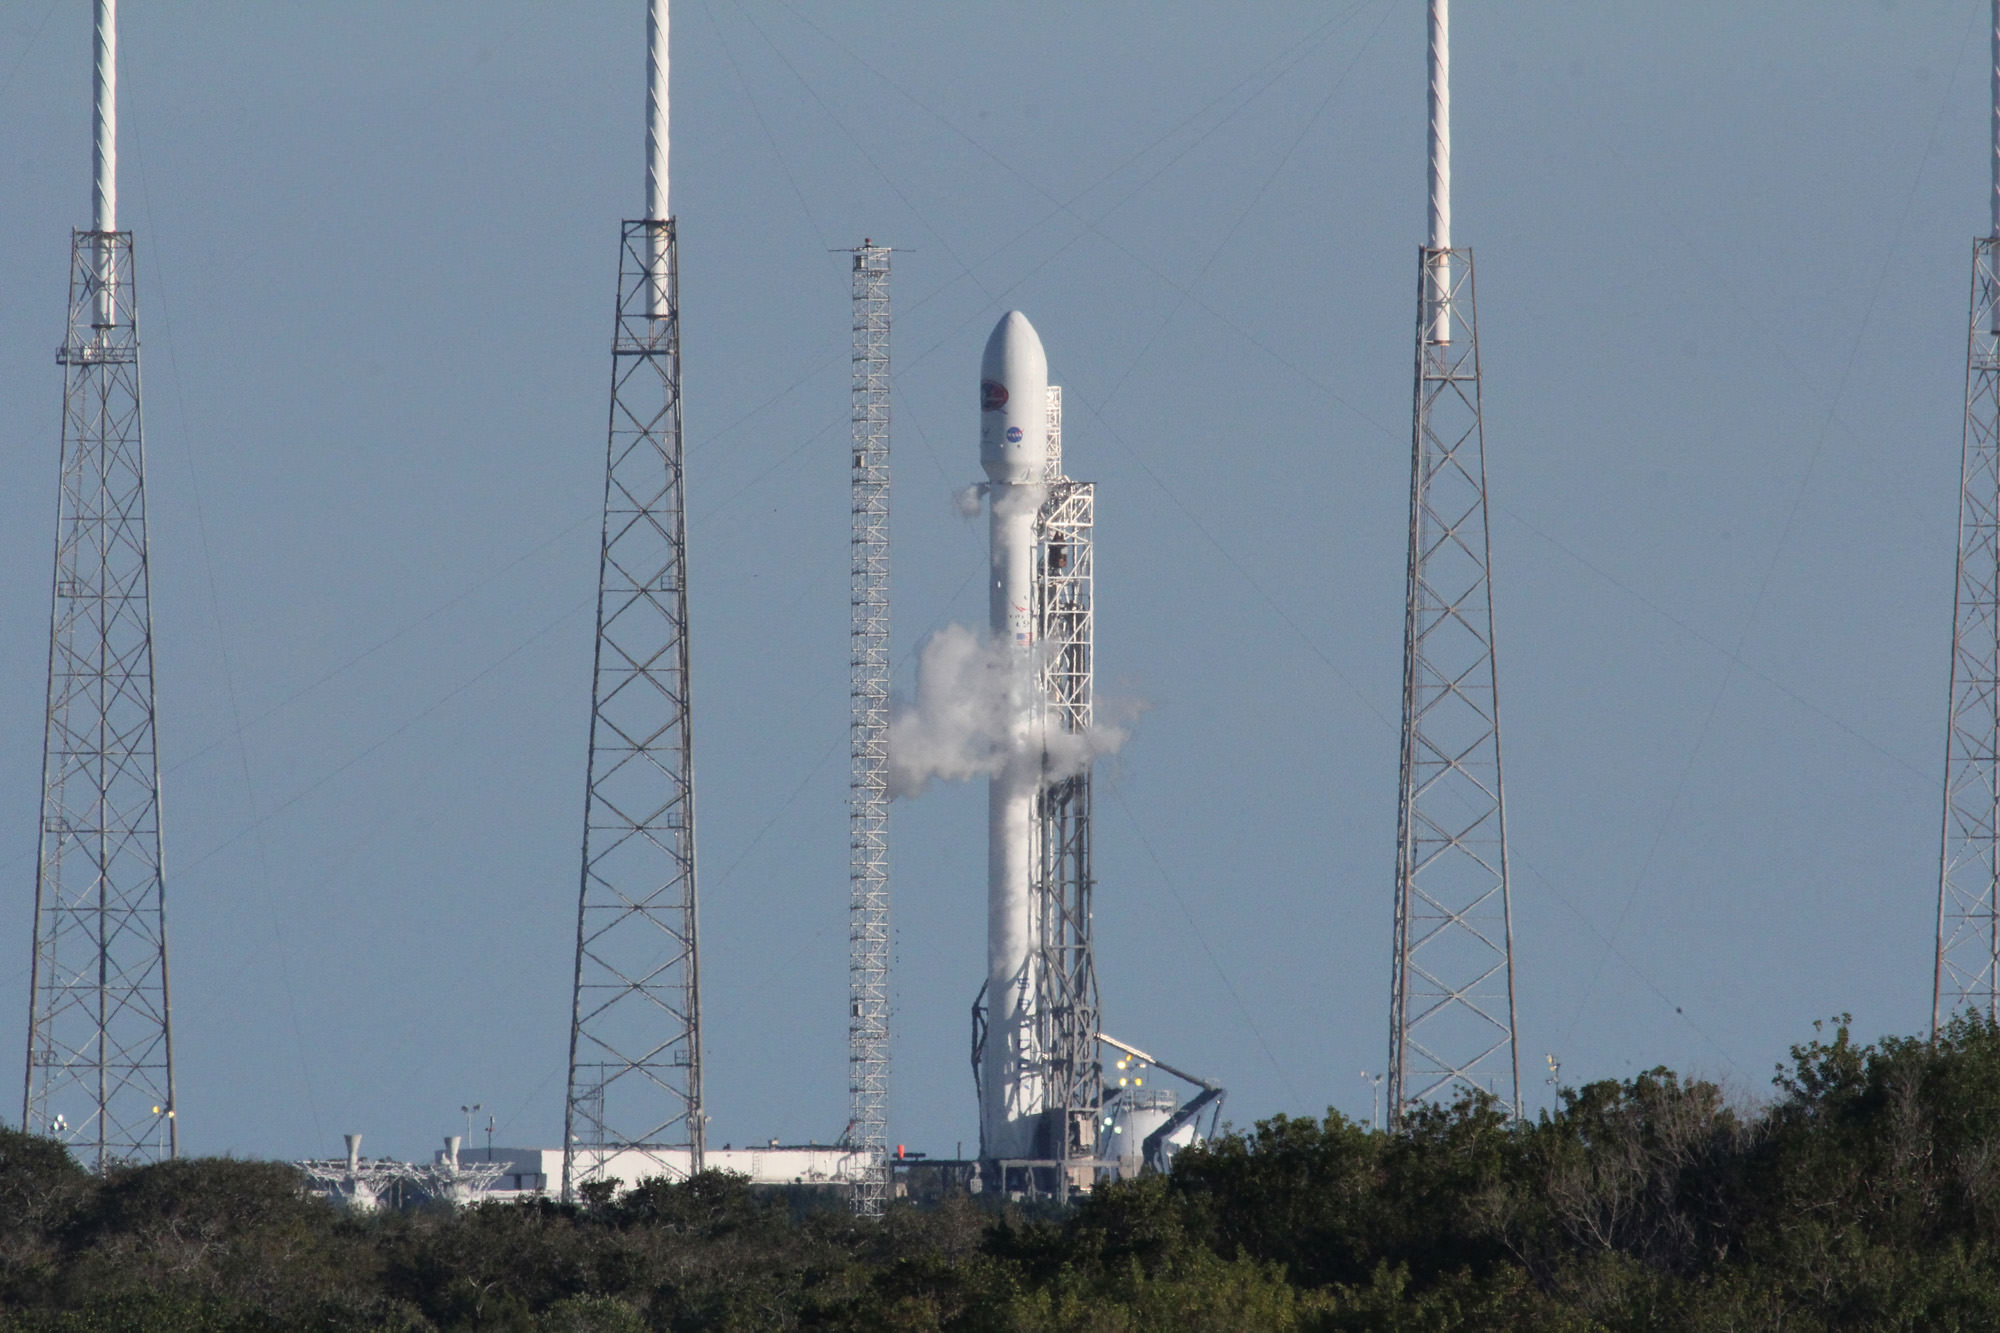
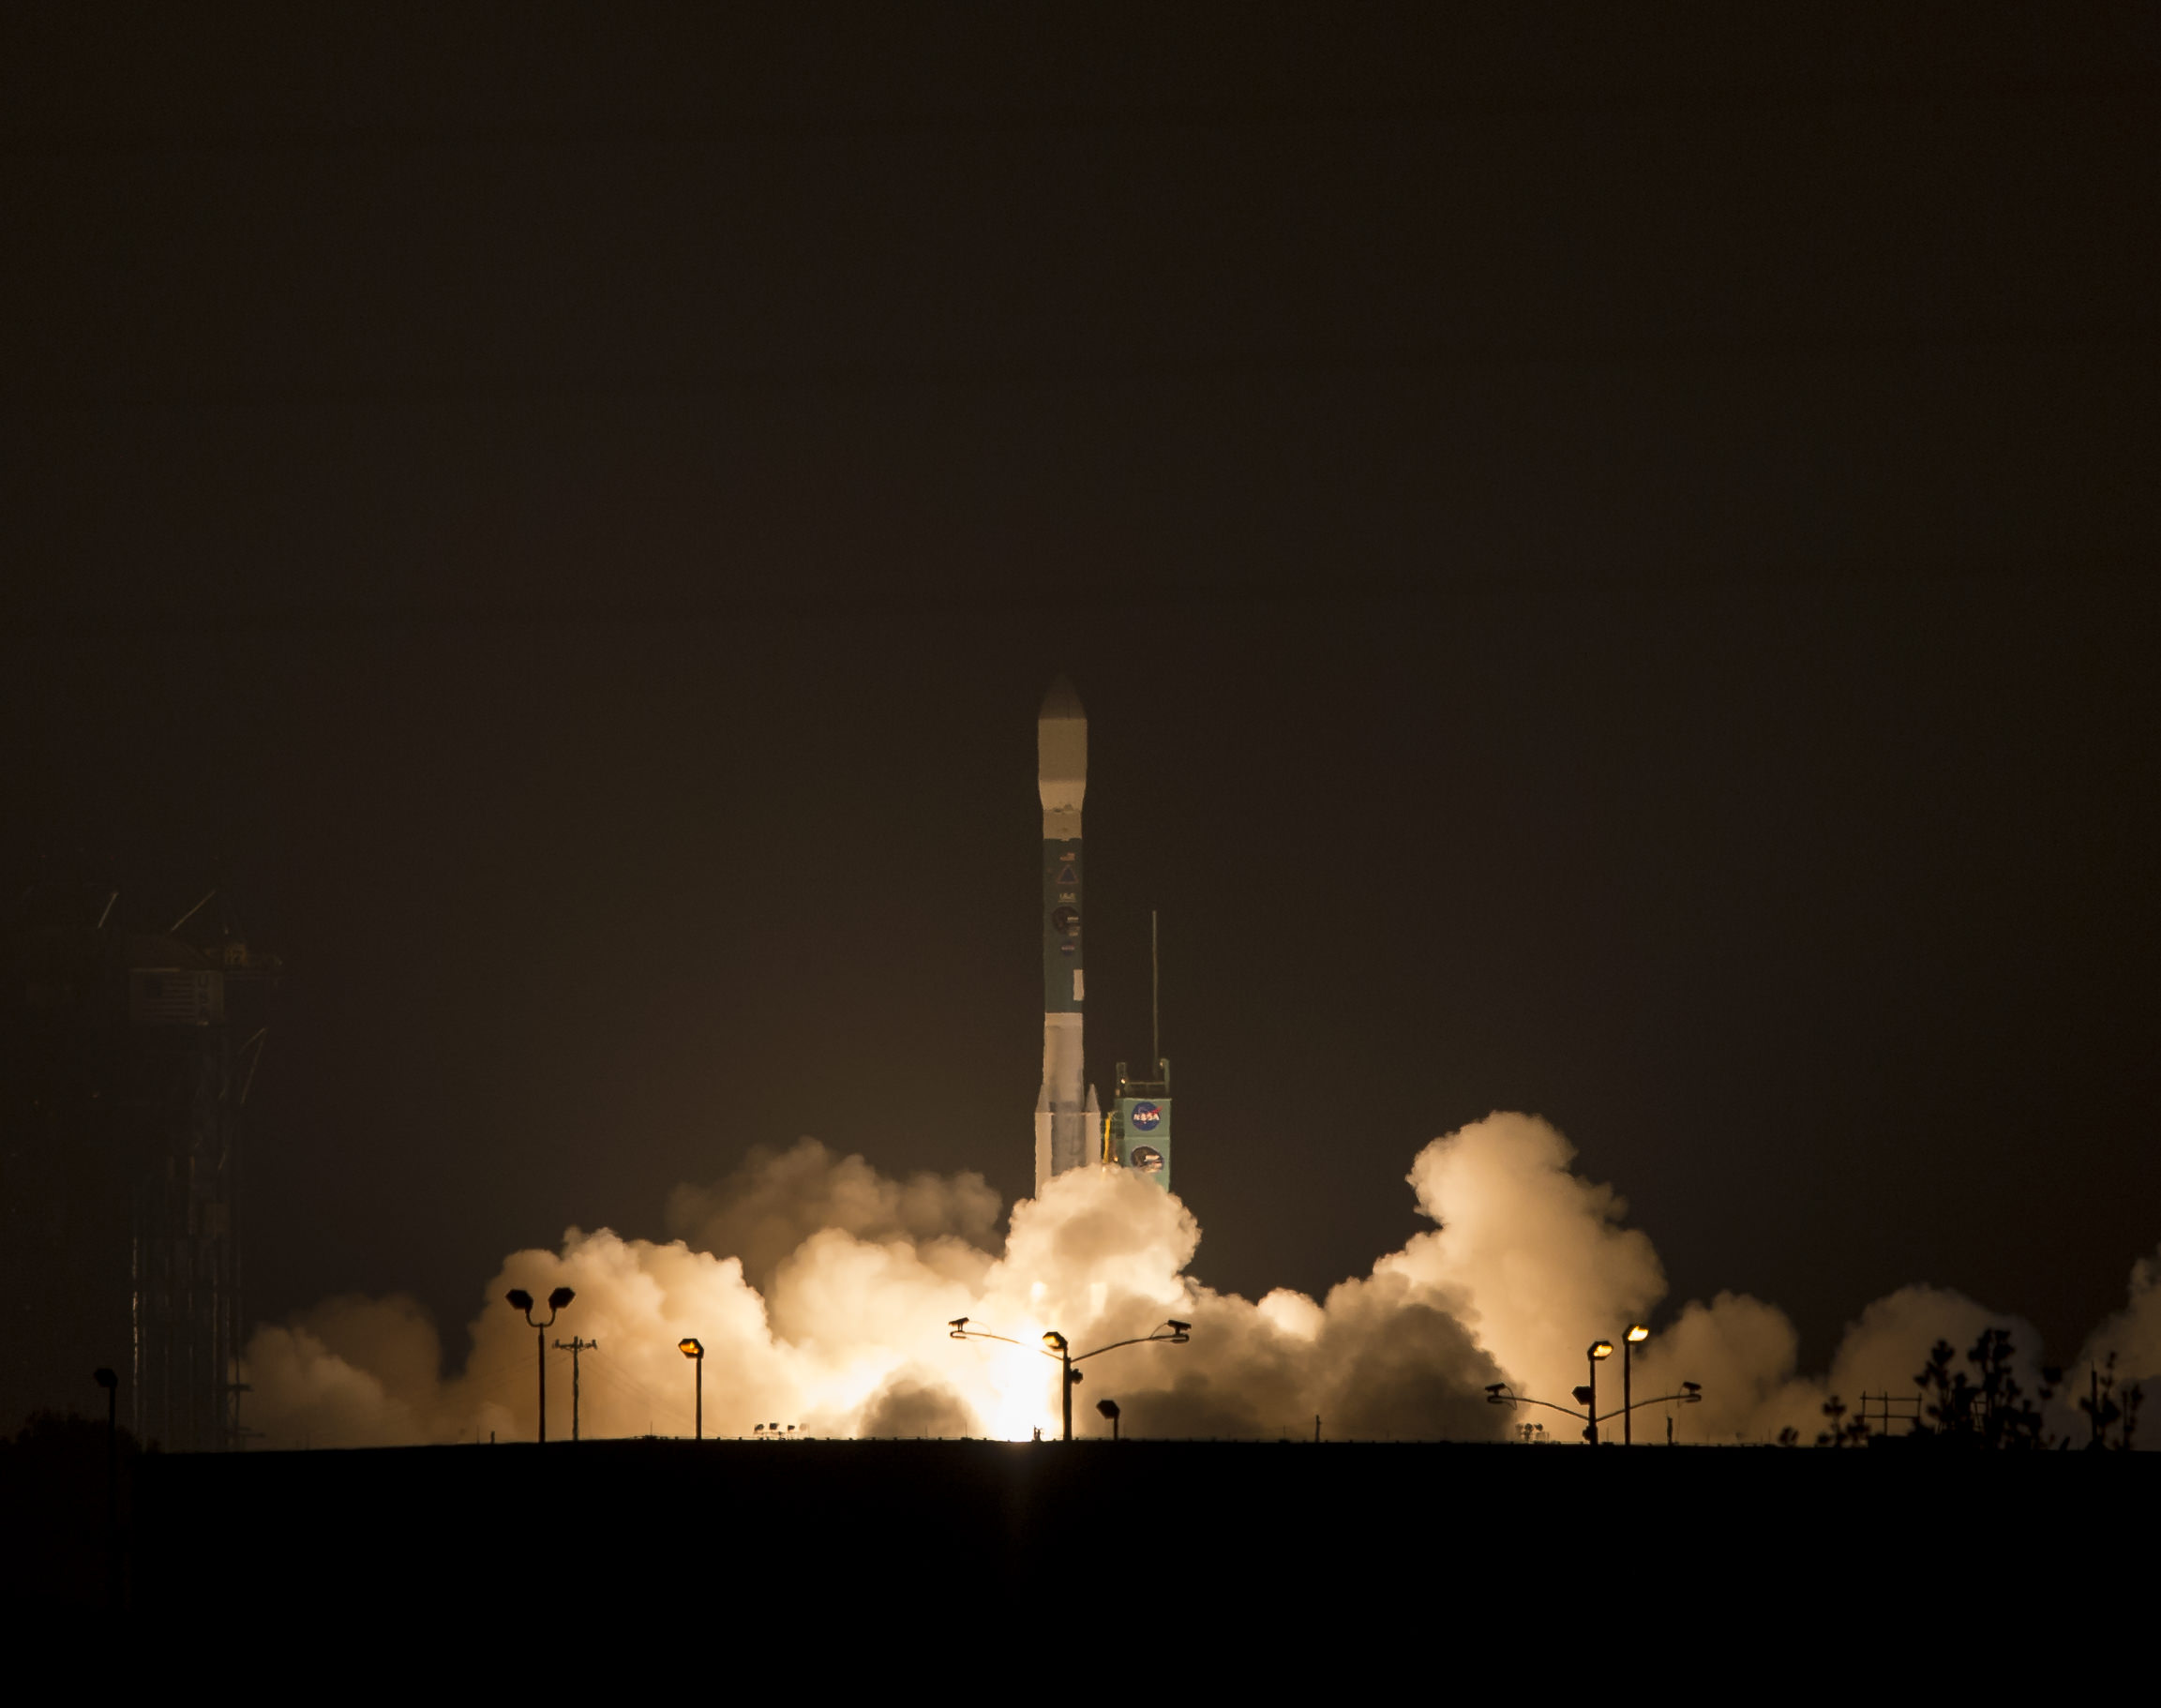
The couch sized probe was launched atop a SpaceX Falcon 9 on Feb. 11, 2015 from Cape Canaveral, Florida, to start the million mile journey to its deep space observation post at L1. The rocket was funded by the USAF.

The primary goal of the $340 million DSCOVR satellite is to monitor the solar wind and aid very important forecasts of space weather at Earth from L1.

L1 is located 1.5 million kilometers (932,000 miles) sunward from Earth. At L1 the gravity between the sun and Earth is perfectly balanced and the DSCOVR satellite orbits about that spot just like a planet.

The mission is vital because its solar wind observations are crucial to maintaining accurate space weather forecasts to protect US infrastructure such as power grids, aviation, planes in flight, all types of Earth orbiting satellites for civilian and military needs, telecommunications, ISS astronauts and GPS systems.

This animation shows images of the far side of the moon, illuminated by the sun, as it crosses between the DISCOVR spacecraft's Earth Polychromatic Imaging Camera (EPIC) camera and telescope, and the Earth - one million miles away.  Credit: NASA/NOAA
This animation shows images of the far side of the moon, illuminated by the sun, as it crosses between the DISCOVR spacecraft’s Earth Polychromatic Imaging Camera (EPIC) camera and telescope, and the Earth – one million miles away. Credit: NASA/NOAA

DSCOVR was first proposed in 1998 by then US Vice President Al Gore as the low cost ‘Triana’ satellite to take near continuous views of the Earth’s entire globe to feed to the internet as a means of motivating students to study math and science.

It was also dubbed “Goresat.”

The probe was eventually resurrected and partially rebuilt at NASA Goddard Space Flight Center as a much more capable Earth science satellite that would also conduct the space weather observations.

But Triana was shelved for purely partisan political reasons and the satellite was placed into storage at NASA Goddard.

Thus the practical and teachable science and daily scenes of the gorgeously rotating Earth were lost – until now!

Former VP Al Gore was clearly delighted with today’s launch of NASA’s EPIC website in this pair of tweets:

“Today @NASA launched its site for #DSCOVR’s daily images. I look forward to seeing more from #DSCOVR,” tweeted Al Gore.

“DSCOVR’s site displaying new daily images of Earth from L1 was launched today! Congratulations to all those who made this happen!”

Stay tuned here for Ken’s continuing Earth and planetary science and human spaceflight news.

Ken Kremer

NOAA/NASA Deep Space Climate Observatory (DSCOVR) undergoes processing in NASA Goddard Space Flight Center clean room. Solar wind instruments at right. DSCOVER will launch in February 2015 atop SpaceX Falcon 9 rocket.  Credit: Ken Kremer/kenkremer.com
NOAA/NASA Deep Space Climate Observatory (DSCOVR) undergoes processing in NASA Goddard Space Flight Center clean room. Solar wind instruments at right. DSCOVER launched in February 2015 atop SpaceX Falcon 9 rocket. Credit: Ken Kremer/kenkremer.com
NOAA/NASA/USAF Deep Space Climate Observatory (DSCOVR) undergoes processing in NASA Goddard Space Flight Center clean room.  Probe will launch in February atop SpaceX Falcon 9 rocket.  Credit: Ken Kremer - kenkremer.com
NOAA/NASA/USAF Deep Space Climate Observatory (DSCOVR) undergoes processing in NASA Goddard Space Flight Center clean room. Probe launched in February 2015 atop SpaceX Falcon 9 rocket. Credit: Ken Kremer/kenkremer.com

Why Was September’s Lunar Eclipse So Dark?

The September 17, 2015 total lunar eclipse - the last of the recent tetrad of lunar eclipses over the past 17 months - was darker than expected. Several factors described below were in play. This photo was taken in Washington's Olympic National Park. Credit: Rick Klawitter

First off, a huge thank you to everyone who made and sent their Danjon scale estimate of the totally-eclipsed Moon’s brightness to Dr. Richard Keen, University of Colorado atmospheric scientist. Your data were crucial to his study of how aerosols in Earth’s atmosphere and other factors influence the Moon’s appearance.

Grateful for your help, Keen received a total of 28 observations from 7 different countries.

Graphs created by Dr. Richard Keen plotting Danjon L values submitted by Universe Today readers and others that compare expected values (top curve) with observed values. The Moon was about half as bright during totality as expected with L=1.9. Credit: Dr. Richard A. Keen
Graph created by Dr. Richard Keen plotting Danjon L values submitted by Universe Today readers and others that compare predicted values (top curve) with observed values. The Moon was about half as bright during totality as expected with L=1.9. Credit: Dr. Richard A. Keen

Using the Danjon information and estimates of the Moon’s brightness using the reverse binocular method, Keen crunched the data and concluded that the Moon was about 0.6 L (Danjon) units darker than expected and 0.4 magnitude dimmer, a brightness reduction of 33%. This agrees well with my own observation and possibly yours, too. No wonder so many stars sparkled near the Moon that night.

Depending on how clear the atmosphere is, the Moon's color can vary dramatically from one eclipse to another. The numbers, called the Danjon Scale, will help you estimate the color of Sunday night's eclipse. Credit: Bob King
Lunar eclipse brightness is rated on the Danjon scale where “0” equals a dark gray totality and “4” a bright, coppery yellow. Credit: Bob King

I think it’s safe to say, most of us expected a normal or even bright totality. So why was it dark? Several factors were at play — one to do with the Moon’s location in Earth’s shadow, the other with a volcanic eruption and a third with long-term, manmade pollution.

During a perigee eclipse, the moon passes more deeply into Earth’s shadow compared to one that happens near apogee, when the moon is most distant from Earth. Moon distances not to scale and for illustration only. Credit: Bob King
During a perigean eclipse, the Moon passes more deeply into Earth’s shadow compared to one that happens near apogee, when the moon is most distant from Earth. Moon distances not to scale and for illustration only. Credit: Bob King

You’ll recall that the eclipse occurred during lunar perigee, when the Moon swings closest to Earth in its 27-day orbit. Being closer, it also tracked deeper into Earth’s umbra or inner shadow which narrows the farther back of the planet it goes. An apogean Moon (farthest from Earth) passes through a more tapered cone of darkness closer to the penumbra, where sunlight mixes with shadow. A Moon nearer Earth would find the umbral shadow roomier with the light-leaking penumbra further off in the distance.

Around midday on April 24, 2015, the Moderate Resolution Imaging Spectroradiometer (MODIS) on NASA’s Terra satellite acquired this natural-color image of the ash and gas plume from Calbuco volcano in southern Chile. Credit: NASA
On April 24, 2015, NASA’s Terra satellite acquired this photo of the ash and gas plume from Calbuco volcano in southern Chile. Credit: NASA

But there’s more. Working independently, Steve Albers of NOAA and Brazilian astronomer Helio Vital suggested another reason: aerosols in the atmosphere. “Earth’s stratosphere is no longer completely clean of volcanic ashes,” said Vital in an e-mail communication. “In fact, lingering aerosols (ash, dust, sulfuric acid droplets) from the explosion of Calbuco five months ago may be to blame for that excessive darkening.”

With the lunar horizon in the foreground, the Earth passes in front of the Sun on September 27, 2015 in this simulation, revealing the red ring of sunrises and sunsets along the limb of the planet responsible for illuminating the Moon during the eclipse. The clarity of the stratosphere at eclipse time can greatly affect lunar brightness during totality. The Earth and Sun are in Virgo for observers on the Moon with the bright star Beta Virginis at top. Click to see the video. Credit: NASA's Scientific Visualization Studio
With the lunar horizon in the foreground, the Earth passes in front of the Sun on September 27, 2015 in this simulation, revealing the red ring of sunrises and sunsets along the limb of the planet responsible for illuminating the Moon during the eclipse. The clarity of the stratosphere at eclipse time can greatly affect lunar brightness during totality. The Earth and Sun are in Virgo for observers on the Moon with the bright star Beta Virginis at top. Click to see the video. Credit: NASA’s Scientific Visualization Studio

While much of the debris blasted into the stratosphere made for colorful sunsets in the southern hemisphere, some of that material has likely made its way to the northern hemisphere. Albers has noticed an increase in yellow and purple sunsets in his home town of Boulder in recent months, telltale signs of volcanic spew at play.

Forest fires that raged across the western states and Canadian provinces all spring and summer may also have contributed. Most of that smoke usually stays in the lower part of the atmosphere, but some may have found its way to the stratosphere, the very layer responsible for transmitting most of the sunlight that falls into Earth’s shadow and colors the moon.

Graph showing magnitude estimates of the Moon's brightness during totality using the reverse binocular method. The predicted magnitude was -1.7 (a little brighter than Sirius) vs. the observed -1.3. Credit: Dr. Richard A. Keen
Graph showing magnitude estimates of the Moon’s brightness during totality using the reverse binocular method. The predicted magnitude was -1.7 (a little brighter than Sirius) vs. the observed -1.3. Credit: Dr. Richard A. Keen

Sunlight has to pass through these light-absorbing minerals and chemicals on its way through the atmosphere and into Earth’s shadow. Less light means a darker moon during total eclipse. Coincidentally, much of the totally eclipsed Moon passed through the southern half of the umbra which “increased the effectiveness of the Calbuco aerosols (which are still more concentrated in the southern hemisphere than the northern) at dimming the light within the umbra,” writes Keen.

Oceanus Procellarum and Mare Imbrium are large, dark volcanic plains that contributed to the Moon's faintness and dark-hued totality. Credit: Bob King
Oceanus Procellarum and Mare Imbrium are large, dark volcanic plains that contributed to the Moon’s faintness and dark-hued totality. Credit: Bob King

It also so happened that the darkest part of the moon coincided with two vast, dark volcanic plains called Oceanus Procellarum (Ocean of Storms) and Mare Imbrium, artificially enhancing the overall gloom over the northern half of the Moon.

U.S. satellite-derived map of PM2.5 averaged over 2001-2006. Credit: Dalhousie University, Aaron van Donkelaar
U.S. satellite-derived map of PM2.5 (fine particulate matter which includes sulfates and soot) averaged over 2001-2006. Credit: Dalhousie University, Aaron van Donkelaar

Finally, the human hand may also have played a role in lunar color and brightness. The burning of coal and oil has caused a gradual increase in the amount of human-made sulfate aerosols in the atmosphere since the start of the industrial revolution. According to NASA, at current production levels, human-made sulfate aerosols are believed to outweigh the naturally produced sulfate aerosols. No surprise that the concentration of aerosols is highest in the northern hemisphere where most industrial activity is found.

Isn’t it fascinating that one blood-red Moon can tell us so much about the air we breathe? Thank you again for your participation!

US Braces for Cat 4 Hurricane as ‘Joaquin’ Barrels to East Coast and ULA Readies 100th Launch on Oct. 2: Watch Live

NOAA's GOES-East satellite captured this visible image of Hurricane Joaquin affecting the Bahamas on Thursday, Oct. 1 at 1255 UTC. Credits: NASA/NOAA GOES Project

Video caption: This animation of images captured from September 29 to October 1, 2015 from NOAA’s GOES-East satellite shows Hurricane Joaquin become a major hurricane in the Bahamas. Credits: NASA/NOAA GOES Project

NEW JERSEY – A wide swath of the US East Coast is bracing for impact in the coming days as ‘Hurricane Joaquin’ strengthened to a major and dangerous Category 4 storm, today, Thursday, Oct. 1, as NASA and NOAA satellites keep constant watch as it barrels potentially towards tens of millions of coastal residents.

Joaquin is already packing winds exceeding 130 mph with even higher wind gusts as the storm continues to strengthen at this hour and the pressure is decreasing. See the latest Hurricane Joaquin animation and imagery from NASA and NOAA, above and below.

Meanwhile amidst the hurricane watch, launch preparations are underway by United Launch Alliance (ULA) for the firms 100th rocket blastoff on Friday morning, Oct. 2 from Cape Canaveral Air Force Station in Florida with an Atlas V booster as Joaquin nears the US eastern seaboard.

A ULA Atlas V is slated to lift off Friday from Cape Canaveral Air Force Station in Florida at 6:08 a.m. EDT with the Morelos-3 communications satellite for Mexico, before the hurricane gets closer to Florida.

The National Hurricane Center declared Joaquin had intensified into a massive Category 4 hurricane on the Saffir-Simpson Wind Scale, as of 2 PM EDT today, Oct. 1.

You can watch the launch on ULA’s live webcast starting at 5:48 a.m. Oct 2: http://www.ulalaunch.com

The governors of three states – New Jersey, Virginia and North Carolina – have already declared ‘States of Emergency’ in anticipation of potentially destructive winds, potentially life threatening drenching rains and floods, downed power lines and ocean rip currents with high waves in local areas.

Multiple NASA and NOAA satellites are intensively and continuously observing Joaquin, and are providing absolutely critical data to forecasters and government officials with the most current and best information available.

NASA’s GPM, Terra and NPP-Suomi satellites and NOAA’s GOES-East satellite are tracking Joaquin and have seen powerful thunderstorms today which indicates continued strengthening.

At this time we still don’t whether the US eastern seaboard will suffer a major hit but officials are taking no chances after suffering through Superstorm Sandy which caused many deaths, widespread power outages and billions and billions of dollars of damage – from which we are still recovering.

Joaquin is currently over The Bahamas in the Caribbean and is expected to make a sharp right turn on Friday Oct 2 and head northwards to the east coast and the Atlantic Ocean. It could start impacting the Carolinas and regions further north as soon as Sunday, Oct. 4, based on current forecasts, and drop double digits inches of torrential rainfall.

NASA-NOAA's Suomi NPP satellite passed over Joaquin at 06:10 UTC (2:10 a.m. EDT) on Oct. 1 as it was strengthening from a Category 2 to a Category 3 hurricane. It’s now a Category 4. Imagery showed cloud top temperatures colder than -63F/-53C (yellow).  Credits: NRL/NASA/NOAA
NASA-NOAA’s Suomi NPP satellite passed over Joaquin at 06:10 UTC (2:10 a.m. EDT) on Oct. 1 as it was strengthening from a Category 2 to a Category 3 hurricane. It’s now a Category 4. Imagery showed cloud top temperatures colder than -63F/-53C (yellow). Credits: NRL/NASA/NOAA

Its pounding the Bahamas right now and is creating a disaster with hurricane force winds and heavy rainfall, say weather forecasters, as it remains over the island for some 24 hours or more and may drop over 10 inches of rain.

But there is a very wide cone of uncertainly of where it could hit as the possible storm track extends from the Carolinas to Maine. It may or may not directly impact the eastern US. The storm may shift to the right and spare the east coast. But no one knows at this time.

Some areas on the US East coast stretching from Virginia to Maine have already suffered from torrential rains and severe flooding from an unrelated storm the past few days and also right now today, Thursday.

So the grounds are already saturated in parts of the Carolina’s, Virginia, Maine and elsewhere.

NASA/JAXA's GPM satellite provided a 3-D side view of Tropical Storm Joaquin on Sept. 29 showing the internal precipitation structure. The areas in blue are frozen precipitation. Areas in green and red are liquid precipitation.  Credits: Scientific Visualization Studio, NASA’s Goddard Space Flight Center
NASA/JAXA’s GPM satellite provided a 3-D side view of Tropical Storm Joaquin on Sept. 29 showing the internal precipitation structure. The areas in blue are frozen precipitation. Areas in green and red are liquid precipitation. Credits: Scientific Visualization Studio, NASA’s Goddard Space Flight Center

Coastal flood warnings and watches are already in effect in many areas along the eastern seaboard where local areas could be drenched by some 12 to 18 inches of additional rain which could fall even before the hurricane hits.

Significant beach erosion has already occurred in the Carolinas over the past few days and more is expected up and down the entire coast up to Maine.

And 10 foot high defense berms of sand are being constructed at this moment along miles and miles of the Jersey Shore – areas that suffered devastating damage from Superstorm Sandy.

There is a potential risk of deadly flooding, flash flooding and damage to houses, buildings, businesses, roadways and infrastructure.

“At 2 p.m. EDT (1800 UTC), the center of Hurricane Joaquin was located near latitude 23.0 North, longitude 74.2 West. Joaquin was moving generally southwestward at about 6 mph (9 kph), and the National Hurricane Center forecast a turn toward the northwest and north on Friday, Oct. 2. On the forecast track, the center of Joaquin will move near or over portions of the central Bahamas today and tonight and pass near or over portions of the northwestern Bahamas on Friday, Oct. 2,” according to NASAs Rob Gutro.

The weather forecast for Friday’s launch from Cape Canaveral , Florida is currently 70 percent GO for liftoff of the United Launch Alliance Atlas V rocket at 6:08 a.m. EDT. The Atlas V will launch with the Morelos-3 mission for Mexico’s Secretaria de Comunicaciones y Transportes (Ministry of Communications and Transportation).

Morelos-3 will be part of the Mexsat constellation of satellites that delivers advanced telecommunications throughout Mexico.

United Launch Alliance Atlas V rocket after rollout to Pad 41 at Cape Canaveral Air Force Station, Florida for planned Oct. 2 launch at 6:08 a.m. EDT with the Morelos-3 mission for Mexico’s Ministry of Communications and Transportation.  In progress assembly of the commercial crew access tower is seen at right, now under construction for the Boeing Starliner space taxi for astronaut crews launching to the ISS. Credit: Julian Leek
United Launch Alliance Atlas V rocket after rollout to Pad 41 at Cape Canaveral Air Force Station, Florida for planned Oct. 2 launch at 6:08 a.m. EDT with the Morelos-3 mission for Mexico’s Ministry of Communications and Transportation. In progress assembly of the commercial crew access tower is seen at right, now under construction for the Boeing Starliner space taxi for astronaut crews launching to the ISS. Credit: Julian Leek

Stay tuned here for Ken’s continuing Earth and planetary science and human spaceflight news.

Ken Kremer

United Launch Alliance Atlas V rocket during rollout to Space Launch Complex-41 at Cape Canaveral Air Force Station, Florida on Oct. 1 for planned Oct. 2 launch at 6:08 a.m. EDT with the Morelos-3 mission for Mexico’s Ministry of Communications and Transportation.  Credit: Julian Leek
United Launch Alliance Atlas V rocket during rollout to Space Launch Complex-41 at Cape Canaveral Air Force Station, Florida on Oct. 1 for planned Oct. 2 launch at 6:08 a.m. EDT with the Morelos-3 mission for Mexico’s Ministry of Communications and Transportation. Credit: Julian Leek

Firefly Astronomy

Image credit and copyright:

Light makes life, and sometimes, life returns the favor. There’s nothing more magical than watching fireflies flit across a starlit field on a summer’s night. Growing up in Northern Maine, summer was an all-too swiftly passing season, and fireflies had to put on their displays in a brief profusion of frenzied activity around late July and early August before the weather turned once again towards another long harsh winter.

Fireflies remind us of the ephemeral nature of existence, that’s for sure. And they’re much more welcome by summertime campers on vigil for the August Perseids than oh, say the ubiquitous mosquito or vicious black flies

A recent amazing capture (see the intro image) came to us courtesy of Steed Yu. Shooting from the shores of Lake Natron in Tanzania, he managed to capture an amazing composition of fireflies and those ‘fireflies of the cosmos,’ in the form of a star-dappled southern hemisphere sky.

Taken on February 24th 2015 just south of the equator, this is simply an amazing image. Don’t forget, though it’s towards the end winter time up here in the northern hemisphere in late February, it’s the tail end of the summer south of the equator.

The photographer had this to say about his ‘Carnival of Fireflies’:

The Night of Lake Natron belongs to the stars. Without any artificial light disturbing the pure sky, one can easily see the Southern Milky Way, as well as sparkling starlights scattered in it, such as the most distinctive constellation Southern Cross and our nearest stellar neighbours Alpha Centauri. The Night of Lake Natron belongs to the firefly too. These glowing elves were flying up and down among the lush grass on both sides of a ravine stream, like a flowing “Firefly Way”, as if to contest with the Milky Way. On the quiet starry night, the fireflies held a grand carnival.

Fireflies shine through a method known as bioluminescence, producing a cold light via a chemical process using the chemical luciferin that causes their abdomen to glow. This aids mating and mate selection, and even firefly larvae have been known to glow. Other deep sea and cave-dwelling species of fish and insects have been known to use a similar signaling method in the absence of ambient light.

You can see the stars of the southern Milky Way and the Southern Cross high above the African night shining in their own particular fashion via nuclear fusion, using the proton-proton chain reaction to shed their ancient photons of light onto the nighttime scene from beyond the cold dust lanes of the Coal Sack.

We’ve managed to observe the sky from the southern hemisphere five times from three different continents over the years, and can attest that all of the ‘good stuff’ is in the southern sky, where the core of our home Milky Way galaxy arcs high overhead.

Such ‘Firefly Time-lapse Astronomy’ is as easy as parking a DSLR with a wide-field of view lens on a tripod and shooting 10-60 second time exposures. Fellow Universe Today writer Bob King wrote a piece last year on his firefly astronomy adventures.

And check out this amazing video sequence by Vincent Brady taken in the summer of 2013 from Lake of the Ozarks, Missouri:

Humans have also mastered the art of creating light and luminescence via technology as well. This has served as a way to ‘push back the night,’ and our 24 hour civilization has come to rely on this mimicry of nature as we demonstrate our prowess at illumination.  This often has a cost, however, as we banish the beauty of the night sky to a distant memory. We’ve also had the dubious pleasure of observing and conducting impromptu sidewalk star parties from downtown Tampa and the Las Vegas strip, arguably some of the most light-polluted locales in the world. On such nights, only the Moon, planets and perhaps the odd bright double stars are the only viable targets.

Image credit:
Even in light pollution conscious Flagstaff, Arizona, the problem persists. Image credit: Dave Dickinson

But all is not lost. Perhaps wasteful light pollution is only an adolescent phase that civilizations go through. One SETI search strategy has even suggested that we may be able to detect ET via light pollution from alien cities on the night side of prospective planets … perhaps some race of ‘intelligent fireflies’ straight out of science fiction will use bio-chemical signaling for communication?

Image credit
Humans creating light (OK laser pointer penmanship isn’t our strong suit!) Image credit: Dave Dickinson

All great thoughts to ponder on the star-filled summer nights ahead, as fireflies swarm around us. We move that if we ever become an interstellar species that we bring the noble firefly along for the ride… but please, let’s leave light pollution and mosquitoes behind.

Space Weather Storm Monitoring Satellite Blasts off for Deep Space on SpaceX Rocket

NOAA's DSCOVR satellite launches from Cape Canaveral Air Force Station on Feb. 11, 2015. DSCOVR will provide NOAA space weather forecasters more reliable measurements of solar wind conditions, improving their ability to monitor potentially harmful solar activity. Credit: Alan Walters/AmericaSpace

After a 17 year long wait, a new American mission to monitor intense solar storms and warn of impeding space weather disruptions to vital power grids, telecommunications satellites and public infrastructure was launched atop a SpaceX Falcon 9 on Wednesday, Feb. 11, from Cape Canaveral, Florida, to start a million mile journey to its deep space observation post.

The third time proved to be the charm when the Deep Space Climate Observatory, or DSCOVR science satellite lifted off at 6:03 p.m. EST Wednesday from Space Launch Complex 40 at Cape Canaveral Air Force Station in Florida.

The spectacular sunset blastoff came after two scrubs this week forced by a technical problem with the Air Force tracking radar and adverse weather on Sunday and Tuesday.

The $340 million DSCOVR has a critical mission to monitor the solar wind and aid very important forecasts of space weather at Earth at an observation point nearly a million miles from Earth. It will also take full disk color images of the sunlit side of Earth at least six times per day that will be publicly available and “wow” viewers.

Launch of NOAA DSCOVR satellite from Cape Canaveral Air Force Station on Feb. 11, 2015 to monitor solar storms and space weather.   Credit:  Julian Leek
Launch of NOAA DSCOVR satellite from Cape Canaveral Air Force Station on Feb. 11, 2015 to monitor solar storms and space weather. Credit: Julian Leek

The couch sized probe was targeted to the L1 Lagrange Point, a neutral gravity point that lies on the direct line between Earth and the sun located 1.5 million kilometers (932,000 miles) sunward from Earth. At L1 the gravity between the sun and Earth is perfectly balanced and the satellite will orbit about that spot just like a planet.

L1 is a perfect place for the science because it lies outside Earth’s magnetic environment. The probe will measure the constant stream of solar wind particles from the sun as they pass by.

The DSCOVR spacecraft (3-axis stabilized, 570 kg) will be delivered to the Sun-Earth L1 point, 1.5 million km (1 million miles) from the Earth, directly in front of the Sun. A Halo (Lissajous) orbit will stabilize the craft's position around the L1 point while keeping it outside the radio noise emanating from the Sun. (Illustratin Credit: NASA)
The DSCOVR spacecraft (3-axis stabilized, 570 kg) will be delivered to the Sun-Earth L1 point, 1.5 million km (1 million miles) from the Earth, directly in front of the Sun. A Halo (Lissajous) orbit will stabilize the craft’s position around the L1 point while keeping it outside the radio noise emanating from the Sun. (Illustratin Credit: NASA)

DSCOVR is a joint mission between NOAA, NASA, and the U.S Air Force (USAF) that will be managed by NOAA. The satellite and science instruments are provided by NASA and NOAA. The rocket was funded by the USAF.

The mission is vital because its solar wind observations are crucial to maintaining accurate space weather forecasts to protect US infrastructure such as power grids, aviation, planes in flight, all types of Earth orbiting satellites for civilian and military needs, telecommunications, ISS astronauts and GPS systems.

It will take about 150 days to reach the L1 point and complete satellite and instrument checkouts.

DSCOVR will then become the first operational space weather mission to deep space and function as America’s primary warning system for solar magnetic storms.

It will replace NASA’s aging Advanced Composition Explorer (ACE) satellite which is nearly 20 years old and far beyond its original design lifetime.

“DSCOVR is the latest example of how NASA and NOAA work together to leverage the vantage point of space to both understand the science of space weather and provide direct practical benefits to us here on Earth,” said John Grunsfeld, associate administrator of NASA’s Science Mission Directorate in Washington.

DSCOVR was first proposed in 1998 by then US Vice President Al Gore as the low cost ‘Triana’ satellite to take near continuous views of the Earth’s entire globe to feed to the internet as a means of motivating students to study math and science. It was eventually built as a much more capable Earth science satellite that would also conduct the space weather observations.

But Triana was shelved for purely partisan political reasons and the satellite was placed into storage at NASA Goddard and the science was lost until now.

DSCOVR mission logo.  Credit: NOAA/NASA/U.S. Air Force
DSCOVR mission logo. Credit: NOAA/NASA/U.S. Air Force

DSCOVR is equipped with a suite of four continuously operating solar science and Earth science instruments from NASA and NOAA.

It will make simultaneous scientific observations of the solar wind and the entire sunlit side of Earth.

The 750-kilogram (1250 pound) DSCOVR probe measures 54 inches by 72 inches.

Technician works on NASA Earth science instruments and Earth imaging EPIC camera (white circle) housed on NOAA/NASA Deep Space Climate Observatory (DSCOVR) inside NASA Goddard Space Flight Center clean room in November 2014.  Credit: Ken Kremer/kenkremer.com/AmericaSpace
Technician works on NASA Earth science instruments and Earth imaging EPIC camera (white circle) housed on NOAA/NASA Deep Space Climate Observatory (DSCOVR) inside NASA Goddard Space Flight Center clean room in November 2014. Credit: Ken Kremer/kenkremer.com/AmericaSpace

The two Earth science instruments from NASA are the Earth Polychromatic Imaging Camera (EPIC) and the National Institute of Standards and Technology Advanced Radiometer (NISTAR).

EPIC will provide true color spectral images of the entire sunlit face of Earth at least six times per day, as viewed from an orbit around L1. They will be publically available within 24 hours via NASA Langley.

It will view the full disk of the entire sunlit Earth from sunrise to sunset and collect a variety of science measurements including on ozone, aerosols, dust and volcanic ash, vegetation properties, cloud heights and more.

Listen to my post launch interview with the BBC about DSCOVR and ESA’s successful IXV launch on Feb. 11.

A secondary objective by SpaceX to recover the Falcon 9 first stage booster on an ocean going barge had to be skipped due to very poor weather and very high waves in the Atlantic Ocean making a safe landing impossible. The stage did successfully complete a soft landing in the ocean.

Stay tuned here for Ken’s continuing Earth and planetary science and human spaceflight news.

Ken Kremer

NOAA/NASA Deep Space Climate Observatory (DSCOVR) undergoes processing in NASA Goddard Space Flight Center clean room. Solar wind instruments at right. DSCOVER will launch in February 2015 atop SpaceX Falcon 9 rocket.  Credit: Ken Kremer/kenkremer.com/AmericaSpace
NOAA/NASA Deep Space Climate Observatory (DSCOVR) undergoes processing in NASA Goddard Space Flight Center clean room. Solar wind instruments at right. DSCOVER will launch in February 2015 atop SpaceX Falcon 9 rocket. Credit: Ken Kremer/kenkremer.com/AmericaSpace
Launch of NOAA DSCOVR satellite from Cape Canaveral Air Force Station on Feb. 11, 2015 to monitor solar storms and space weather.   Credit:  John Studwell
Launch of NOAA DSCOVR satellite from Cape Canaveral Air Force Station on Feb. 11, 2015 to monitor solar storms and space weather. Credit: John Studwell
Prelaunch view of SpaceX rocket on Cape Canaveral launch pad taken from LC-39 at the Kennedy Space Center.  Credit: Chuck Higgins
Prelaunch view of SpaceX rocket on Cape Canaveral launch pad taken from LC-39 at the Kennedy Space Center. Credit: Chuck Higgins

Amazing Pictures of the Underside of an Iceberg

This stunning glacial portrait was photographed in Cierva Cove, Antarctica. An incredibly rare sight--this photo reveals the beautiful colors and pure surface of the underside of an iceberg. Credit and copyright: Alex Cornell.

In December 2014, designer and musician Alex Cornell traveled to Antarctica. While he saw many unique views of the Antarctic landscape, one extremely rare view stands out. He saw an iceberg that had recently flipped over, exposing the usually unseen – but gorgeous — underside.

“Icebergs are typically white, like you see in pictures,” Cornell told Universe Today. “But this one had recently flipped over and had this arresting alien-green color to it. It looked a lot more like a parked spacecraft than a floating iceberg.”

He said the experience was “magical.”

This stunning glacial portrait was photographed in Cierva Cove, Antarctica. An incredibly rare sight--this photo reveals the beautiful colors and pure surface of the underside of an iceberg. Credit and copyright: Alex Cornell.
This stunning glacial portrait was photographed in Cierva Cove, Antarctica. An incredibly rare sight–this photo reveals the beautiful colors and pure surface of the underside of an iceberg. Credit and copyright: Alex Cornell.

He traveled with family members and brought his camera rig, hoping to shoot the glaciers, ice and penguins.

“We saw thousands of icebergs of course, but only one revealed its gorgeous underside — the 90% ‘below the surface’ you hear so much about,” he said.

Scientists say that icebergs will flip over when the “topside” melts enough to change the shape of the iceberg, creating a shift in equilibrium.

Why is the underside so different in color?

Ice is full of tiny air bubbles that scatter all color wavelengths the same amount, usually giving the ice a white appearance. But, according to scientists at Ohio State University, if the ice is compressed – as it would be for the underwater portion of the iceberg — the bubbles are squeezed out and the blue light is scattered much more than other colors – making the ice appear blue. Also, algae often grow on the underside of icebergs, producing green stripes that are only revealed when the ice rolls over and exposes the previously underwater sections.

A zoomed out version of a flipped iceberg in Cierva Cove, Antarctica. Credit and copyright: Alex Cornell.

“I shot these pictures from a Zodiac (boat) which allowed me to get pretty close,” Cornell said via email. “There’s always a danger of the iceberg flipping back over, so we couldn’t get *too* close.”

“From an artistic perspective, they are beautiful photos, but their beauty is the result of what was captured. I was just lucky to be there to snap it. You could have pointed an iPhone at this thing and come away with something spectacular. What luck to get to share something so magical!”

Thanks to Alex for sharing his unique images with Universe Today. See more of his wonderful imagery from his Antarctica trip on his website.

A Sun halo seen among the the landscape and ice flows of Antarctica. Credit and copyright: Alex Cornell.

NASA Launches Revolutionary Earth Science Satellite Measuring Soil Moisture Cycle

NASA's Soil Moisture Active Passive (SMAP) observatory, on a United Launch Alliance Delta II rocket, is seen after the mobile service tower was rolled back Friday, Jan. 30 at Space Launch Complex 2, Vandenberg Air Force Base, Calif. Image Credit: NASA/Bill Ingalls

NASA’s Soil Moisture Active Passive (SMAP) observatory, on a United Launch Alliance Delta II rocket, is seen after the mobile service tower was rolled back Friday, Jan. 30 at Space Launch Complex 2, Vandenberg Air Force Base, Calif.
Image Credit: NASA/Bill Ingalls
Story updated[/caption]

At dawn this morning (Jan. 31) NASA launched an advanced Earth science satellite aimed at making measurements of our planet’s surface soil moisture and freeze/thaw states from space that will revolutionize our understanding of the water, energy, and carbon cycles driving all life on Earth, aid weather forecasting and improve climate change models.

NASA’s new Soil Moisture Active Passive (SMAP) observatory thundered off the pad at 6:22 a.m. PST (9:22 a.m. EST) Saturday atop a two stage United Launch Alliance Delta II rocket from Space Launch Complex 2 on Vandenberg Air Force Base, California.

The $916 million satellite successfully separated from the rocket’s second stage some 57 minutes after the flawless liftoff and was injected into an initial 411- by 425-mile (661- by 685-kilometer) orbit. The spacecraft then deployed its solar arrays and telemetry indicated it was in excellent health.

“We’re in contact with SMAP and everything looks good right now,” NASA Launch Manager Tim Dunn said.

“Deployment of the solar arrays is underway. We just couldn’t be happier.”

SMAP separated from the second stage while pointed toward the sun as seen in the video below from a rocket mounted camera:

Video Caption: A camera on the second stage of the Delta II rocket captured this footage as the SMAP spacecraft pushed itself away from the rocket to complete the delivery of the Earth-observing spacecraft to its proper orbit following Jan. 31, 2015 liftoff. Credit: NASA TV/ULA

SMAP is NASA’s 1st Earth observing satellite designed to make high resolution global observations of Earth’s vital surface soil moisture content and freeze/thaw cycle just below your feet. It will aid global forecasting and have broad applications for science and society.

SMAP’s combined radar and radiometer instruments will peer into the top 2 inches (5 centimeters) of soil, through clouds and moderate vegetation cover, day and night, to produce the highest-resolution, most accurate soil moisture maps ever obtained from space, says NASA.

The blastoff of SMAP successfully concluded NASA’s ambitious plans to launch a record breaking total of five Earth science satellites in less than a year’s time.

“The launch of SMAP completes an ambitious 11-month period for NASA that has seen the launch of five new Earth-observing space missions to help us better understand our changing planet,” said NASA Administrator Charles Bolden.

“Scientists and policymakers will use SMAP data to track water movement around our planet and make more informed decisions in critical areas like agriculture and water resources.”

Artist's rendering of the Soil Moisture Active Passive satellite. The width of the region scanned on Earth’s surface during each orbit is about 620 miles (1,000 kilometers).  Image credit: NASA/JPL-Caltech
Artist’s rendering of the Soil Moisture Active Passive satellite. The width of the region scanned on Earth’s surface during each orbit is about 620 miles (1,000 kilometers). Image credit: NASA/JPL-Caltech

SMAP is projected to last for at least a three year primary mission.

The prior NASA Earth science instrument launched was the Cloud Aerosol Transport System (CATS) payload hauled to space by the SpaceX CRS-4 Dragon on Jan. 10, 2015 and recently installed on the exterior of the ISS. Read my CATS installation story – here.

The three earlier NASA Earth science missions launched over the past year included ISS-RapidScat in September 2014, the Global Precipitation Measurement (GPM) Core Observatory, a joint mission with the Japan Aerospace Exploration Agency, in February 2014, and the Orbiting Carbon Observatory-2 (OCO-2) carbon observatory in July 2014.

“Congratulations to the NASA Launch Services Program team, JPL and all of our mission partners on today’s successful launch of the SMAP satellite,” said Jim Sponnick, ULA vice president, Atlas and Delta Programs.

“It is our honor to launch this important Earth science mission to help scientists observe and predict natural hazards, and improve our understanding of Earth’s water, energy and carbon cycles.”

SMAP will provide high-resolution, space-based measurements of soil moisture and its state — frozen or thawed — a new capability that will allow scientists to better predict natural hazards of extreme weather, climate change, floods and droughts, and help reduce uncertainties in our understanding of Earth’s water, energy and carbon cycles, according to a NASA description.

The mission will map the entire globe every two to three days for at least three years and provide the most accurate and highest-resolution maps of soil moisture ever obtained. The spacecraft’s final circular polar orbit will be 426 miles (685 kilometers), at an inclination of 98.1 degrees. The spacecraft will orbit Earth once every 98.5 minutes and repeat the same ground track every eight days.

“All subsystems are being powered on and checked out as planned,” Kent Kellogg, the SMAP project manager, during a post-launch press conference.

“Communications, guidance and control, computers and power are all operating nominally.”

The observatory is in excellent health. Its instruments will be turned on in 11 days.

Today’s blastoff of SMAP marks ULA’s second successful launch this month as well as the second of 13 planned for 2015. ULA’s first launch of 2015 was MUOS-3 from Cape Canaveral on Jan. 20.

ULA’s next launch involves NASA’s Magnetospheric Multiscale Mission (MMS) to study Earth’s magnetic reconnection. It is scheduled for launch on an Atlas V 421 booster on March 12 from Cape Canaveral. See my up close visit with MMS and NASA Administrator Charles Bolden at NASA Goddard Space Flight Center detailed in my story – here.

Stay tuned here for Ken’s continuing Earth and planetary science and human spaceflight news.

Ken Kremer

Holiday Lights So Bright You Can See ’em from Space

Christmas lighting displays like this one near Duluth, Minn. U.S. are visible from outer space. Credit: Bob King

Call it holiday light creep. A NASA satellite has been tracking the spread of Christmas lighting from 512 miles up for the past three years and according to the data, nighttime lights around many major U.S. cities shine 20 to 50 percent brighter during Christmas and New Year’s when compared to light output during the rest of the year. Not surprisingly, most it comes from suburban areas.

Christmas isn’t the only time holiday festivities spill into the cosmic night. In some Middle Eastern Cities nighttime lights shine more than 50 percent brighter during Ramadan than the rest of the year. Because snow reflects so much light, the researchers could only analyze snow-free cities lest they risk comparing apples to oranges. The team focused on the U.S. West Coast from San Francisco to Los Angeles and on cities south of a rough line from St. Louis to Washington, D.C.

The map compares the nighttime light signals from December 2012 and 2013 to the average light output for the rest of 2012 to 2014 in and around several large cities in Texas. Dark green shadings indicates increased lighting in December, primarily from outdoor holiday lights. Credit: NASA’s Earth Observatory/Jesse Allen

As someone who has spent many winter nights observing I can attest to snow being a major factor in nighttime sky brightness. Even downward shielded lighting must necessarily reflect upward and into the heavens when it strikes the snow below. Summer is a far darker time of year than winter across much of the northern U.S.

Close-ups of three cities using the Suomi-NPP satellite. Credit: NASA/
Close-ups of three cities using the Suomi-NPP satellite data. Dark green pixels are areas where the lights are 50 percent brighter. Credit: NASA’s Earth Observatory/Jesse Allen

The orbital images were all taken by the Suomi NPP satellite, a joint NASA/National Oceanic and Atmospheric Administration mission, carries an instrument called the Visible Infrared Imaging Radiometer Suite (VIIRS) that detects light in a range of wavelengths from green to near-infrared as it flies over at roughly 1:30 a.m. and 1:30 p.m. each day. VIIRS has a low-light sensor that can distinguish night lights tens to hundreds of times better than previous satellites. In the U.S. the lights starting getting brighter the day after Thanksgiving and continued through News Year’s Day. Miguel Román, a scientist at NASA’s Goddard Space Flight Center and member of the Suomi NPP Land Discipline Team, made the discovery while researching urban energy use patterns in the context of greenhouse emissions. And you thought all those twinkly bulbs were just for fun.


NASA Sees Holiday Lights from Space

The science team found that light intensity increased by 30 to 50 percent in the suburbs and outskirts of major cities. Lights in the central urban areas didn’t increase as much as in the suburbs, but still brightened by 20 to 30 percent. This makes sense when you consider that folks in the ‘burbs not only decorate their homes but often extend Christmas displays across the yard and up into the trees.

In several cities in the Middle East, city lights brighten during the Muslim holy month of Ramadan, as seen using a new analysis of daily data from the NASA-NOAA Suomi NPP satellite. Dark green pixels are areas where the lights are 50 percent brighter, or more, during Ramadan. Image Credit: NASA's Earth Observatory/Jesse Allen
In several cities in the Middle East, city lights brighten during the Muslim holy month of Ramadan, as seen using a new analysis of daily data from the NASA-NOAA Suomi NPP satellite. Dark green pixels are areas where the lights are 50 percent brighter, or more, during Ramadan. Credit: NASA’s Earth Observatory/Jesse Allen

Holiday lighting – a simple joy of the season. Yet it reflects both the hopes and wishes of human culture and the mundane facts of energy use. Through satellites, we can step back and watch the world change in ways never thought possible.  We truly live in the Age of the Anthopocene, a newly designated era reflecting the profound effect our species has had and continues to have on the planet. To see all the holiday space photos, check out Goddard’s Flickr page.

An overhead view of the Eastern U.S. Click for a Flick page showing all U.S. cities in the survey. Credit:
An overhead view of the Eastern U.S. Click for a Flick page showing all U.S. cities in the survey. Credit: NASA’s Earth Observatory / Jesse Allen

Low On Fuel, Rainfall Satellite Slowly Spirals To Its Death In 2016

Artist's conception of the Tropical Rainfall Measuring Mission (TRMM) satellite in space over a cyclone. Credit: NASA

After 17 years of faithful service, the end is in sight for the Tropical Rainfall Measuring Mission (TRMM). The joint NASA-Japanese mission is out of fuel (except for a small reserve amount for emergencies) and beginning its slow descent back to Earth.

From that fall, the satellite is not going to recover. It’s expected to re-enter the atmosphere and be destroyed around November 2016. The satellite will be shut down around February 2016, depending on how much solar activity pumps up the atmosphere.

“TRMM has met and exceeded its original goal of advancing our understanding of the distribution of tropical rainfall and its relation to the global water and energy cycles,” stated Scott Braun, the mission’s project scientist at NASA’s Goddard Space Flight Center in Maryland.

The satellite was designed to operate at about 250 miles (400 kilometers), and will slowly fall untl it gets to around 75-93 miles (120-150 kilometers), where it will break up.

While there’s no longer enough fuel to keep it at its normal operating altitude, NASA emphasized the satellite will still function well enough to estimate rains, floods and cyclones during the descent. However, its microwave imager will be affected because the field of view changes as the satellite descends.

GPM lifts off on Feb. 27, EST (Feb. 28 JST) to begin its Earth-observing mission.  Credit: NASA/Bill Ingalls
GPM lifts off on Feb. 27, EST (Feb. 28 JST) to begin its Earth-observing mission. Credit: NASA/Bill Ingalls

NASA also pointed out that the successor satellite, the Global Precipitation Measurement (GPM) Core Observatory, is performing well since its launch on Feb. 27 this year.

“The GPM Core Observatory’s area of coverage extends beyond TRMM’s, covering the area from the Arctic Circle to the Antarctic Circle. While this means fewer observations of the tropics, it also means that GPM will be able to observe hurricanes, like Sandy in 2012, that travel north (or south) farther into the mid-latitudes,” NASA wrote.

“GPM will also be able to detect light rain and snowfall, a major source of available fresh water in some regions. The joint NASA/JAXA mission will study rain and snow around the world, joining with an international network of partner satellites to provide global precipitation datasets on half hourly and longer time scales.”

Source: NASA

Earth’s Ozone Under Attack Despite Banning Destructive Compound: Study

The ozone hole over Antarctica on Aug. 18, 2014. Purple and blue represent zones with the least ozone, while yellow and red show thicker areas. Data sources come from multiple NASA, European Space Agency and National Oceanic and Atmospheric Administration satellites. Credit: NASA

Some bad news in the fight to protect Earth’s ozone — one of the banned compounds that attacks this protective atmospheric layer is still being produced, somehow.

That compound is called carbon tetrachloride, which used to be common in fire extinguishers and dry cleaning. But those who have signed the Montreal Protocol in 1987 reported no new emissions between 2007 and 2012.

So how is it that new research found atmospheric emissions are persisting at 30% of peak production, even with no new emissions being reported?

“We are not supposed to be seeing this at all,” stated lead author Qing Liang, an atmospheric scientist at NASA’s Goddard Space Flight Center in Maryland. “It is now apparent there are either unidentified industrial leakages, large emissions from contaminated sites, or unknown CCl4 sources.”

The concentrations are still declining, but only by 1% a year instead of the expected 4%. Liang’s team used several sources to piece together data from their new study, including ground-based observation and NASA’s 3-D GEOS Chemistry Climate Model.

Their work found that CC14 is still being produced, somehow, and also stays in the atmosphere for about 40% longer than thought. They estimate worldwide emissions of about 39 kilotons per year.

The results were published late last month in Geophysical Research Letters.

Source: NASA