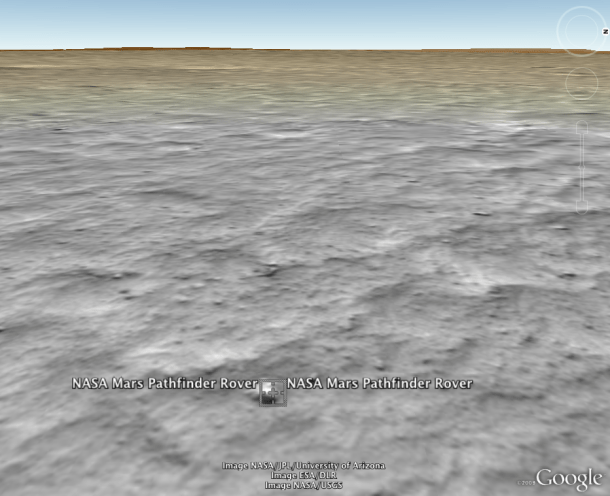
The Mars feature of Google Earth 5.0 lets users see the Red Planet from the perspective of Rovers like the NASA Mars Pathfinder Rover. (Credit: NASA/Google/JPL/University of Arizona)
[/caption]
Google Earth now allows you to probe the depths of Earth’s oceans as well as fly through the giant canyons or volcanoes on Mars. Google Earth 5.0 was unveiled today, with substantial upgrades for both the Earth and the Red Planet. Google worked in conjunction with NOAA and NASA to incorporate data from our undersea explorations and the spacecraft orbiting Mars. For the first time, you’ll be able to look at the two-thirds of our planet covered by the oceans, take a tour below sea level, and even look at historical imagery to see things like coastal erosion. On Mars there’s a rich conglomeration of images, including the most recent from the Mars Reconnaissance Orbiter to provide an immersive 3D view of Mars. Marine scientists say the electronic images will boost awareness and increase public support for marine conservation, while NASA says the new features in Google Mars will aid public understanding of Mars science, while also providing researchers a platform for sharing data similar to what Google Earth provides for Earth scientists.
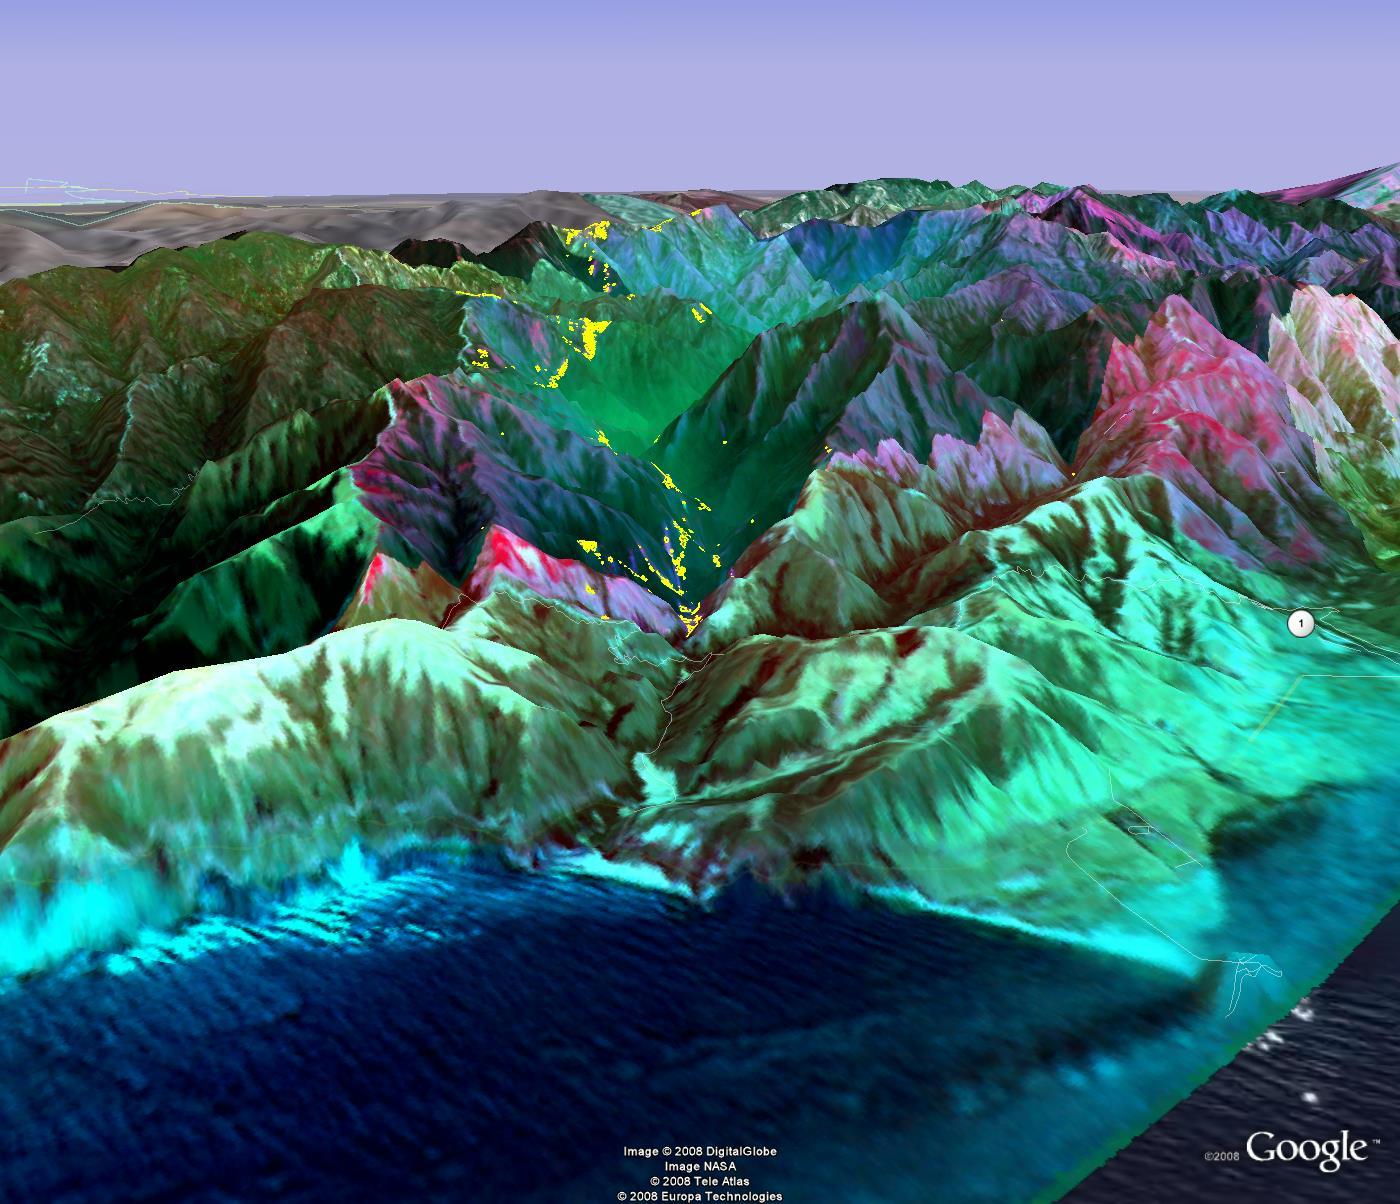
In Google Oceans, you can click a function called Touring and you can create narrated, illustrated tours, on land or above and below the sea surface, describing and showing things like a hike or scuba excursion, or even a research cruise on a deep-diving submarine. A view of the coast of Maui, outside Lanai City, Hawaii, from the new version of Google Earth.
By choosing among 20 buttons holding archives of information, called “layers” by Google, a visitor can read logs of oceanographic expeditions, see old film clips from the heyday of Jacques-Yves Cousteau and check daily Navy maps of sea temperatures.
While only 5% of the ocean floor is mapped in detail, the replicated seas have detailed topography reflecting what is known about the abyss and continental shelves with rougher areas where little is known.
On Mars, you can enjoy a high-resolution, three-dimensional view of the Red Planet.
There is a mode that enables users to fly virtually through enormous canyons and scale huge mountains on Mars that are much larger than any found on Earth. Users also can explore the Red Planet through the eyes of the Mars rovers and other Mars missions, providing a unique perspective of the entire planet.
Clickable links allow you to learn about new discoveries and explore indexes of available Mars imagery. If you’re into working with the raw images from the Mars rovers or orbiting spacecraft, the new Mars mode also allows users to add their own 3D content to the Mars map to share with the world.
Since 2005, Google Earth has been downloaded on half a billion computers, and visitors spend one million hours a day perusing Google Earth and the related Google Maps.
A new paper published by a leading researcher says many effects of climate change are already irreversible. Susan Solomon, a leader of the International Panel on Climate Change and a scientist with National Oceanic and Atmopheric Association (NOAA) said even if carbon emissions were stopped, temperatures around the globe will remain high until at least the year 3000. And if we continue with our current carbon dioxide emissions for just a few more decades, we could see permanent “dust bowl” conditions.
Solomon defined “irreversible” as change that would remain for 1,000 years even if humans stopped adding carbon to the atmosphere immediately. As carbon dioxide emissions rise, the planet will be undergo more and more long term environmental disruptions which will persist even if and when emission are brought under control.
The report says temperatures around the globe have risen and changes in rainfall patterns have been observed in areas around the Mediterranean, southern Africa and southwestern North America. Warmer climate also is causing expansion of the ocean, and that is expected to increase with the melting of ice on Greenland and Antarctica.
A recent NASA article said observations have confirmed rising temperatures in Antarctica over the past 50 years in not only the Antarctic Peninsula, but in western Antarctica as well.
In a teleconference, Soloman said this is not just another pollution problem. “We’re used to pollution problems being something we can fix, smog, — we can cut back and things will get better later. Or haze, we think it will go away pretty quickly.”
This is true for gases like methane and nitrous oxide, but not for CO2. “People have imagined that if we stopped emitting carbon dioxide that the climate would go back to normal in 100 years or 200 years,” said Solomon. “What we’re showing here is that’s not right. It’s essentially an irreversible change that will last for more than a thousand years.”
This is because the oceans are currently soaking up a lot of the planet’s excess heat, as well as some of the carbon dioxide from the atmosphere. The carbon dioxide and heat will eventually start coming out of the ocean. And that will take place for many hundreds of years.
The scientists say that once the global thermostat once it has been turned up, its extremely difficult to turn it back down.
Solomon said sea level rise is a much slower thing to happen, that it will take a long time, but we will lock into it based on the peak level of C02 we reach this century.
So, should we just give up? Are we doomed? “It seems like this is even more reason to do something about it,” Solomon said. “When you are committing to something you can’t back out of, you need to proceed even more carefully than when it’s something you can reverse….I don’t think that the very long time scale of the persistence of these effects has been understood.”
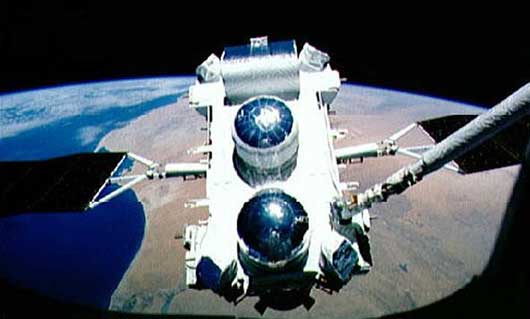
The Compton Gamma Ray Observatory shortly after deployment by shuttle Atlantis (STS-37) on April 5th, 1991 (NASA)
[/caption]From 1991 to 2000, the Compton Gamma Ray Observatory dominated the search for the largest explosions ever observed in the cosmos: gamma-ray bursts (or GRBs). Unfortunately after nearly a decade of highly successful observations, June 4th 2000, NASA made the unpopular decision to de-orbit the observatory in response to a mechanical failure on the spacecraft (despite protests by some scientists, pointing out that the observatory could have continued operations).
To one scientist, Jim Ryan, the demise of the project he had tirelessly worked on since 1984 was a hard pill to swallow. However, in a surprise turn of events, the US Department of Energy tracked down Ryan and asked whether his research could be applied a little closer to home. In a flash of inspiration, the scientist realised spare parts left over from the Compton Gamma Ray Observatory could be used to pinpoint emissions from a potential “dirty bomb”, possibly providing security services with an early warning capability against a radioactive terrorist attack…
Although a dirty bomb has never been detonated and remain a speculative means by terrorists to cause maximum disruption to a populated area, the Department of Energy considers the threat to be very real. This is probably because a small amount of radioactive material could be used in the construction of a relatively cheap conventional bomb and plans by groups to use such weaponry have been uncovered in the past. The key power of a dirty bomb (otherwise known as a “radiological dispersal device”) isn’t the immediate health risk to a local population (apart from the obvious damage that could be caused by the conventional explosives used in the device), it is the lasting fear, panic and economic damage such a terror attack could cause. The residual radiation left over from a dirty bomb is of course a concern, but studies show that it is the psychological damage of such an attack that would have the greater effect.
So, the Department of Energy gave Dr Ryan a call to ask whether his work at the University of New Hampshire’s Space Science Center could be used to seek out radioactive devices. At the time, he was working on an instrument to be sent within the orbit of Mercury to detect low energy neutrons being emitted from the Sun. It just so happened that the neutron energy range matched that of the emission from plutonium.
“You don’t have to be an astrophysicist to see the connection,” Ryan commented on the government interest in using his techniques to search for nuclear devices on Earth.
However, during a visit to a National Guard exercise on Cape Cod, Jim Ryan was inspired by another space mission. The exercise carried out last year was to test security agent’s ability to track down dirty bombs (not nuclear weapons containing plutonium). Dirty bombs emit a different type of radiation (not the low energy neutrons emitted from a plutonium device), and Ryan realised that parts from his old and beloved Compton Gamma Ray Observatory may be resurrected to help serve national security tasks. Rather than manually scanning suspect radioactive devices with a hand-held Geiger counter, the gamma ray radiation can be detected at a safe distance and pinpointed. The problem with Geiger counters is that although they detect gamma radiation, you have to be standing right next to the radioactive source to know where it is. Using Compton Gamma Ray Observatory techniques can make the search safer and a lot more accurate.
“It lives on and does something that is useful to society as well as pure academic science,” Ryan said during a presentation to a Homeland Security conference in May. “[It is] poetic justice,” that the techniques by the spacecraft will be re-used by the modern fight against international terrorism.
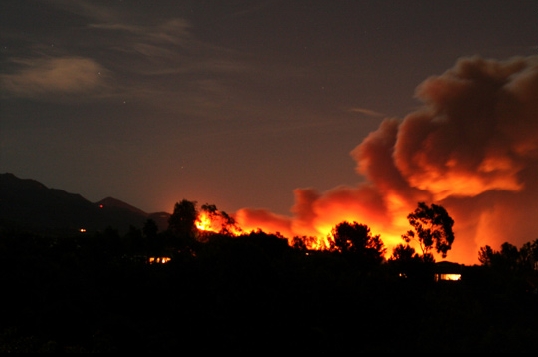
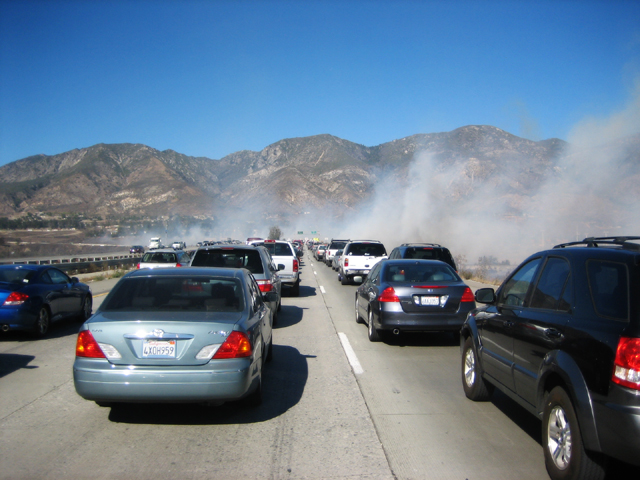
Santa Ana wind-fuelled wildfires on October 13th in the San Fernando valley, north of Los Angeles. NASA's Aqua satellite captured this image (NASA)
[/caption]
This morning at 5:30am, I woke up to the smell of smoke. It’s one of those horrid, gut-wrenching feelings for anyone as your mind jumps from “did I leave the oven on?” to “oh no, it’s our turn.” The latter thought is probably one that everyone living near summer-dried woodland in California thinks on waking to the smell of smoke. And in the San Fernando Valley, we’ve had one or two scares this year.
The advance of the wildfires can be very fast. A view of the Santa Barbara fire (Tynan Daniels/CNN)My wife and I live in Woodland Hills, about 20 minutes from Los Angeles, and before I moved to the US Deb warned me, “there might be a chance that we’ll get affected by a wildfire at the new house.” Coming from the UK, where the worst thing I’ve experienced was a flood (one of those car-floating floods the British countryside does so well), it was a little unnerving that I was moving to Southern California where I’d already experienced an earthquake and seen the damage caused by wildfires first-hand. It’s little wonder my family are constantly texting me asking “is everything OK?”
This time, it wasn’t “our turn” as we live on the south-west side of the valley. But late last night, hundreds of families weren’t so lucky and had to be evacuated from their homes as fires raged along the northern edge of the LA County line up to Santa Barbara…
It was a strange atmosphere in the valley today. A huge smokestack was growing about 12 miles north, and brown smoke filled the air, filtering out much of the sunlight. Walking into the garden with my coffee after the disturbed night sleep, I noticed a thin layer of soot over the patio and table. It was eerily quiet. Add this to the unseasonably warm weather we are having, there was a real sense the raging wildfire was a lot closer than it was.
Grid lock on the I-15 in San Bernardino, CA, during the October 2007 wildfires (Ian O'Neill) This is fire season after all, when the strong offshore Santa Ana winds sweep across Southern California, fanning the flames of wildfires with the dry, warm air from the desert. This is the time when everyone is a little edgy when even a hint of smoke can be smelled in the air. Should fire take hold in the dry vegitation, firefighters have to throw everything they’ve got at the area affected, preventing damage to property and loss of life.
Last month was my last experience of a particularly vicious sequence of fires (again, causing huge problems for people in the north of the valley), and it looks like we have a few more days of trouble ahead of us. Governor Arnold Schwarzenegger has issued an emergency declaration for the Sayre fire in Sylmar and as I write, mandatory evacuations have been placed on some locations north of LA, down to Orange County. There is also the threat of rolling blackouts as the blazes deprive some areas of electricity supplies. The problem is spreading across the region.
Use Google Maps to monitor the areas affected in the region »
This afternoon, although life continued as normally as it could though the unhealthy haze of smoke trapped in the valley basin, I saw two yellow firefighting aircraft landing in Van Nuys airport, before flying north to assist the thousands of brave firefighters on the ground. We can only imagine how extreme it must be over there.
NASA’s Autonomous Modular Scanner, onboard the Ikhana remotely-operated aircraft, images fires in Monterey County, CA on July 8th, 2008 (NASA/Google)So, out of interest, I decided to do some research to see if the guys on the ground were getting any help from NASA (after all, the agency has a developed Earth observatory program), surely there is an “eye in the sky” that can help co-ordinate efforts down here?
In July, when California was suffering a state-wide wildfire emergency (is it me, or has the wildfire season lasted a lot longer this year?), NASA flew a robotic Ikhana aircraft across much of the state, charting over 300 fires that had broken out. The Ikhana was using an Autonomous Modular Scanner developed at NASA’s Ames Research Center at Moffett Field to precisely measure temperature variations across the landscape from one-half degree to approximately 1,000 °F (537 °C). Areas currently burning and areas already burnt could then be identified. From this information, areas at risk could be quickly focused on, providing the firefighters with advanced warning before a fire takes hold.
“NASA’s emergency imaging gives us immediate information that we can use to manage fires, identify threats and deploy firefighting assets,” Governor Schwarzenegger said in July. “I thank NASA for providing us with this important firefighting tool.”
Whether or not the Ikhana aircraft is in the skies at the moment, it is unknown, but NASA has some other fire monitoring tricks a little higher in the sky.
The Moderate Resolution Imaging Spectroradiometer (MODIS) flies onboard NASA’s Aqua and Terra satellites as part of the NASA-centered international Earth Observing System. Both satellites orbit the Earth from pole to pole, seeing most of the globe every day. Onboard Terra, MODIS sees the Earth during the morning, while Aqua MODIS orbits the Earth in the afternoon.
True-color, photo-like imagery and false-color imagery are available within a few hours of being collected, making the system a valuable resource for organizations like the U.S. Forest Service and the international fire monitoring community, who use the images to track fires; the United States Department of Agriculture Foreign Agricultural Service, who monitors crops and growing conditions; and the United States Environmental Protection Agency and the United States Air Force Weather Agency, who track dust and ash in the atmosphere. The science community also uses the system in projects like the Aerosol Robotic Network (AERONET), which studies particles like smoke, pollution, or dust in the atmosphere.
Here’s to hoping NASA’s resources are being made available as widely as possible as LA County is now in a state of emergency. Our thoughts are with the people who have been injured, displaced and lost their homes, and to the Fire Service who are fighting day and night to bring these blazes under control.
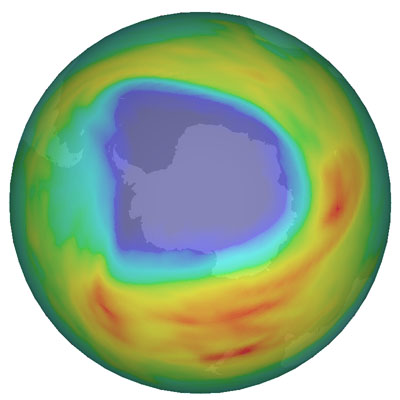
Ozone hole during 7 October 2008 as measured by the Scanning Imaging Absorption Spectrometer for Atmospheric Cartography (SCIAMACHY) atmospheric sensor onboard ESA’s Envisat. Credits: KNMI/ESA
[/caption]
Is the ozone hole was recovering? Maybe not. The protective atmospheric layer of ozone around our planet has been thinning over Antarctica for many years. New satellite data indicates the 2008 ozone hole is larger both in size and ozone loss than 2007 but is not as large as the record year of 2006. This year the area of the thinned ozone layer over the South Pole reached about 27 million square kilometers, compared to 25 million square kilometers in 2007 and a record ozone hole extension of 29 million square kilometers in 2006, which is about the size of the North American continent. Ozone is a protective atmospheric layer found about 25 kilometers in altitude that acts as a sunlight filter, shielding life on Earth from harmful ultraviolet rays. A thinner ozone layer can increase the risk of skin cancer and cataracts and harm marine life. What causes the ozone layer to change from year to year, and if CFC’s have been banned, why isn’t the ozone recovering?
The depletion of ozone is caused by extreme cold temperatures at high altitude and the presence of ozone-destructing gases in the atmosphere such as chlorine and bromine. Most of these gases originate from man-made products like chlorofluorocarbons (CFCs), which were phased out under the 1987 Montreal Protocol. But they continue to linger in the atmosphere.
Depending on the weather conditions, the size the Antarctic ozone hole varies every year. As the polar spring arrives in September or October, the combination of returning sunlight and the presence of so-called stratospheric clouds (PSCs) over the Antarctic leads to a release of highly ozone-reactive chlorine radicals present in the atmosphere that break ozone down into individual oxygen molecules. A single molecule of chlorine has the potential to break down thousands of molecules of ozone.
Chlorine activation and ozone hole extension early September 2007 and 2008. Credits: DLR
Colder temperatures in the stratosphere over Antarctica, combined with a high formation rate of PSCs caused more lingering chlorine radicals to be released, making the current hole one of the largest. 2006 saw the largest hole. A unit of measurement called a Dobson Unit describes the thickness of the ozone layer, and this year (2008) about 120 Dobson Units were observed compared to around 100 Dobson Units in 2006.
The analysis is based upon the Scanning Imaging Absorption Spectrometer for Atmospheric Cartography (SCIAMACHY) atmospheric sensor onboard ESA’s Envisat, the Global Ozone Monitoring Experiment (GOME) aboard ESA’s ERS-2 and its follow-on instrument GOME-2 aboard EUMETSAT’s MetOp.
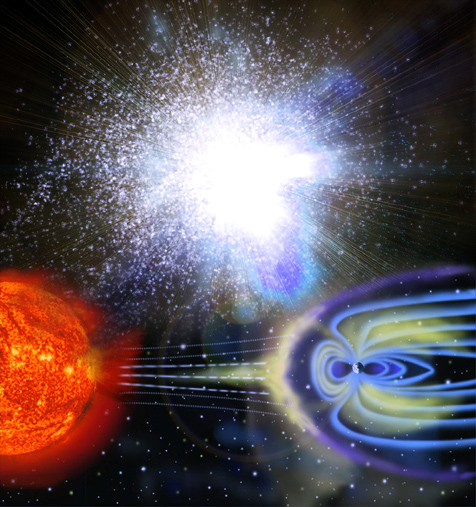
Could the magnetic field of the Earth really reverse in 2012? I wouldn't bet on it...
[/caption]Apparently, on December 21st 2012, our planet will experience a powerful event. This time we’re not talking about Planet X, Nibiru or a “killer” solar flare, this event will originate deep within the core of our planet, forcing a catastrophic change in our protective magnetic field. Not only will we notice a rapid reduction in magnetic field strength, we’ll also see the magnetic poles rapidly reverse polarity (i.e. the north magnetic pole will be located over the South Pole and vice versa). So what does this mean to us? If we are to believe the doomsayers, we’ll be exposed to the vast quantities of radiation blasting from the Sun; with a reversing magnetic field comes a weakening in the Earth’s ability to deflect cosmic rays. Our armada of communication and military satellites will drop from orbit, adding to the chaos on the ground. There will be social unrest, warfare, famine and economic collapse. Without GPS, our airliners will also plough into the ground…
Using the Mayan Prophecy as an excuse to create new and explosive ways in which our planet may be destroyed, 20 12 2012 doomsayers use the geomagnetic shift theory as if it is set in stone. Simply because scientists have said that it might happen within the next millennium appears to be proof enough that it will happen in four years time. Alas, although this theory has some scientific backing, there is no way that anyone can predict when geomagnetic reversal might happen to the nearest day or to the nearest million years…
Firstly, let’s differentiate between geomagnetic reversal and polar shift. Geomagnetic reversal is the change in the magnetic field of the Earth, where the magnetic north pole shifts to the South Polar Region and the south magnetic pole shifts to the North Polar Region. Once this process is complete, our compasses would point toward Antarctica, rather than northern Canada. Polar shift is considered to be a less likely event that occurs a few times in the evolutionary timescale of the Solar System. There are a couple of examples of planets that have suffered a catastrophic polar shift, including Venus (which rotates in an opposite direction to all the other planets, therefore it was flipped upside down by some huge event, such as a planetary collision) and Uranus (which rotates on its side, having been knocked off-axis by an impact, or some gravitational effect caused by Jupiter and Saturn). Many authors (including the doomsayers themselves) often cite both geomagnetic reversal and polar shift as being one of the same thing. This isn’t the case.
So, on with geomagnetic reversal…
How often does it happen? The Earths interior (University of Chicago)The reasons behind the reversal of the magnetic poles is poorly understood, but it is all down to the internal dynamics of Planet Earth. As our planet spins, the molten iron in the core flows freely, forcing free electrons to flow with it. This convective motion of charged particles sets up a magnetic field which bases its poles in the North and South Polar Regions (a dipole). This is known as the dynamo effect. The resulting magnetic field approximates a bar magnet, allowing the field to envelop our planet.
This magnetic field passes through the core to the crust and pushes into space as the Earth’s magnetosphere, a protective bubble constantly being buffeted by the solar wind. As the solar wind particles are usually charged, the Earth’s powerful magnetosphere deflects the particles, only allowing them into the polar cusp regions where the polar magnetic fieldlines become “open.” The regions at which these energetic particles are allowed to enter glow as aurorae.
Usually this situation can last for aeons (a stable magnetic field threaded through the North and South Polar Regions), but occasionally, the magnetic field is known to reverse and alter in strength. Why is this?
A chart showing Earths polarity reversals over the last 160 million years. Black = normal polarity, White = reversed polarity. From Lowrie (1997)
Again, we simply do not know. We do know that this magnetic pole flip-flop has occurred many times in the last few million years, the last occurred 780,000 years ago according to ferromagnetic sediment. A few scaremongering articles have said geomagnetic reversal occurs with “clockwork regularity” – this is simply not true. As can be seen from the diagram (left), magnetic reversal has occurred fairly chaotically in the last 160 million years. Long-term data suggests that the longest stable period between magnetic “flips” is nearly 40 million years (during the Cretaceous period over 65 million years BC) and the shortest is a few hundred years.
Some 2012 theories suggest that the Earth’s geomagnetic reversal is connected to the natural 11-year solar cycle. Again, there is absolutely no scientific evidence to support this claim. No data has ever been produced suggesting a Sun-Earth magnetic polarity change connection.
So, already this doomsday theory falters in that geomagnetic reversal does not occur with “clockwork regularity,” and it has no connection with solar dynamics. We are not due a magnetic flip as we cannot predict when the next one is going to occur, magnetic reversals occur at seemingly random points in history.
What causes geomagnetic reversal? The model Earth, can a magnetic field be modelled in the lab? (Flora Lichtman, NPR)Research is afoot to try to understand the internal dynamics of our planet. As the Earth spins, the molten iron inside churns and flows in a fairly stable manner for millennia. For some reason during geomagnetic reversal, some instability causes an interruption to the steady generation of a global magnetic field, causing it to flip-flop between the poles.
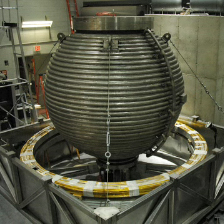
In a previous Universe Today article, we discussed the efforts of geophysicist Dan Lathrop’s attempts to create his own “model Earth,” setting a 26 tonne ball (containing a molten iron analogue, sodium) spinning to see if the internal motion of the fluid could set up a magnetic field. This huge laboratory experiment is testament to the efforts being put into understanding how our Earth even generates a magnetic field, let alone why it randomly reverses.
A minority view (which, again is used by doomsayers to link geomagnetic reversal with Planet X) is that there may be some external influence that causes the reversal. You will often see associated with the Planet X/Nibiru claims that should this mystery object encounter the inner Solar System during its highly elliptical orbit, the magnetic field disturbance could upset the internal dynamics of the Earth (and the Sun, possibly generating that “killer” solar flare I discussed back in June). This theory is a poor attempt to link several doomsday scenarios with a common harbinger of doom (i.e. Planet X). There is no reason to think the strong magnetic field of the Earth can be influenced by any external force, let alone a non-existent planet (or was that a brown dwarf?).
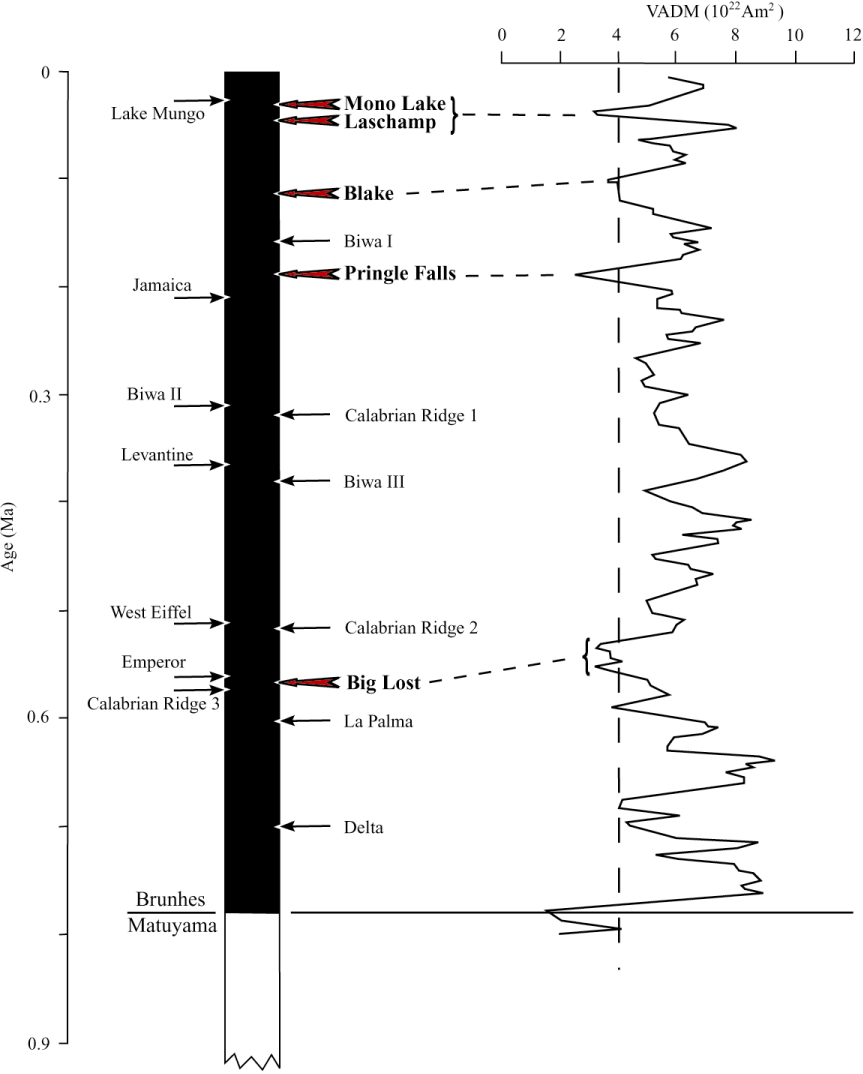
The magnetic field strength waxes and wanes… Variations in geomagnetic field in western US since last reversal. The vertical dashed line is the critical value of intensity below which Guyodo and Valet (1999) consider several directional excursions to have occurred.New research into the Earth’s magnetic field was published recently in the September 26th issue of Science, suggesting that the Earth’s magnetic field isn’t as simple as we once believed. In addition to the North-South dipole, there is a weaker magnetic field spread around the planet, probably generated in the outer core of the Earth.
The Earth’s magnetic field is measured to vary in field strength and it is a well known fact that the magnetic field strength is currently experiencing a downward trend. The new research paper, co-authored by geochronologist Brad Singer of the University of Wisconsin, suggests that the weaker magnetic field is critical to geomagnetic reversal. Should the stronger dipole (north-south) field reduce below the magnetic field strength of this usually weaker, distributed field, a geomagnetic reversal is possible.
“The field is not always stable, the convection and the nature of the flow changes, and it can cause the dipole that’s generated to wax and wane in intensity and strength,” Singer said. “When it becomes very weak, it’s less capable of reaching to the surface of the Earth, and what you start to see emerge is this non-axial dipole, the weaker part of the field that’s left over.” Singer’s research group analysed samples of ancient lava from volcanoes in Tahiti and Germany between 500,000 and 700,000 years ago. By looking at an iron-rich mineral called magnetite in the lava, the researchers were able to deduce the direction of the magnetic field.
The spin of the electrons in the mineral is governed by the dominant magnetic field. During times of strong dipolar field, these electrons pointed toward the magnetic North Pole. During times of weak dipolar field, the electrons pointed to wherever the dominant field was, in this case the distributed magnetic field. They think that when the weakened dipolar field drops below a certain threshold, the distributed field pulls the dipolar field off-axis, causing a geomagnetic shift.
“The magnetic field is one of the most fundamental features of the Earth,” Singer said. “But it’s still one of the biggest enigmas in science. Why [the flip] happens is something people have been chasing for more than a hundred years.”
Our meandering magnetic pole The movement of Earth's north magnetic pole across the Canadian arctic, 1831--2001 (Geological Survey of Canada)Although there appears to be a current downward trend in magnetic field strength, the current magnetic field is still considered to be “above average” when compared with the variations measured in recent history. According to researchers at Scripps Institution of Oceanography, San Diego, if the magnetic field continued to decrease at the current trend, the dipolar field would effectively be zero in 500 years time. However, it is more likely that the field strength will simply rebound and increase in strength as it has done over the last several thousand years, continuing with its natural fluctuations.
The positions of the magnetic poles are also known to be wondering over Arctic and Antarctic locations. Take the magnetic north pole for example (pictured left); it has accelerated north over the Canadian plains from 10 km per year in the 20th Century to 40 km per year more recently. It is thought that if the point of magnetic north continues this trend, it will exit North America and enter Siberia in a few decades time. This is not a new phenomenon however. Ever since James Ross’ discovery of the location of the north magnetic pole for the first time in 1831, it’s location has meandered hundreds of miles (even though today’s measurements show some acceleration).
So, no doomsday then?
Geomagnetic reversal is an engrossing area of geophysical research that will continue to occupy physicists and geologists for many years to come. Although the dynamics behind this event are not fully understood, there is absolutely no scientific evidence supporting the claim that there could be a geomagnetic reversal around the time of December 21st, 2012.
Besides, the effects of such a reversal have been totally over-hyped. Should we experience geomagnetic reversal in our lifetimes (which we probably won’t), it is unlikely that we’ll be cooked alive by the Solar Wind, or be wiped out by cosmic rays. It is unlikely that we’ll suffer any mass extinction event (after all, early man, homo erectus, lived through the last geomagnetic shift, apparently with ease). We’ll most likely experience aurorae at all latitudes whilst the dipolar magnetic field settles down to its new, reversed state, and there might be a small increase in energetic particles from space (remember, just because the magnetosphere is weakened, doesn’t mean we wont have magnetic protection), but we’ll still be (largely) protected by our thick atmosphere.
Satellites may malfunction and migrating birds may become confused, but to predict world collapse is a hard pill to swallow.
In conclusion:
Geomagnetic reversal is chaotic in nature. There is no way we can predict it.
Simply because the magnetic field of the Earth is weakening does not mean it is near collapse. Geomagnetic field strength is “above average” if we compare today’s measurements with the last few million years.
The magnetic poles are not set in geographical locations, they move (at varying speeds) and have done ever since measurements began.
There is no evidence to suggest external forcing of internal geomagnetic dynamics of the Earth. Therefore there is no evidence of the solar cycle-geomagnetic shift connection. Don’t get me started on Planet X.
So, do you think there will be a geomagnetic reversal event in 2012? I thought not.
Once again, we find another 2012 doomsday scenario to be flawed in so many ways. There is no doubt that geomagnetic reversal will happen in the future for Earth, but we’re talking about time scales anything from an optimistic (and unlikely) 500 years to millions of years, certainly not in the coming four years…
Sources: NASA, US News, SciVee, How To Survive 2012, AGU
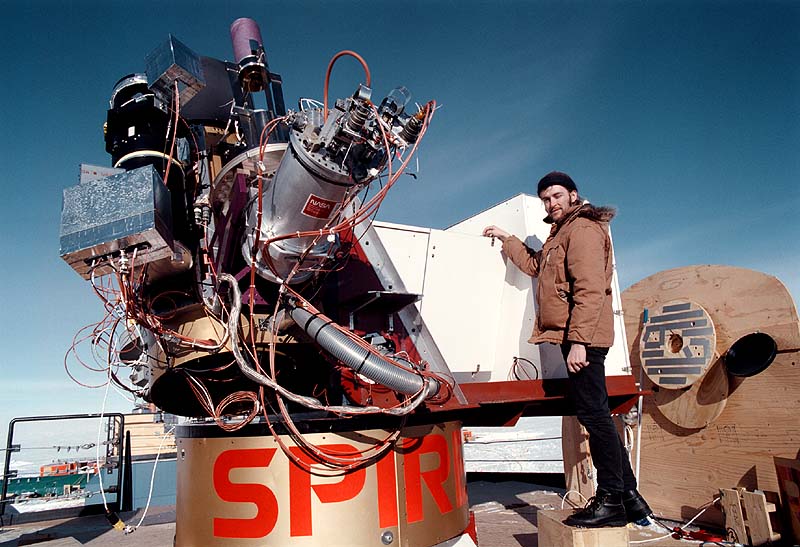
Rodney Marks (1997-1998 winterover) with the SPIREX telescope (D. A. Harper)
[/caption]In May 2000, Australian astrophysicist Dr Rodney David Marks died from acute methanol poisoning whilst stationed at the US Amundsen-Scott South Pole Station. He was a 32 year old “brilliant and witty” scientist, whose death shocked his family and friends. The media jumped on this story, citing the tragedy as the “first South Pole murder,” but there was little evidence to suggest anyone else was involved. Unfortunately it appears that New Zealand investigators have been hampered by a lack of co-operation by the organizations that run the facility, so it remains unclear whether Marks’ death was the result of foul play or tragic accident…
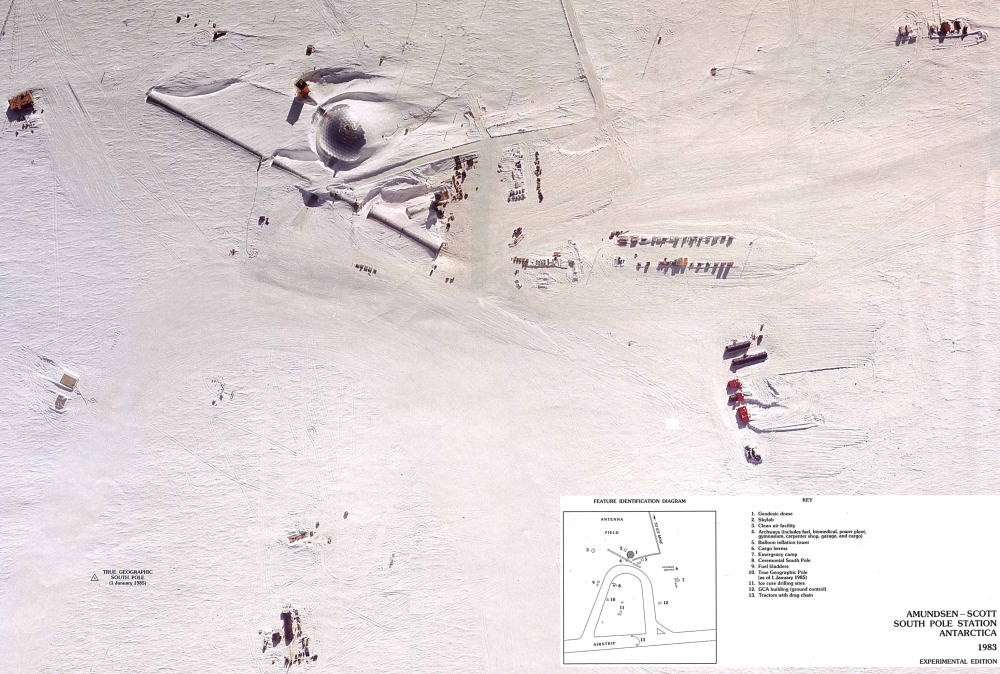
Dr Marks was employed by the Smithsonian Astrophysical Observatory, working on the Antarctic Submillimetre Telescope and Remote Observatory project. The Amundsen-Scott South Pole Station (pictured below) is maintained by the US National Science Foundation (NSF) and US contractor Raytheon Polar Services, and is the southernmost continually inhabited settlement on Earth. With this exotic location comes a high degree of risk; after all, if there’s an accident or emergency, you can’t just find the nearest hospital. Although the facility has good medical support, should something unexpected happen, the scientists living right on top of the South Pole are at the mercy of the extreme weather and isolated location.
Aerial view the South Pole, including the Amundsen-Scott South Pole Station (NOAA)
In the month of May 2000, medical staff at Amundsen-Scott were confronted with a baffling problem when a distressed Rodney Marks came to them three times during a 36 hour period. On May 11th, he had felt sick and vomited blood when travelling back from the remote observatory to base. On returning, his condition took a rapid turn for the worse. Baffled by the situation, medical staff sought advice via satellite, but they were too late. On May 12th, the astrophysicist had died.
For six months, officials had to wait until Marks’ body could be flown to New Zealand for an autopsy where it was found that the 32 year old had suffered from acute methanol poisoning. As New Zealand has jurisdiction over the incident, investigators from the nation took on the task of working out how Marks could have become poisoned.
According to a recent article in the New Zealand Herald, the investigators may never get to the bottom of this Antarctic mystery. On September 24th, coroner Richard McElrea released his findings behind the death of Dr Marks, airing his frustrations that the police investigation had been hampered by the lack of co-operation by the NSF and Raytheon Polar Services.
The police officer assigned to investigating the case, Detective Grant Wormald, even remarked, “Despite numerous requests, I am not entirely satisfied that all relevant information and reports have been disclosed to the New Zealand police or the coroner.” Dr Marks’ family have also been disappointed by the lack of communication they have received by the organizations responsible for the safety of their researchers.
“And I don’t think we are going to try to find out any more in regards to how Rodney died. I’d see that as a fruitless exercise […] For heaven’s sake, a man has died in your care. Why wouldn’t you help the police? .” – Paul Marks, Dr Marks’ father.
Originally, suicide was thought to be at the root of this mystery, but it was quickly ruled out as it didn’t fit with Dr Marks’ profile. He was a happy scientist who was engaged to Sonja Wolter, a young maintenance specialist, who had signed up to the station to be with her fiancé. According to the Detective Wormald, “Sonja and Rodney were a great couple. It is so rare to see people that seem so perfectly matched. And they were extremely happy together.”
It was also suggested that Marks may have consumed the methanol deliberately, to get a “recreational high,” even though there was a plentiful supply of genuine liquor and beer at the facility. Dr Marks was a social young man who “always said was that the solution to any problem is to go down to the pub and have a few drinks,” according to one of his friends, Andrew Walsh. Even though he may have enjoyed a few drinks and could be considered to be a binge drinker, it is strange to think he would willingly consume the dangerous substance for fun.
There are some sinister overtones to this mystery however. According to a 1996 report, Dr Robert Thompson, the first doctor to examine Marks when he came to the medical facility for help, said the astrophysicist was “nervous, anxious and upset.” What’s more, he noted two needle marks on his arm, but decided not to ask about them.
Had Marks been murdered by one of the 49 members of staff at the Amundsen-Scott South Pole Station? Unfortunately, we may never know whether Marks’ death was deliberate or by accident. According to the US agencies, an investigation had been carried out, but Detective Wormald has not been privy to the conclusions. “It is impossible to say how far that investigation went or to what end,” he said.
The Herald reporter apparently approached Raytheon, but the company would not comment and an NSF spokesman referred any questions to the NSF offices in Washington DC.
It looks like everyone is remaining tight-lipped about the events on May 11th-12th 2000, ensuring the world may never get to the cause behind the tragic death of this talented and friendly astrophysicist.
From the people that brought you the X PRIZE and the Google Lunar X PRIZE comes something new that’s a little more down to Earth. However they also say it’s crazy. But if you’re handy with a video camera, care about the environment, and are interested in winning a nice chunk of spare change, this might be up your alley. The $25,000 “What’s your crazy green idea?†Video Contest was just announced, and the X PRIZE folks are looking to find out what crazy ideas are out there that could become the next big thing for the environoment. “Before something is a breakthrough, it’s a crazy idea,” they say, and the X PRIZE Foundation is looking for your crazy green ideas to become the next X PRIZE. Here’s a video for more information:
Here are the rules:
1. Submit a 2 minute video to this group by October 31, 2008 explaining what you think should be the next Energy and Environment X PRIZE. Here’s the link.
2. The three most viable ideas will be posted on the X PRIZE website on November 15.
3. The public will be given two weeks to vote for the winner on the same site. The most creative, revolutionary idea and video will receive $25,000 and it could become the next great X PRIZE.
Be sure that your video answers the following questions:
1. What is the Grand Challenge or world-wide problem that you are trying to solve?
2. What is the specific prize idea (goal, rules, judging criteria)?
3. How will this prize lead to benefits for humanity?
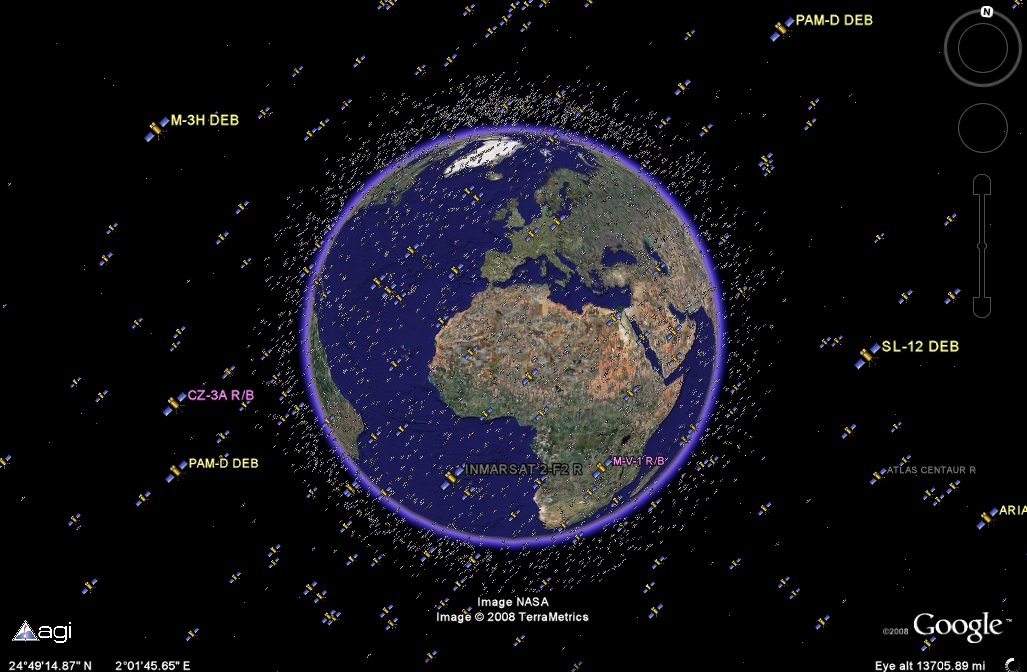
It's getting crowded out there: active and inactive satellites are tracked (Google/Analytical Graphics)
[/caption]
OK, I’ve just wasted an hour in simulated space, checking out some of the active and junked satellites orbiting our planet. Google Earth can be an addictive thing at the best of times, but when 13,000 of the satellites in Earth orbit can be viewed by a new plug-in for the program, you may find yourself hooked for longer than usual. The United States Strategic Command keeps very close tabs on what is orbiting our planet and where they are at any given time, and now with the help of Google Earth, you can explore the satellites, plot their orbital trajectories and see just how crowded space can be. Never before have geostationary communication satellites been so interesting!
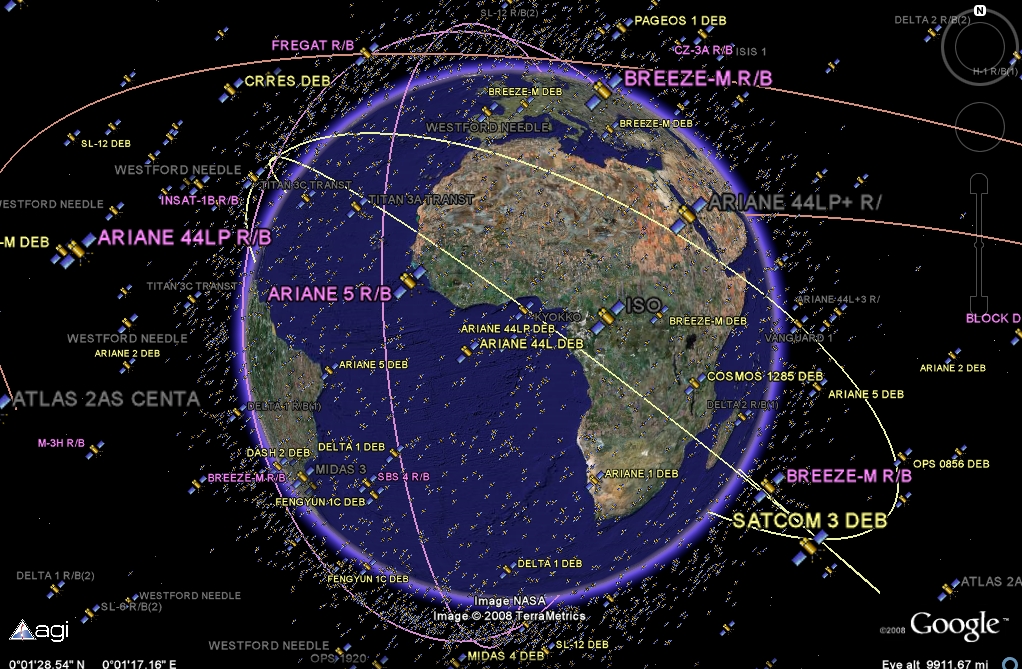
Just trackin': playing around with the orbital trajectory option (Google/Analytical Graphics)
Tracking space junk is paramount to all our activities in space. Every time we put a “useful” satellite into orbit – to service our communication needs, monitor the weather or spy on other countries – we are amplifying the growing space junk problem surrounding Earth. In February, I wrote a Universe Today article reporting on Google Earth’s ability to plot all known bits of space junk orbiting the Earth. I think it shocked many to see the problem in dazzling 3D. Now a new plug-in has been released detailing the positions of 13,000 alive and dead satellites being tracked by the US military.
At the end of last month, the danger of discarded satellite parts became all too real for the crew of the International Space Station. Nancy wrote about the heroic efforts of the (soon to be dumped) ATV that boosted the station clear of passing debris from a disintegrated Russian satellite. According to officials, the ATV carried out a 5 minute burn, slowing the station and lowering its orbit by 1.5 km (1 mile). The chunk of Russian spy satellite was allowed to pass without incident.
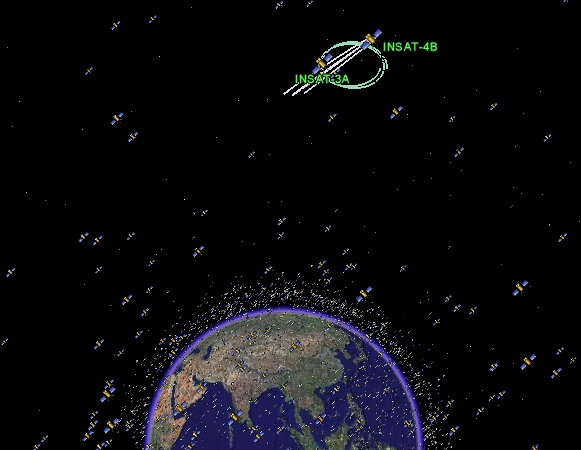
InSat-4, active communications satellites serving India. They're in geosynchronous orbit don't you know? (Google/Analytical Graphics)
Now you can see the space debris being carefully watched by the US and do some satellite tracking yourself. This new Google Earth plug-in (.kmz file for Google Earth) allows you not only to get information on the 13,000 objects tracked by the US Strategic Command, it also lets you plot their orbits. All the way from low Earth to geostationary orbits, you can access information about who launched the satellite, whether it is active or not, its launch date, mass and orbital information (apogee/perigee). By clicking “Display Trajectory in Fixed Frame” in the information panel that appears when you select the satellite, the orbital path is displayed. It is worth noting that this is the orbital trajectory in relation to the Earth’s rotation (or the “fixed frame”), so geostationary satellites will appear to have no orbital motion, as you’d expect.
I spent a long time clicking on the various satellites, constantly surprised by the huge number of inactive satellites there were. I also checked out some information on satellites I’d never heard of (like the active InSat-3A/4B geostationary communication satellites I found oscillating around each other, pictured).
Although it is shocking to see the sheer number of satellites out there (reminding me that Kessler Syndrome could be a very real threat in the future), learning about the stuff orbiting Earth was great fun.
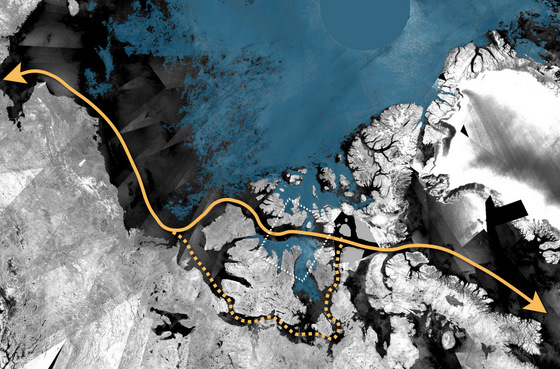
The arrow shows the Northwest Passage, which is virtually ice free. Credit: ESA
[/caption]
Envisat satellite observations from mid-August show that a new record of low polar sea-ice coverage in the Arctic could be reached in sometime in September. This follows last summer’s record minimum ice cover in the same area. Current ice coverage in the Arctic has already reached the second absolute minimum since observations from space began 30 years ago. Because the extent of ice cover is usually at its lowest about mid-September, this year’s minimum could still fall to set another record low.
The direct route through the Northwest Passage – highlighted in the image above by an orange line – is currently almost free of ice, while the indirect route, called the Amundsen Northwest Passage, has been passable for almost a month. This is the second year in a row that the most direct route through the Northwest Passage has opened up.
Each year, the Arctic Ocean experiences the formation and then melting of vast amounts of ice that floats on the sea surface. An area of ice the size of Europe melts away every summer reaching a minimum in September. Since satellites began surveying the Arctic in 1978, there has been a regular decrease in the area covered by ice in summer – with ice cover shrinking to its lowest level on record and opening up the most direct route through the Northwest Passage in September 2007.
“The polar regions, especially the Arctic, are very sensitive indicators of climate change,” said Prof. Heinrich Miller from the Alfred Wegener Institute (AWI) in Bremerhaven, Germany. “The UN’s Intergovernmental Panel on Climate Change has shown that these regions are highly vulnerable to rising temperatures and predicted that the Arctic would be virtually ice-free in the summer months by 2070. Other scientists claim it could become ice-free as early as 2040. Latest satellite observations suggest that the Arctic could be mainly ice-free even earlier.”