Earth’s Iron Building Blocks

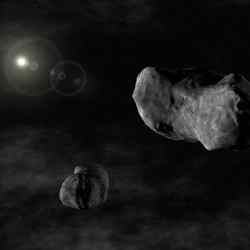
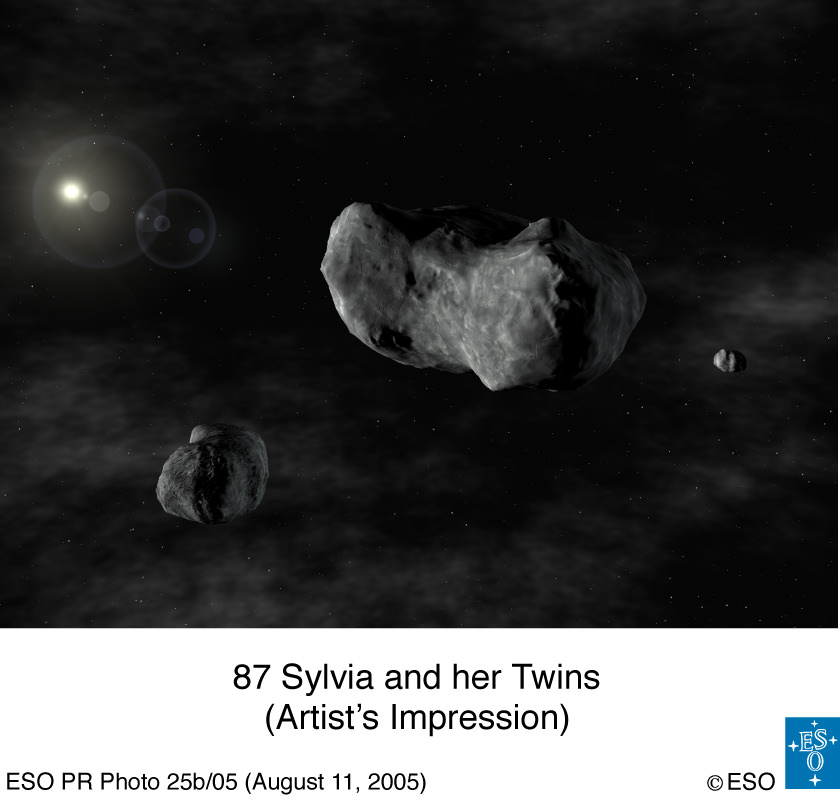
Artist’s conception shows Romulus and Remus orbiting the asteroid 87 Sylvia. Image credit: ESO Click to enlarge
Iron meteorites are probably the surviving fragments of the long-lost asteroid-like bodies that formed the Earth and other nearby rocky planets, according to researchers from Southwest Research Institute (SwRI) and Observatoire de la Cote d’Azur in Nice, France. Their findings are described in the Feb.16 issue of Nature.

Iron meteorites, which are composed of iron and nickel alloys, represent some of the earliest material formed in the solar system, with most coming from the cores of small asteroids. According to Dr. William Bottke, an SwRI research scientist and leader of the joint U.S.-French team, iron-meteorite parent bodies probably emerged from the same disk of planetary debris that produced the Earth and other inner solar system planets.

“Small bodies that form quickly in the inner solar system end up melting and differentiating from the decay of short-lived radioactive elements,” explains Bottke. “Iron meteorites came from the molten material that sinks to the center of these objects, cools and solidifies.”

For these meteorites to arrive on Earth, they must have been extracted from their parent bodies and kept around for billions of years. The team’s computer simulations found that any asteroids managing to avoid being gobbled up by the planets were quickly demolished by impacts. Each breakup, however, produces millions of fragments, many in the form of iron meteorites. These leftovers were scattered across the solar system by gravitational interactions with protoplanetary bodies, with some reaching the relative safety of the asteroid belt. Over billions of years, a few of the survivors escaped their captivity in the asteroid belt and were delivered to Earth.

“This means that certain iron meteorites may tell us what the precursor material for the primordial Earth was like, while also helping us unlock several fundamental questions about the Earth’s origins,” says Bottke. “There’s also the possibility that larger versions of this material may still be hiding among the asteroids. The hunt for them is on.”

A new way to look at iron meteorites

A potential problem in using meteorites to understand the formation of Earth and other terrestrial planets Mercury, Venus and Mars is that most come from the distant asteroid belt. This population of interplanetary bodies, ranging from tiny pebbles to Texas-sized objects, is located between the orbits of Mars and Jupiter about 140 million miles from Earth.

Most members of the asteroid belt are assumed to have formed there, so the vast majority of meteorite samples tell us about formation events in that region, not those that took place near Earth. Meteorite compositions are so diverse, however, that it is difficult to reconcile that all came from this one, fairly narrow region of space.

“While tens of thousands of stony meteorites have been collected, most can be traced back to perhaps a few tens of parent asteroids,” says Dr. Alessandro Morbidelli of the Observatorie de la Cote d’Azur. “What is strange is that the iron meteorites, despite their smaller numbers, represent almost two-thirds of all of the unique parent asteroids sampled to date.”

To explain this discrepancy, the team tracked the origin and evolution of iron-meteorite parent bodies using several computer models. They found that while many iron meteorites are likely residing in the asteroid belt today, their precursors probably did not form there. Instead, the simulations indicate that the precursors of most iron meteorites formed in the terrestrial planet region.

To investigate this hypothesis, the researchers first examined the constraints provided by the meteorites themselves. Iron meteorites are unusual in that most come from the disrupted cores of small melted (differentiated) asteroids that formed very early in solar system history. These are precisely the kinds of bodies that computer models predict should have formed near Earth.

“It is hard to produce small differentiated bodies in the asteroid belt without also melting lots of large asteroids,” explains Dr. Robert Grimm, assistant director of the SwRI Space Studies Department. “These events would produce a number of telltale signs that would be easily detected by observers.”

Using computer simulations, the team then tracked how a disk of asteroid-like bodies interacting with a host of protoplanetary objects in the terrestrial planet region might evolve. Simulations showed that some of these asteroid-like bodies could have scattered far enough to take up residence in the asteroid belt.

“While the amount of material reaching the asteroid belt was limited, much of it was placed in regions likely to produce meteorites,” says SwRI Research Scientist Dr. David Nesvorn??bf?. En route to the asteroid belt, the parent bodies of the iron meteorites were repeatedly bashed by other bodies, allowing core fragments from numerous bodies to escape.

“This could explain the many differences seen among iron meteorites,” says Dr. David O’Brien of the Observatoire de la Cote d’Azur.

Original Source: NASA Astrobiology

What If We Burn Everything?

This map represents global temperature anomalies averaged from 2008 through 2012. Credit: NASA Goddard Institute for Space Studies/NASA Goddard's Scientific Visualization Studio.

If humans continue to use fossil fuels in a business-as-usual manner for the next few centuries, the polar ice caps will be depleted, ocean sea levels will rise by seven meters and median air temperatures will soar to 14.5 degrees warmer than current day.

These are the stunning results of climate and carbon cycle model simulations conducted by scientists at Lawrence Livermore National Laboratory. By using a coupled climate and carbon cycle model to look at global climate and carbon cycle changes, the scientists found that the earth would warm by 8 degrees Celsius (14.5 degrees Fahrenheit) if humans use the entire planet’s available fossil fuels by the year 2300.

The jump in temperature would have alarming consequences for the polar ice caps and the ocean, said lead author Govindasamy Bala of the Laboratory’s Energy and Environment Directorate.

In the polar regions alone, the temperature would spike more than 20 degrees Celsius, forcing the land in the region to change from ice and tundra to boreal forests.

“The temperature estimate is actually conservative because the model didn’t take into consideration changing land use such as deforestation and build-out of cities into outlying wilderness areas,” Bala said.

Today’s level of atmospheric carbon dioxide is 380 parts per million (ppm). By the year 2300, the model predicts that amount would nearly quadruple to 1,423 ppm.

In the simulations, soil and living biomass are net carbon sinks, which would extract a significant amount of carbon dioxide that otherwise would remain in the atmosphere from the burning of fossil fuels. The real scenario, however, might be a bit different.

“The land ecosystem would not take up as much carbon dioxide as the model assumes,” Bala said. “In fact in the model, it takes up much more carbon than it would in the real world because the model did not have nitrogen/nutrient limitations to uptake. We also didn’t take into account land use changes, such as the clearing of forests.”

The model shows that ocean uptake of CO² begins to decrease in the 22nd and 23rd centuries due to the warming of the ocean surface that drives CO² fluctuations out of the ocean. It takes longer for the ocean to absorb CO² than biomass and soil.

By the year 2300, about 38 percent and 17 percent of the carbon dioxide released from the burning of all fossil fuels are taken up by land and the ocean, respectively. The remaining 45 percent stays in the atmosphere.

Whether carbon dioxide is released in the atmosphere or the ocean, eventually about 80 percent of CO² will end up in the ocean in a form that will make the ocean more acidic. While the carbon dioxide is in the atmosphere, it could produce adverse climate change. When it enters the ocean, the acidification could be harmful to marine life.

The models predict quite a drastic change not only in the temperature of the oceans but also in its acidity content, which would become especially harmful for marine organisms with shells and skeletal material made out of calcium carbonate.

Calcium carbonate organisms, such as coral, serve as climate stabilizers. When the organisms die, their carbonate shells and skeletons settle to the ocean floor, where some dissolve and some are buried in sediments. These deposits help regulate the chemistry of the ocean and the amount of carbon dioxide in the atmosphere. Earlier Livermore research, however, found that unrestrained release of fossil-fuel carbon dioxide to the atmosphere could threaten extinction for these climate-stabilizing marine organisms.

“The doubled-CO² climate that scientists have warned about for decades is beginning to look like a goal we might attain if we work hard to limit CO² emissions, rather than the terrible outcome that might occur if we do nothing,” said Ken Caldeira of the Department of Global Ecology at the Carnegie Institution and one of the other authors.

Bala said the most drastic changes during the 300-year period would be during the 22nd century, when precipitation change, an increase in atmospheric precipitable water and a decrease in sea ice size are the largest and when emissions rates are the highest. According to the model, sea ice cover disappears almost completely in the northern hemisphere by the year 2150 during northern hemisphere summers.

“We took a very holistic view,” Bala said. “What if we burn everything? It will be a wake-up call in climate change.”

As for global warming skeptics, Bala said the proof is already evident.

“Even if people don’t believe in it today, the evidence will be there in 20 years,” he said. “These are long-term problems.”

He pointed to the 2003 European heat wave and the 2005 Atlantic hurricane season as examples of extreme climate change.

“We definitely know we are going to warm over the next 300 years,” he said. “In reality, we may be worse off than we predict.”

Other Livermore authors include Arthur Mirin and Michael Wickett, along with Christine Delire of ISE-M at the Université Montepellier II.

The research appears in the Nov. 1 issue of the American Meteorological Society’s Journal of Climate.

Founded in 1952, Lawrence Livermore National Laboratory has a mission to ensure national security and apply science and technology to the important issues of our time. Lawrence Livermore National Laboratory is managed by the University of California for the U.S. Department of Energy’s National Nuclear Security Administration.

Original Source: LLNL News Release

The Ends of the Earth

Antarctic ice sheets. Image credit: NASA Click to enlarge
Pamela Conrad, an astrobiologist with NASA’s Jet Propulsion Laboratory, has traveled to the ends of the Earth to study life. Conrad recently appeared in James Cameron’s 3-D documentary “Aliens of the Deep,” where she and several other scientists investigated strange creatures that inhabit the ocean floor.

On June 16, 2005, Conrad gave a lecture entitled, “A Bipolar Year: What We Can Learn About Looking for Life on Other Planets by Working in Cold Deserts.”

In part 1 of this edited transcript, Conrad describes what sort of signs we could look for to see if there is life in an alien environment.

“In the past three years, I’ve been engaged in a project with several of my colleagues that takes us to hot and cold deserts. We want to observe the signatures of life, and see if we can tell the difference between places where life is and where life isn’t. The reason we go to deserts is to cut down on the number of confounding variables that are introduced by all kinds of life. Basically, we don’t want to be scraping away the dog poop to find the bacteria in the dirt.

This past year we were privileged to go to both the Arctic and the Antarctic. So this is my bipolar year, and what we were doing there is relevant to space exploration because, like a desert, the conditions on the surface of other planets are very harsh.

We look at rocks because, if life had been and is already gone – in other words, it’s dead, or it’s so dead it’s been fossilized and altered – you can find that in the rock record.

To detect life anywhere, you need to be able to investigate the environment and find measurable clues. If it’s not something you can define in measurable terms, it’s not science. So by definition, we’re kind of out in the cold, so to speak.

One of the challenges is coming up with measurable terms by which you could define life. The terms have to be universal enough to not miss life on another planet, if it was unlike the life we have here. We have a sample set of one: the biosphere on the Earth. We try to use the knowledge we have about life here to come up with those terms, and so we try to think about life in the most general descriptive terms we can.

We look for life in places that are habitable; places that are capable of supporting life. But habitability is difficult to define, because we only have a vague notion of what makes an environment habitable. At NASA, we’re very big on looking for water as one of the facets of habitability.

Water is as important to life in the desert as it is to us. After a fresh snowfall, when rocks get heated up and melt the ice, you see a bloom of cyanobacteria on the surface of the rock. Yet they are able to maintain a minimal existence when there’s not much precipitation.

One reason metabolism has to slow down in the Antarctic winter is because the water is in a solid phase and it’s not accessible. Living things can only use ice when it melts and becomes a good solvent. Using ice is like using a mineral in the crystal phase — when it’s in the solid form, you’ve got to use some energy to bust up those bonds to do something with it. There are organisms in Antarctica that have antifreeze types of molecules in them, fish that possess molecules called glycoproteins. When an ice crystal forms in the fish, the molecule grabs hold of the ice crystal as it starts to grow, and doesn’t let it grow in the direction that its energetically most easily grown. Because it can’t grow, the ice crystal gives up the ghost and turns back into water.

Besides water, we think that certain kinds of chemical elements are important for life elsewhere. Life on Earth is made of carbon and hydrogen and phosphorus and a few other important things, and we need the oxygen in the air. But there are microbes on Earth that breathe metal, and they don’t care about oxygen.

So habitability is really habitable in the eyes of the beholder. When you’re defining it, you’ve got to think about the broadest set of terms you can in order to encompass any kind of life you might be able to imagine. The ultimate assessment of whether a place is habitable is, of course, to see if it is inhabited.

You ask one set of questions if you want to know, “Can I set up housekeeping here?” You might ask another set of questions if you want to know, “Is anybody home?” But at the heart of it all, whether or want to live there or just see if anyone’s home, you have to know something about the neighborhood. You’ve still got to do all the experiments that tell you about the geophysical, mineralogical, and atmospheric properties of the planet. If you’re looking for life, you’ve got to have some notion about what sort of thing you’re trying to support with that environment.

Erupting about 5 million years ago, from a series of fractures known as the Cerberus Fossae, the water flowed down in a catastrophic flood, collecting in an area 800 x 900 km and was initially an average of 45 meters deep. Click image for larger view.Credit: ESA/Mars Express

So what would constitute proof? If you want to say that something has been proven, you have to achieve a certain level of consensus in the scientific community, otherwise your peers will tear you into little bits and pieces in the literature. Of course, there is never a complete consensus: that’s why we nasty scientists fight with each other endlessly. But we have to at least come up with terms. We can agree or disagree with each other’s theories, but we have to agree on the terms and the measurements.

So what kind of measurements could we make if we were looking for life? Does a planet look different if life has been there? For example, if you go into my kitchen after I’ve eaten, you might see a plate or a crumb. That’s a clue that I was there. There are clues at the planetary level too. A biomarker – a clue that says life was there – can be anything that was produced by life. The clue can be chemical, because chemicals comprise everything. I am a sack of chemicals, just like this podium is a sack of chemicals. Just what chemicals there are, and in what proportion to each other, and how they’re arranged in 3-D, is what distinguishes me from this. It’s a simple way of distinguishing categories of things.

Chirality is a biomarker as well. What chirality means is that some molecules are mirror images of each other, and the living molecules tend to be a certain handedness. When it comes to amino acids, which are the constituents of the proteins that make up life, living things like to use the left-handed form. And when it comes to the sugars, living things like to use the right-handed form. There are exceptions to these, but that’s a general case.

Isotopes also can be a biomarker. Some molecules come in different isotopic flavors, where some are slightly heavier than others. Living things like the lighter variety, probably because it’s energetically less expensive to process.

Complex polymers also could be biomarkers. Of course, plastic is a complex polymer. The again, we made the plastic. So this whole distinction between natural and unnatural – if humans made it, it’s still biogenic. So think about that. My car is a biosignature. What kind, I’m not sure.

If you’re going to define life in measurable terms, I’d like to keep it really simple. You could define life by what it’s made of, or you could define life by what it does. I like to define life by what it’s made of, because as soon as you say the “does” word, you’re talking about a process. A process is something that happens through time. Then you’ve got to figure out what the sampling rate should be. How often should you look, and how long should the whole experiment take? A process is a little more problematic because it takes time, and you may be wrong about how often to look, or how long you should look for.

Processes – making stuff, reproducing, or evolving – can take place over different time scales. So if you’re only looking at processes, and you have two that are vastly different in their time scales, you won’t be able to do the same experiment to look at them both. So I like to look at life in terms of what it is. Not to say we couldn’t add in a little bit of process-based stuff, but when you look at what life is, it gets simple really fast. It’s unique chemistry, some kind of proportionate chemicals, arranged in some way, and the “arranged in some way” is what I call structure.

If I were looking for life on another planet or a moon, I would look for places where interesting chemistry could happen, so that the ultimate evolution of that chemistry could create a living system. I would think about places like Europa, which has an ocean beneath ice. I would think about other places where ice exists, like comets. I would think about Titan, Saturn’s moon. I would think about all those places where interesting chemistry occurs, because chemistry is clever. You can get all kinds of interesting molecules.

Original Source: NASA Astrobiology

History of the Earth’s Atmosphere Written in Rocks

The Earth and its atmosphere today. Image credit: NASA. Click to enlarge.
Washington, D.C. ?CSI-like? techniques, used on minerals, are revealing the steps that led to evolution of the atmosphere on Earth. President of the Mineralogical Society of America, Douglas Rumble, III, of the Carnegie Institution?s Geophysical Laboratory, describes the suite of techniques and studies over the last five years that have led to a growing consensus by the scientific community of what happened to produce the protective ozone layer and atmosphere on our planet. His landmark paper on the subject appears in the May/June American Mineralogist.

?Rocks, fossils, and other natural relics hold clues to ancient environments in the form of different ratios of isotopes?atomic variants of elements with the same number of protons but different numbers of neutrons,? explained Rumble. ?Seawater, rain water, oxygen, and ozone, for instance, all have different ratios, or fingerprints, of the oxygen isotopes 16O, 17O, and 18O. Weathering, ground water, and direct deposition of atmospheric aerosols change the ratios of the isotopes in a rock revealing a lot about the past climate.? Rumble?s paper describes how geochemists, mineralogists, and petrologists are studying anomalies of isotopes of oxygen and sulfur to piece together what happened to our atmosphere from about 3.9 billion years ago, when the crust of our planet was just forming and there was no oxygen in the atmosphere, to a primitive oxygenated world 2.3 billion years ago, and then to the present.

The detective work involves a pantheon of scientists who have analyzed surface minerals from all over the globe, used rockets and balloons to sample the stratosphere, collected and studied ice cores from Antarctica, conducted lab experiments, and run mathematical models. The synthesis from the different fields and techniques points to ultraviolet (UV) light from the Sun as an important driving force in atmospheric evolution. Solar UV photons drive the production of ozone in the atmosphere and yield ozone that is enriched in 17O and 18O, thereby leaving a tell-tale isotopic signature. The ozone layer began to form as the atmosphere gained oxygen, and has since shielded our planet from harmful solar rays and made life possible on Earth?s surface.

The discovery of isotope anomalies, where none were previously suspected, adds a new tool to research on the relationships between shifts in atmospheric chemistry and climate change. Detailed studies of polar-ice cores and exposed deposits in Antarctic dry valleys may improve our understanding of the history of the ozone hole.

Original Source: Carnegie Institution News Release

Low Oxygen Accelerated the Great Dying

The biggest mass extinction in Earth history some 251 million years ago was preceded by elevated extinction rates before the main event and was followed by a delayed recovery that lasted for millions of years. New research by two University of Washington scientists suggests that a sharp decline in atmospheric oxygen levels was likely a major reason for both the elevated extinction rates and the very slow recovery.

Earth’s land at the time was still massed in a supercontinent called Pangea, and most of the land above sea level became uninhabitable because low oxygen made breathing too difficult for most organisms to survive, said Raymond Huey, a UW biology professor.

What’s more, in many cases nearby populations of the same species were cut off from each other because even low-altitude passes had insufficient oxygen to allow animals to cross from one valley to the next. That population fragmentation likely increased the extinction rate and slowed recovery following the mass extinction, Huey said.

“Biologists have previously thought about the physiological consequences of low oxygen levels during the late Permian period, but not about these biogeographical ones,” he said.

Atmospheric oxygen content, about 21 percent today, was a very rich 30 percent in the early Permian period. However, previous carbon-cycle modeling by Robert Berner at Yale University has calculated that atmospheric oxygen began plummeting soon after, reaching about 16 percent at the end of the Permian and bottoming out at less than 12 percent about 10 million years into the Triassic period.

“Oxygen dropped from its highest level to its lowest level ever in only 20 million years, which is quite rapid, and animals that once were able to cross mountain passes quite easily suddenly had their movements severely restricted,” Huey said.

He calculated that when the oxygen level hit 16 percent, breathing at sea level would have been like trying to breathe at the summit of a 9,200-foot mountain today. By the early Triassic period, sea-level oxygen content of less than 12 percent would have been the same as it is today in the thin air at 17,400 feet, higher than any permanent human habitation. That means even animals at sea level would have been oxygen challenged.

Huey and UW paleontologist Peter Ward are authors of a paper detailing the work, published in the April 15 edition of the journal Science. The work was supported by grants from the National Science Foundation and the National Aeronautics and Space Administration’s Astrobiology Institute.

Not only was atmospheric oxygen content dropping at the end of the Permian, the scientists said, but carbon dioxide levels were rising, leading to global climate warming.

“Declining oxygen and warming temperatures would have been doubly stressful for late Permian animals,” Huey said. “As the climate warms, body temperatures and metabolic rates go up. That means oxygen demand is going up, so animals would face an increased oxygen demand and a reduced supply. It would be like forcing athletes to exercise more but giving them less food. They’d be in trouble.”

Ward was lead author of a paper published in Science earlier this year presenting evidence that extinction rates of land vertebrates were elevated throughout the late Permian, likely because of climate change, and culminated in a mass extinction at the end of the Permian. The event, often called “the Great Dying,” was the greatest mass extinction in Earth’s history, killing 90 percent of all marine life and nearly three-quarters of land plants and animals.

Ward said paleontologists had previously assumed that Pangea was not just a supercontinent but also a “superhighway” on which species would have encountered few roadblocks while moving from one place to another.

However, it appears the greatly reduced oxygen actually created impassable barriers that affected the ability of animals to move and survive, he said.

“If this is true, then I think we have to go back and look at oxygen and its role in evolution and how different species developed,” Ward said. “You can go without food for a couple of weeks. You can go without water for a few days. How long can you go without oxygen, a couple of minutes? There’s nothing with a greater evolutionary effect than oxygen.”

Original Source: UW News Release

Did Volcanoes Cause the Great Dying?

For the last three years evidence has been building that the impact of a comet or asteroid triggered the biggest mass extinction in Earth history, but new research from a team headed by a University of Washington scientist disputes that notion.

In a paper published Jan. 20 by Science Express, the online version of the journal Science, the researchers say they have found no evidence for an impact at the time of “the Great Dying” 250 million years ago. Instead, their research indicates the culprit might have been atmospheric warming because of greenhouse gases triggered by erupting volcanoes.

The extinction occurred at the boundary between the Permian and Triassic periods at a time when all land was concentrated in a supercontinent called Pangea. The Great Dying is considered the biggest catastrophe in the history of life on Earth, with 90 percent of all marine life and nearly three-quarters of land-based plant and animal life going extinct.

“The marine extinction and the land extinction appear to be simultaneous, based on the geochemical evidence we found,” said UW paleontologist Peter Ward, lead author of the paper. “Animals and plants both on land and in the sea were dying at the same time, and apparently from the same causes — too much heat and too little oxygen.”

The paper is to be published in the print edition of Science in a few weeks. Co-authors are Roger Buick and Geoffrey Garrison of the UW; Jennifer Botha and Roger Smith of the South African Museum; Joseph Kirschvink of the California Institute of Technology; Michael De Kock of Rand Afrikaans University in South Africa; and Douglas Erwin of the Smithsonian Institution.

The Karoo Basin of South Africa has provided the most intensively studied record of Permian-Triassic vertebrate fossils. In their work, the researchers were able to use chemical, biological and magnetic evidence to correlate sedimentary layers in the Karoo to similar layers in China that previous research has tied to the marine extinction at the end of the Permian period.

Evidence from the marine extinction is “eerily similar” to what the researchers found in the Karoo Basin, Ward said. Over seven years, they collected 126 reptile or amphibian skulls from a nearly 1,000-foot thick section of exposed Karoo sediment deposits from the time of the extinction. They found two patterns, one showing gradual extinction over about 10 million years leading up to the boundary between the Permian and Triassic periods, and the other for a sharp increase in extinction rate at the boundary that then lasted another 5 million years.

The scientists said they found nothing in the Karoo that would indicate a body such as an asteroid hit around the time of the extinction, though they looked specifically for impact clays or material ejected from a crater left by such an impact.

They contend that if there was a comet or asteroid impact, it was a minor element of the Permian extinction. Evidence from the Karoo, they said, is consistent with a mass extinction resulting from catastrophic ecosystem changes over a long time scale, not sudden changes associated with an impact.

The work, funded by the National Aeronautics and Space Administration’s Astrobiology Institute, the National Science Foundation and the National Research Foundation of South Africa, provides a glimpse of what can happen with long-term climate warming, Ward said.

In this case, there is ample evidence that the world got much warmer over a long period because of continuous volcanic eruptions in an area known as the Siberian Traps. As volcanism warmed the planet, large stores of methane gas frozen on the ocean floor might have been released to trigger runaway greenhouse warming, Ward said. But evidence suggests that species began dying out gradually as the planet warmed until conditions reached a critical threshold beyond which most species could not survive.

“It appears that atmospheric oxygen levels were dropping at this point also,” he said. “If that’s true, then high and intermediate elevations would have become uninhabitable. More than half the world would have been unlivable, life could only exist at the lowest elevations.”

He noted that the normal atmospheric oxygen level is around 21 percent, but evidence indicates that at the time of the Great Dying it dropped to about 16 percent — the equivalent of trying to breathe at the top of a 14,000-foot mountain.

“I think temperatures rose to a critical point. It got hotter and hotter until it reached a critical point and everything died,” Ward said. “It was a double-whammy of warmer temperatures and low oxygen, and most life couldn’t deal with it.”

Original Source: UW News Release

Arriving This Week: The Ozone Hole

Image credit: ESA
The smudges of dark blue on this Envisat-derived ozone forecast trace the start of what has unfortunately become an annual event: the opening of the ozone hole above the South Pole.

“Ever since this phenomenon was first discovered in the mid-1980s, satellites have served as an important means of monitoring it,” explained Jos? Achache, ESA Director of Earth Observation Programmes. “ESA satellites have been routinely observing stratospheric ozone concentrations for the last decade.

“And because Envisat’s observations are assimilated into atmospheric models, they actually serve as the basis of an operational ozone forecasting service. These models predict the ozone hole is in the process of opening this week.”

Envisat data show 2004’s ozone hole is appearing about two weeks later than last year’s, but at a similar time period to the average during the last decade. The precise time and range of Antarctic ozone hole occurrences are determined by regional meteorological variations.

The ozone hole typically persists until November or December, when increasing regional temperatures cause the winds surrounding the South Pole to weaken, and ozone-poor air inside the vortex is mixed with ozone-rich air outside it.

The ozone hole of 2002 was an exception to this general pattern, when a late September slowdown of the polar vortex caused the ozone hole to split in two and dissipate early. Envisat’s predecessor mission, ERS-2, monitored the process.

“Envisat carries an instrument called the Scanning Imaging Absorption Spectrometer for Atmospheric Cartography (SCIAMACHY), based on a previous instrument flown aboard ERS-2, called the Global Ozone Monitoring Experiment (GOME),” said Henk Eskes of the Royal Netherlands Meteorological Institute (KNMI). “The two instruments give us a combined data set that stretches over ten years, one that Envisat adds to every day with fresh observations.

“This data set presents a very good means of eventually identifying long-term trends in ozone. Whether or not the ozone layer is starting to recover is a hotly debated topic at the moment.”

The stratospheric ozone layer protects life on Earth from harmful ultraviolet (UV) radiation. The ozone thinning represented here is ultimately caused by the presence of man-made pollutants in the atmosphere such as chlorine, originating from man-made pollutants like chlorofluorocarbons (CFCs).

Now banned under the Montreal Protocol, CFCs were once widely used in aerosol cans and refrigerators. CFCs themselves are inert, but ultraviolet radiation high in the atmosphere breaks them down into their constituent parts, which can be highly reactive with ozone.

Just because they were banned does not mean these long-lived chemicals have vanished from the air, so scientists expect the annual South Polar ozone hole to continue to appear for many years to come.

During the southern hemisphere winter, the atmospheric mass above the Antarctic continent is kept cut off from exchanges with mid-latitude air by prevailing winds known as the polar vortex. This leads to very low temperatures, and in the cold and continuous darkness of this season, polar stratospheric clouds are formed that contain chlorine.

As the polar spring arrives, the combination of returning sunlight and the presence of polar stratospheric clouds leads to splitting of chlorine into highly ozone-reactive radicals that break ozone down into individual oxygen molecules. A single molecule of chlorine has the potential to break down thousands of molecules of ozone.

ESA’s ten-instrument Envisat spacecraft carries three instruments to measure the atmosphere; the results here come from SCIAMACHY, which provides global coverage of the distribution of ozone and other trace gases, as well as aerosols and clouds.

KNMI processes SCIAMACHY data in near-real time as the basis of an operational ozone forecasting service. This is part of a suite of atmospheric information services provided by a project called TEMIS (Tropospheric Emission Monitoring Internet Service) that also includes UV radiation monitoring and forecasting.

TEMIS is backed by ESA as part of the Agency’s Data User Programme, intended to establish viable Earth Observation-based services for communities of users.

The TEMIS atmospheric ozone forecast seen here has atmospheric ozone measured in Dobson Units (DUs), which stands for the total thickness of ozone in a given vertical column if it were concentrated into a single slab at standard temperature and atmospheric pressure ? 400 DUs is equivalent to a thickness of four millimetres, for example.

Envisat results to be revealed
Launched in March 2002, ESA’s Envisat satellite is an extremely powerful means of monitoring the state of our world and the impact of human activities upon it. Envisat carries ten sophisticated optical and radar instruments to observe and monitor the Earth’s atmosphere, land, oceans and ice caps, maintaining continuity with the Agency’s ERS missions started in 1991.

After two and a half years in orbit, more than 700 scientists from 50 countries are about to meet at a special symposium in Salzburg in Austria to review and discuss early results from the satellites, and present their own research activities based on Envisat data.

Starting next Monday, the Envisat Symposium will address almost all fields of Earth science, including atmospheric chemistry, coastal studies, radar and interferometry, winds and waves, vegetation and agriculture, landslides, natural risks, air pollution, ocean colour, oil spills and ice.

There are over 650 being presented at the Symposium, selected by peer review. Presentations will include results on the Prestige oil spill, last year’s forest fires in Portugal, the Elbe flooding in 2002, the evolution of the Antarctic ozone hole, the Bam earthquake and pollution in Europe.

Numerous demonstrations are planned during the week in the ESA Exhibit area. An industrial consortium exhibit on the joint ESA-European Commission Global Monitoring for Environment and Security (GMES) initiative is also planned.

Original Source: ESA News Release

Early Earth was Warm, Despite Less Energy From the Sun

Image credit: Stanford
If a time machine could take us back 4.6 billion years to the Earth’s birth, we’d see our sun shining 20 to 25 percent less brightly than today. Without an earthly greenhouse to trap the sun’s energy and warm the atmosphere, our world would be a spinning ball of ice. Life may never have evolved.

But life did evolve, so greenhouse gases must have been around to warm the Earth. Evidence from the geologic record indicates an abundance of the greenhouse gas carbon dioxide. Methane probably was present as well, but that greenhouse gas doesn’t leave enough of a geologic footprint to detect with certainty. Molecular oxygen wasn’t around, indicate rocks from the era, which contain iron carbonate instead of iron oxide. Stone fingerprints of flowing streams, liquid oceans and minerals formed from evaporation confirm that 3 billion years ago, Earth was warm enough for liquid water.

Now, the geologic record revealed in some of Earth’s oldest rocks is telling a surprising tale of collapse of that greenhouse — and its subsequent regeneration. But even more surprising, say the Stanford scientists who report these findings in the May 25 issue of the journal Geology, is the critical role that rocks played in the evolution of the early atmosphere.

“This is really the first time we’ve tried to put together a picture of how the early atmosphere, early climate and early continental evolution went hand in hand,” said Donald R. Lowe, a professor of geological and environmental science who wrote the paper with Michael M. Tice, a graduate student investigating early life. NASA’s Exobiology Program funded their work. “In the geologic past, climate and atmosphere were really profoundly influenced by development of continents.”

The record in the rocks
To piece together geologic clues about what the early atmosphere was like and how it evolved, Lowe, a field geologist, has spent virtually every summer since 1977 in South Africa or Western Australia collecting rocks that are, literally, older than the hills. Some of the Earth’s oldest rocks, they are about 3.2 to 3.5 billion years old.

“The further back you go, generally, the harder it is to find a faithful record, rocks that haven’t been twisted and squeezed and metamorphosed and otherwise altered,” Lowe says. “We’re looking back just about as far as the sedimentary record goes.”

After measuring and mapping rocks, Lowe brings samples back to Stanford to cut into sections so thin that their features can be revealed under a microscope. Collaborators participate in geochemical and isotopic analyses and computer modeling that further reveal the rocks’ histories.

The geologic record tells a story in which continents removed the greenhouse gas carbon dioxide from an early atmosphere that may have been as hot as 70 degrees Celsius (158 F). At this time the Earth was mostly ocean. It was too hot to have any polar ice caps. Lowe hypothesizes that rain combined with atmospheric carbon dioxide to make carbonic acid, which weathered jutting mountains of newly formed continental crust. Carbonic acid dissociated to form hydrogen ions, which found their way into the structures of weathering minerals, and bicarbonate, which was carried down rivers and streams to be deposited as limestone and other minerals in ocean sediments.

Over time, great slabs of oceanic crust were pulled down, or subducted, into the Earth’s mantle. The carbon that was locked into this crust was essentially lost, tied up for the 60 million years or so that it took the minerals to get recycled back to the surface or outgassed through volcanoes.

The hot early atmosphere probably contained methane too, Lowe says. As carbon dioxide levels fell due to weathering, at some point, levels of carbon dioxide and methane became about equal, he conjectures. This caused the methane to aerosolize into fine particles, creating a haze akin to that which today is present in the atmosphere of Saturn’s moon Titan. This “Titan Effect” occurred on Earth 2.7 to 2.8 billion years ago.

The Titan Effect removed methane from the atmosphere and the haze filtered out light; both caused further cooling, perhaps a temperature drop of 40 to 50 degrees Celsius. Eventually, about 3 billion years ago, the greenhouse just collapsed, Lowe and Tice theorize, and the Earth’s first glaciation may have occurred 2.9 billion years ago.

The rise after the fall
Here the rocks reveal an odd twist in the story — eventual regeneration of the greenhouse. Recall that 3 billion years ago, Earth was essentially Waterworld. There weren’t any plants or animals to affect the atmosphere. Even algae hadn’t evolved yet. Primitive photosynthetic microbes were around and may have played a role in the generation of methane and minor usage of carbon dioxide.

As long as rapid continental weathering continued, carbonate was deposited on the oceanic crust and subducted into what Lowe calls “a big storage facility … that kept most of the carbon dioxide out of the atmosphere.”

But as carbon dioxide was removed from the atmosphere and incorporated into rock, weathering slowed down — there was less carbonic acid to erode mountains and the mountains were becoming lower. But volcanoes were still spewing into the atmosphere large amounts of carbon from recycled oceanic crust.

“So eventually the carbon dioxide level climbs again,” Lowe says. “It may never return to its full glorious 70 degrees Centigrade level, but it probably climbed to make the Earth warm again.”

This summer, Lowe and Tice will collect samples that will allow them to determine the temperature of this time interval, about 2.6 to 2.7 billion years ago, to get a better idea of how hot Earth got.

New continents formed and weathered, again taking carbon dioxide out of the atmosphere. About 3 billion years ago, maybe 10 or 15 percent of the Earth’s present area in continental crust had formed. By 2.5 billion years ago, an enormous amount of new continental crust had formed — about 50 to 60 percent of the present area of continental crust. During this second cycle, weathering of the larger amount of rock caused even greater atmospheric cooling, spurring a profound glaciation about 2.3 to 2.4 billion years ago.

Over the past few million years we have been oscillating back and forth between glacial and interglacial epochs, Lowe says. We are in an interglacial period right now. It’s a transition — and scientists are still trying to understand the magnitude of global climate change caused by humans in recent history compared to that caused by natural processes over the ages.

“We’re disturbing the system at rates that greatly exceed those that have characterized climatic changes in the past,” Lowe said. “Nonetheless, virtually all of the experiments, virtually all of the variations and all of the climate changes that we’re trying to understand today have happened before. Nature’s done most of these experiments already. If we can analyze ancient climates, atmospheric compositions and the interplay among the crust, atmosphere, life and climate in the geologic past, we can take some first steps at understanding what is happening today and likely to happen tomorrow.”

Original Source: Stanford News Release