Solar flares pose a major hazard to electronics and infrastructure in Low Earth Orbit, but they may have played a role in kick-starting life on Earth. Credit: NASA/SDO/J. Major
This big! The M1.7-class flare that erupted from active region 1461 on Monday, April 16 let loose an enormous coronal mass ejection many, many times the size of Earth, making this particular writer very happy that our planet was safely tucked out of aim at the time… and 93 million miles away.
The image above was obtained by NASA’s Solar Dynamics Observatory’s AIA 304 imaging instrument on Monday during the height of the event. I rotated the disk of the Sun 90 degrees to get a landscape look over the eastern limb, cropped it down and then added an Earth image to scale — just to show how fantastically huge our home star really is.
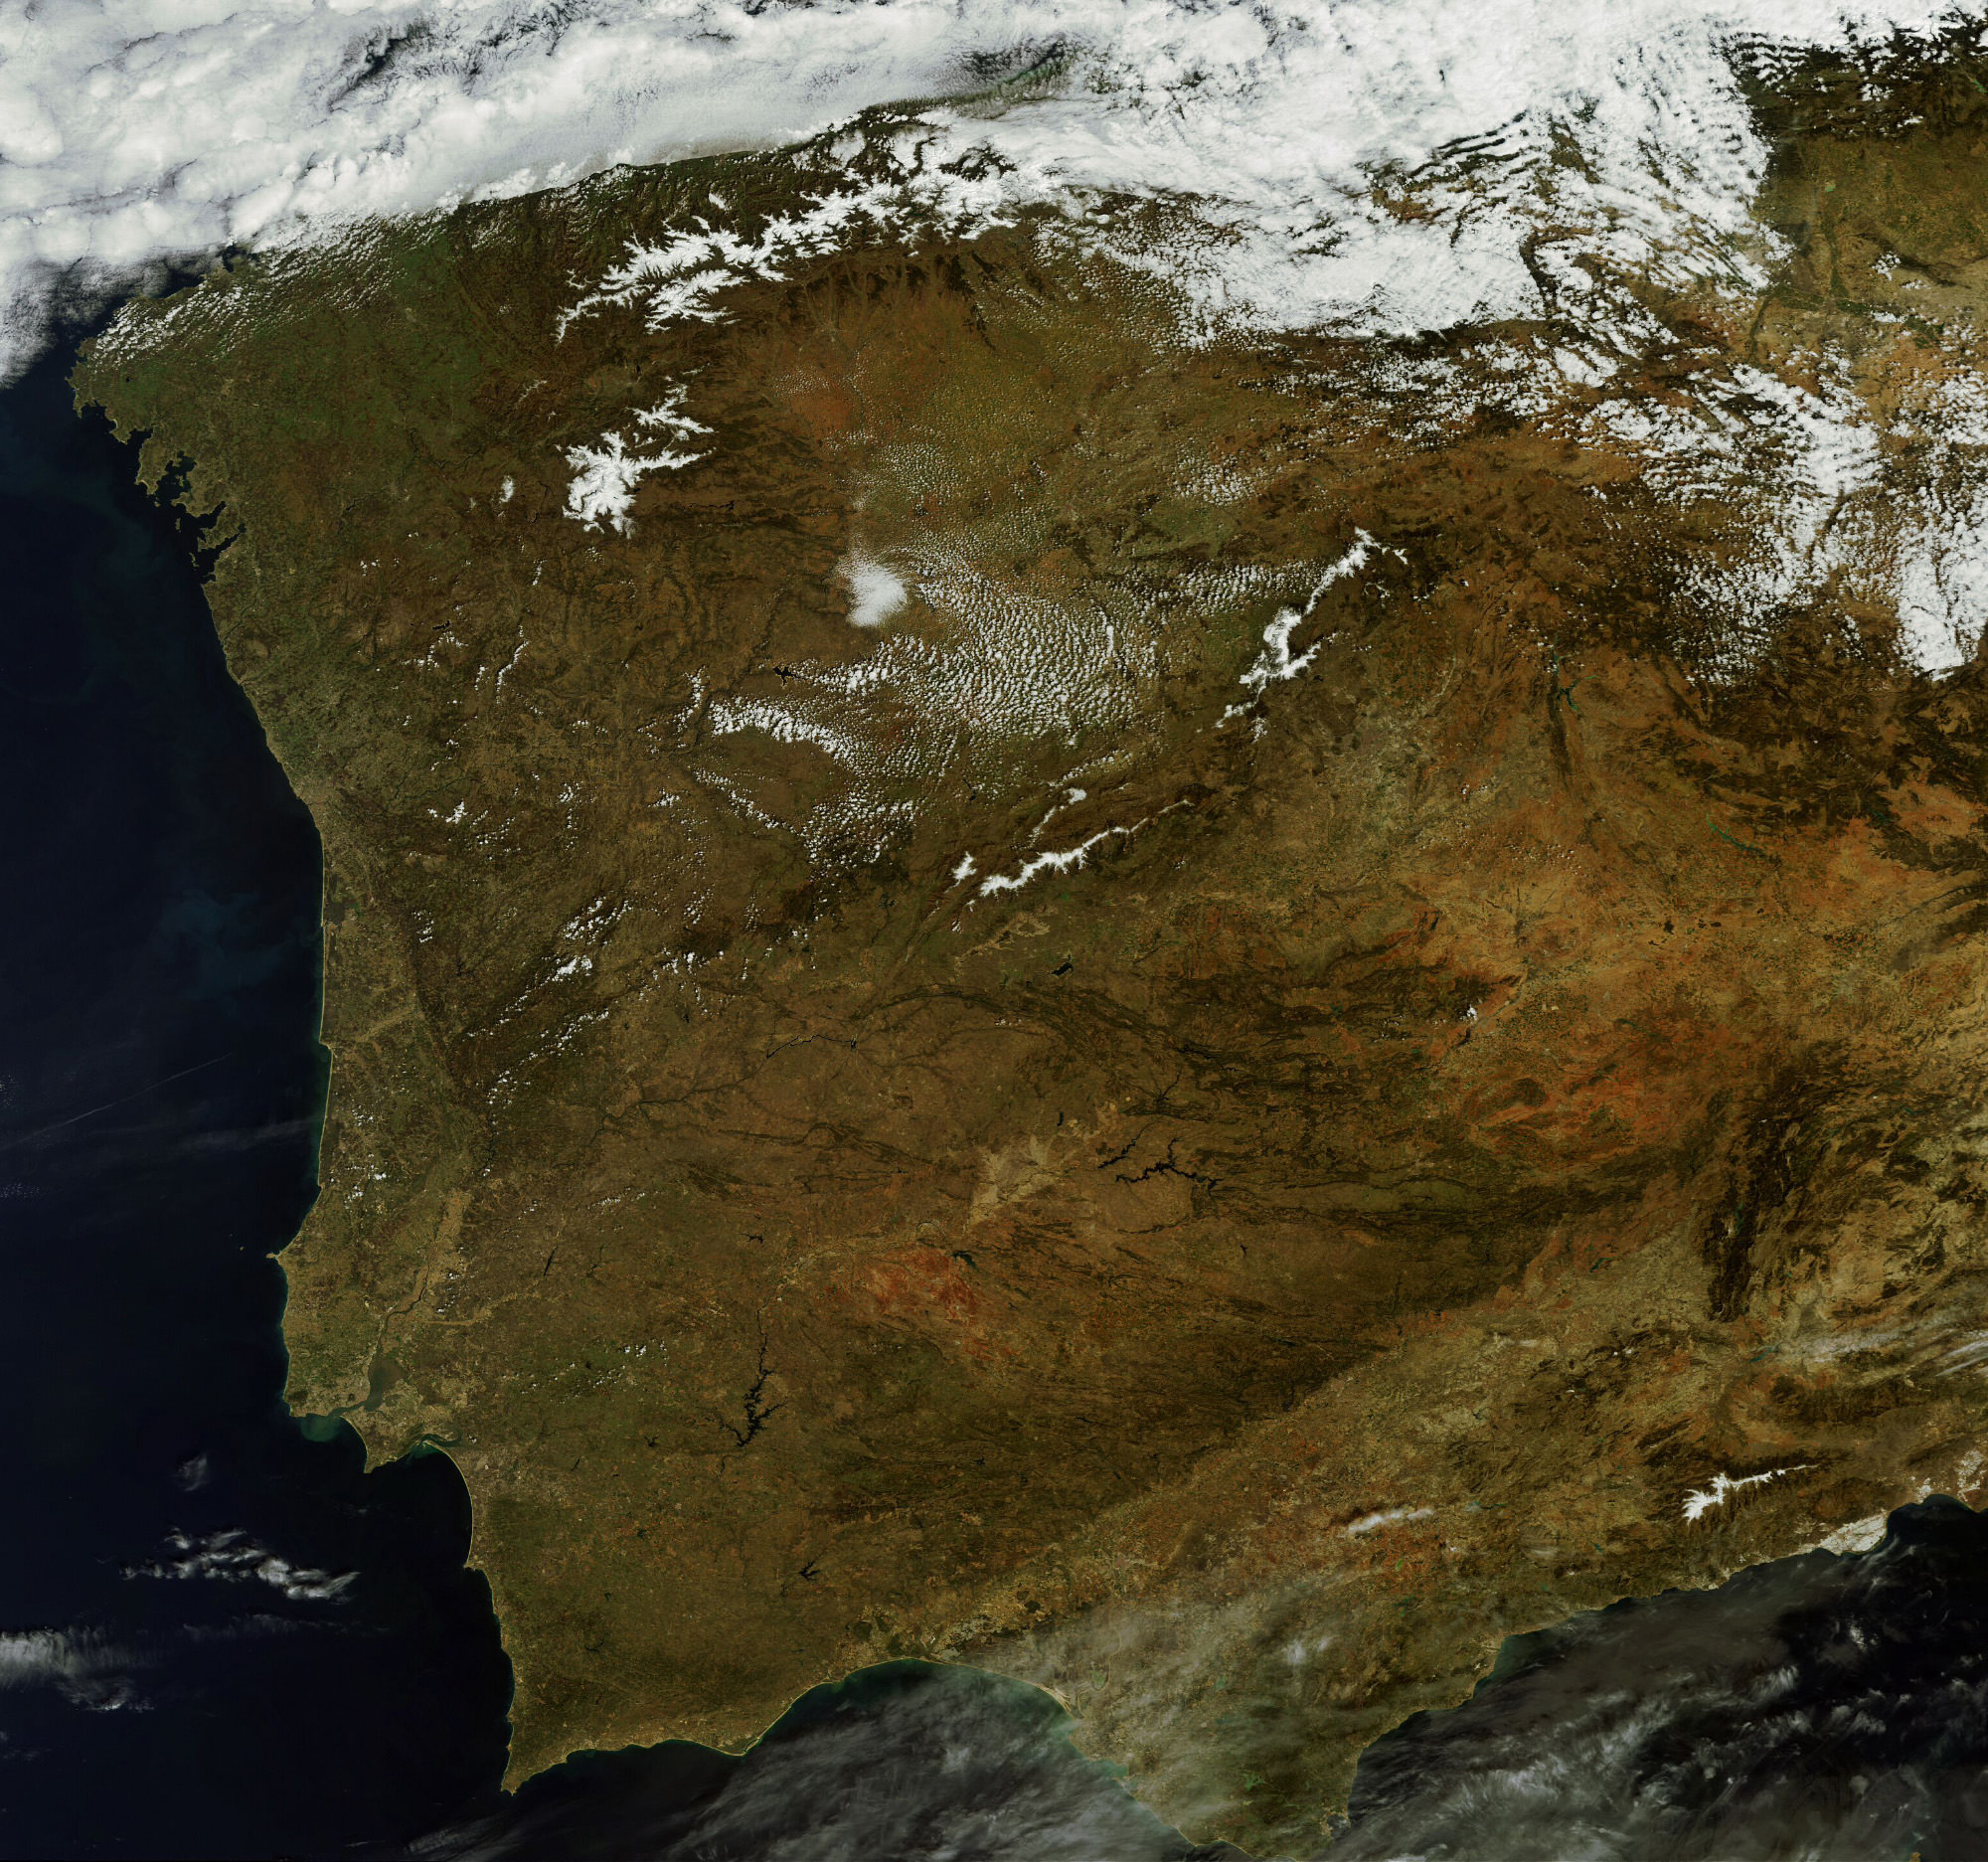
This MERIS image of Spain and Portugal could be Envisat's last. (Chelys/EOsnap)
[/caption]
The European Space Agency’s venerable Envisat satellite may have sent back its final image, according to recent news from the Agency.
On April 8, ESA lost communication with the Earth-observation satellite, preventing reception of data as it passed over the Kiruna station in Sweden. Although it’s been confirmed that the satellite is still in orbit, the recovery team has not been able to re-establish contact.
The image above, showing part of the Iberian peninsula, was from the last data to be received from Envisat before it fell silent.
Radar image of Envisat. (Fraunhofer Institute for High Frequency Physics and Radar Techniques.)
Launched in March 2002, Envisat has been helping researchers examine our planet for over ten years — five years longer than its original mission duration. It has completed more than 50,000 orbits and returned thousands of images, as well as a wealth of data about the land, oceans and atmosphere.
Envisat data was instrumental in over 4,000 projects from 70 countries.
Germany’s Tracking and Imaging Radar captured an image of the satellite, revealing that it is still intact and in a stable orbit. Still, all attempts at recovery have so far been unsuccessful.
A contingency agreement with the Canadian Space Agency on Radarsat will be activated to fulfill user requirements if Envisat cannot be brought back online.
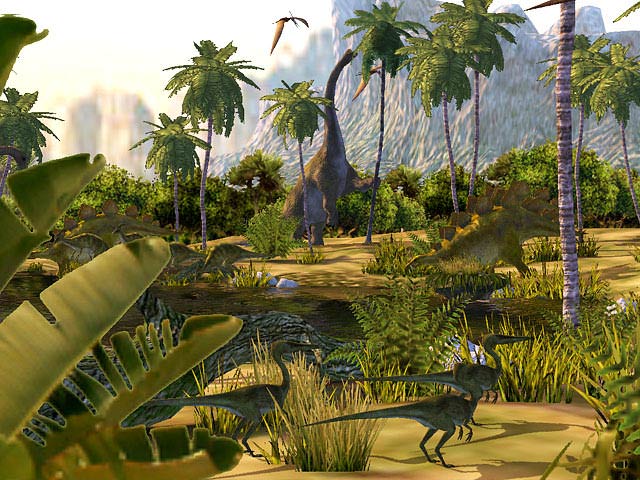
I for one welcome our alien dinosaur overlords…maybe.
Dinosaurs once roamed and ruled the Earth. Is it possible that similar humongous creatures may have evolved on another planet – a world that DIDN’T get smacked by an asteroid – and later they developed to have human-like, intelligent brains? A recent paper discussing why the biochemical signature of life on Earth is so consistent in orientation somehow segued into the possibility that advanced versions of T. Rex and other dinosaurs may be the life forms that live on other worlds. The conclusion? “We would be better off not meeting them,” said scientist Ronald Breslow, author of the paper.
The building blocks of terrestrial amino acids, sugars, and the genetic materials DNA and RNA have two possible orientations, left or right, which mirror each other in what is called chirality. On Earth, with the exception of a few bacteria, amino acids have the left-handed orientation. Most sugars have a right-handed orientation. How did that homochirality happen?
If meteorites carried specific types of amino acids to Earth about 4 billion years, that could have set the pattern the left-handed chirality in terrestial proteins.
“Of course,” Breslow said in a press release, “showing that it could have happened this way is not the same as showing that it did. An implication from this work is that elsewhere in the universe there could be life forms based on D-amino acids and L-sugars. Such life forms could well be advanced versions of dinosaurs, if mammals did not have the good fortune to have the dinosaurs wiped out by an asteroidal collision, as on Earth.”
But not everyone was impressed with the notion of dinosaurs from space. “None of this has anything to do with dinosaurs,” wrote science author Brian Switek in the Smithsonian blog Dinosaur Tracking. “As much as I’m charmed by the idea of alien dinosaurs, Breslow’s conjecture makes my brain ache. Our planet’s fossil record has intricately detailed the fact that evolution is not a linear march of progress from one predestined waypoint to another. Dinosaurs were never destined to be. The history of life on earth has been greatly influenced by chance and contingency, and dinosaurs are a perfect example of this fact.”
An impact between a Mars-sized protoplanet and early Earth is the most widely-accepted origin of the Moon. Did smaller impacts seed the formation of continents? (NASA/JPL-Caltech)
[/caption]
Recent research on lunar samples has shown that the Moon may be made of more Earth than green cheese — if by “green cheese” you mean the protoplanet impactor that was instrumental in its creation.
It’s an accepted hypothesis that Earth’s moon was created during an ancient, violet collision between our infant planet and a Mars-sized world called Theia, an event that destroyed Theia and sent part of Earth’s crust and upper mantle into orbit as a brief-lived ring of molten material. This material eventually coalesced to form the Moon, and over the next 4.5 billion years it cooled, became tidally locked with Earth, accumulated countless craters and gradually drifted out to the respectable distance at which we see it today.
Theia’s remains were once assumed to have been a major contributor to the material that eventually formed the Moon. Lunar samples, however, showed that the ratio of oxygen isotopes on the Moon compared to Earth were too similar to account for such a formation. Now, further research by a team led by scientists from The University of Chicago shows that titanium isotopes — an element much more refractive than oxygen — are surprisingly similar between the Moon and Earth, further indicating a common origin.
“After correcting for secondary effects associated with cosmic-ray exposure at the lunar surface using samarium and gadolinium isotope systematics, we find that the 50Ti/47Ti ratio of the Moon is identical to that of the Earth within about four parts per million, which is only 1/150 of the isotopic range documented in meteorites,” wrote University of Chicago geophysicist Junjun Zhang, lead author of the paper published in the journal Nature Geoscience on March 25.
If the Moon is more Earth than Theia, then what happened to the original impacting body? Perhaps it was made of heavier stuff that sunk deeper into the Moon, or was assimilated into Earth’s mantle, or got lost to space… only more research will tell.
But for now, you can be fairly sure that when you’re looking up at the Moon you’re seeing a piece of Earth, the cratered remnants of a collision that took place billions of years ago.
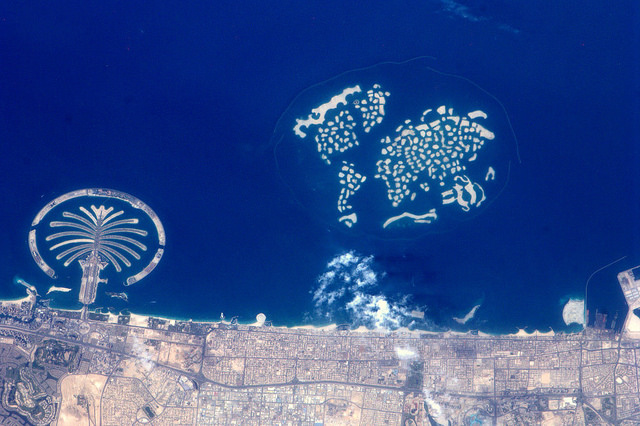
The Palm and The World Islands, Dubai. Credit: NASA/ESA
[/caption]
Usually astronauts have to go much farther away than low Earth orbit to see the entire world in one view, but The World Islands resorts in Dubai provides a unique — if not manufactured — view of Earth’s continents from space. The World Islands are a collection of man-made islands shaped into the continents of the world, and ultimately will consist of 300 small private artificial islands divided into four categories – private homes, estate homes, dream resorts, and community islands.
To the east is another man-made archipelago named The Palm, for obvious reasons, and another island chain is due to be built between these reclaimed lands which will be called The Universe.
ESA astronaut André Kuipers took this image on April 10, 2012 during his long duration mission on the International Space Station. See more of his images at the ESA FLickr page.
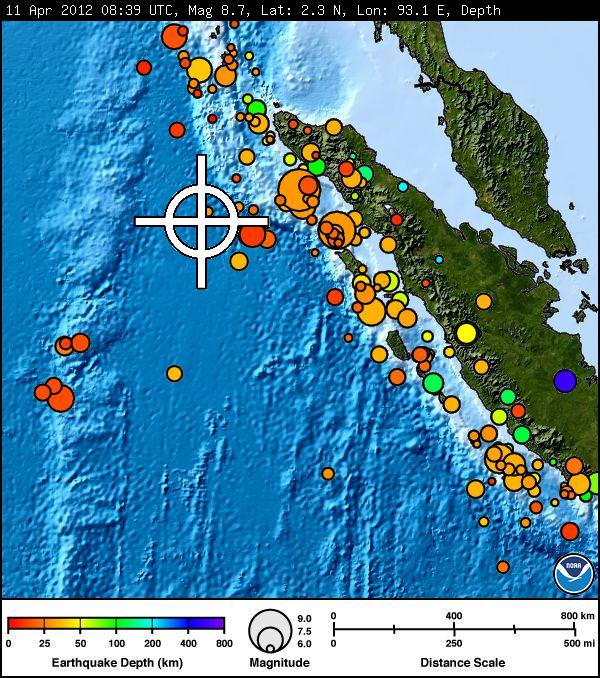
A preliminary earthquake map from the Pacific Tsunami Warning Center showing depth and magnitudes of the quake and aftershocks off the coast of Indonesia on April 11, 2012. Credit: NOAA
[/caption]
Update: Good news: The latest bulletin from the Pacific Tsunami Warning Center, as of 13:00 UTC has canceled the tsunami watch. See here fore more details.
An Indian-ocean-wide tsunami watch is in effect after a massive earthquake off the coast of Indonesia. The quake had a preliminary magnitude of 8.7, and the U.S. Geological Survey said it was centered 32 km (20 miles) beneath the ocean floor about 191 km (308 miles) from the provincial capital of Banda Aceh, the westernmost province in Indonesia. Major aftershocks have occurred, some with magnitudes as high as 8.3.
The tsunami watch area is now reduced from the first reports, as the USGS said the earthquake “moved horizontally, not vertically” but initially included Indonesia, India, Sri Lanka, the Maldives and parts of the UK. A tsunami watch means there is the potential for a tsunami, not that one is imminent.
The earthquake took place at 08:39 UTC on April 11, at 2.3 degrees north and 93.1 degrees east, off the west coast of Northern Sumatra. Reports from Reuters and AP now say that although measurable, the tsunami “does not look major,” officials said.
The Washington Post reported early after the initial quake that a wave measuring less than 30 inches (80 centimeters) high, rolled to Indonesia’s coast, and first reports said there were no other signs of serious damage. But then an 8.2-magnitude aftershock hit, and another tsunami warning was issued, and people along the western coast of Sumatra island and the Mentawai islands were told to stay clear of coasts.
The latest from the Pacific Tsunami Warning Center reports these measurements for tsunami wave activity:
GAUGE LOCATION LAT LON TIME AMPL PER
——————- —– —— —– ————— —–
TRINCONMALEE LK 8.6N 81.2E 1116Z 0.04M / 0.1FT 18MIN
COCOS ISLAND AU 12.1S 96.9E 1102Z 0.08M / 0.3FT 18MIN
TELUKDALAM ID 0.6N 97.8E 1045Z 0.19M / 0.6FT 10MIN
SABANG ID 5.8N 95.3E 1010Z 0.36M / 1.2FT 06MIN
MEULABOH ID 4.1N 96.1E 1007Z 1.06M / 3.5FT 12MIN
DART 23401 8.9N 88.5E 0956Z 0.03M / 0.1FT 06MIN
We’ll provide more information as it becomes available.
I was traveling the day this video was released, so missed posting it earlier. If you haven’t seen it yet, this animation of ocean surface currents is just mesmerizing. It shows ocean currents from June 2005 to December 2007, created with data from NASA satellites. In the video you can see how bigger currents like the Gulf Stream in the Atlantic Ocean and the Kuroshio in the Pacific carry warm waters across thousands of kilometers at speeds greater than six kilometers per hour 4 mph), as well as seeing how thousands of other ocean create slow-moving, circular pools called eddies. The entire visualization is reminiscent of Vincent Van Gogh’s “Starry Night” painting. Continue reading “Earth’s Van Gogh Oceans”
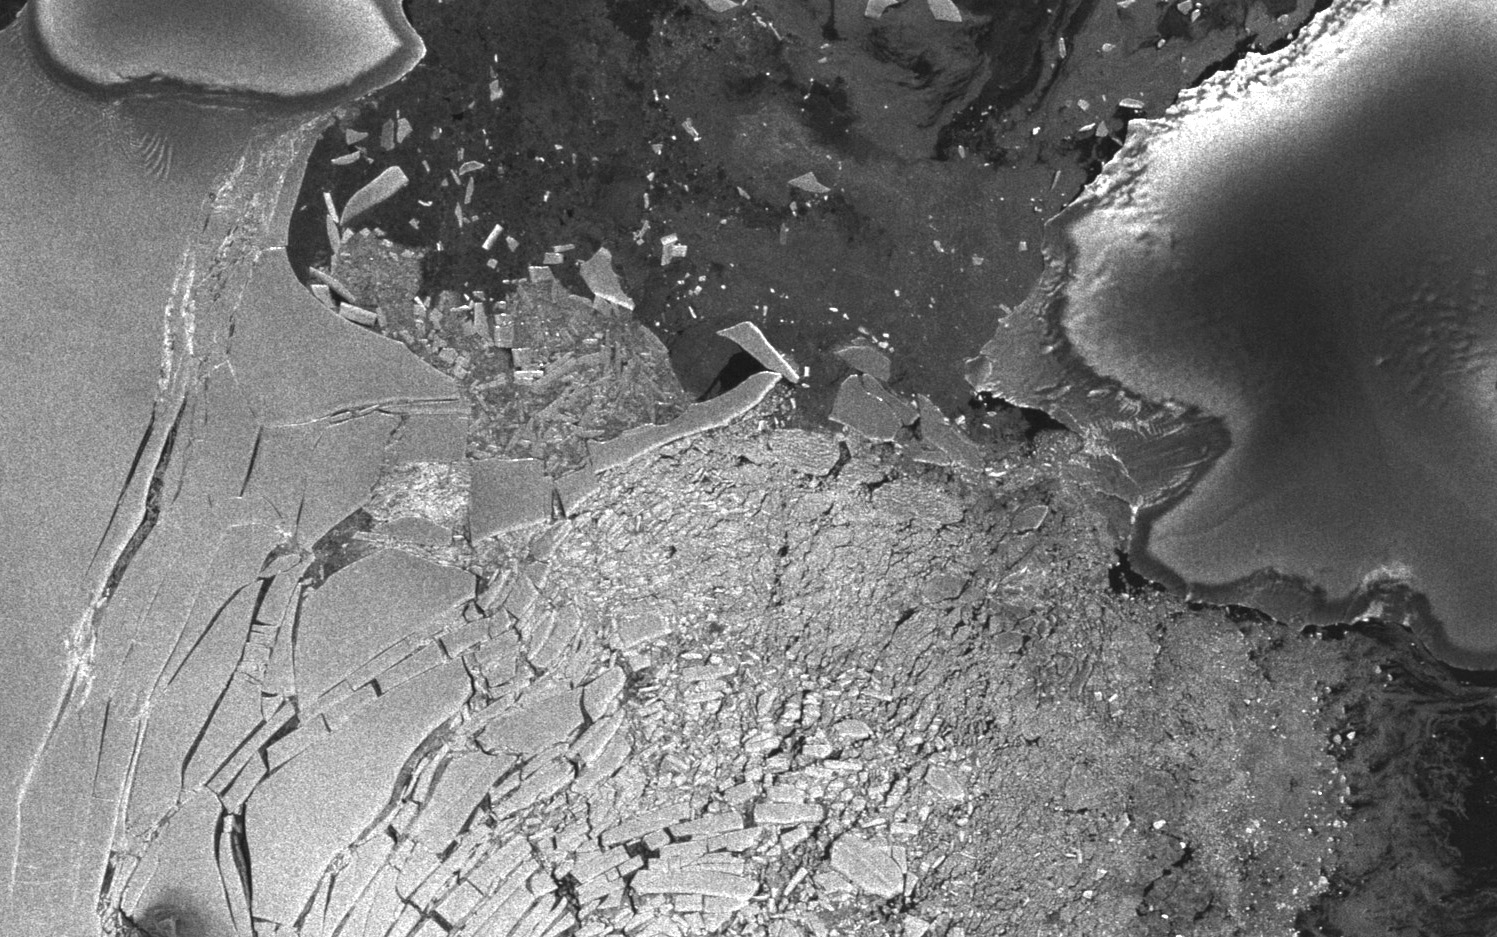
The disintegrated Wilkins Ice Shelf in April 2009. (Chelys/EOSnap)
[/caption]
A paper published in the journal Science in August 1981 made several projections regarding future climate change and anthropogenic global warming based on manmade CO2 emissions. As it turns out, the authors’ projections have proven to be rather accurate — and their future is now our present.
The paper, written by a team of atmospheric physicists led by the now-controversial James Hansen at NASA’s Institute for Space Studies at Goddard Space Flight Center, was recently rediscovered by researchers Geert Jan van Oldenborgh and Rein Haarsma from the Royal Netherlands Meteorological Institute (KNMI). Taking a break from research due to illness, the scientists got a chance to look back through some older, overlooked publications.
“It turns out to be a very interesting read,” they noted in their blog on RealClimate.org.
Even though the paper was given 10 pages in Science, it covers a lot of advanced topics related to climate — indicating the level of knowledge known about climate science even at that time.
“The concepts and conclusions have not changed all that much,” van Oldenborgh and Haarsma note. “Hansen et al clearly indicate what was well known (all of which still stands today) and what was uncertain.”
Within the paper, several graphs note the growth of atmospheric carbon dioxide, both naturally occurring and manmade, and projected a future rise based on the continued use of fossil fuels by humans. Van Oldenborgh and Haarsma overlaid data gathered by NASA and KNMI in recent years and found that the projections made by Hansen et al. were pretty much spot-on.
If anything, the 1981 projections were “optimistic”.
Data from the GISS Land-Ocean Temperature Index fit rather closely with the 1981 projection (van Oldenborgh and Haarsma)
Hansen wrote in the original paper:
“The global temperature rose by 0.2ºC between the middle 1960’s and 1980, yielding a warming of 0.4ºC in the past century. This temperature increase is consistent with the calculated greenhouse effect due to measured increases of atmospheric carbon dioxide. Variations of volcanic aerosols and possibly solar luminosity appear to be primary causes of observed fluctuations about the mean rend of increasing temperature. It is shown that the anthropogenic carbon dioxide warming should emerge from the noise level of natural climate variability by the end of the century, and there is a high probability of warming in the 1980’s. Potential effects on climate in the 21st century include the creation of drought-prone regions in North America and central Asia as part of a shifting of climate zones, erosion of the West Antarctic ice sheet with a consequent worldwide rise in sea level, and opening of the fabled Northwest Passage.”
Now here we are in 2012, looking down the barrel of the global warming gun Hansen and team had reported was there 31 years earlier. In fact, we’ve already seen most of the predicted effects take place.
The retreat of Pedersen Glacier in Alaska. Left: summer 1917. Right: summer 2005. Source: The Glacier Photograph Collection, National Snow and Ice Data Center/World Data Center for Glaciology.
And that’s not the only prediction that seems to have uncannily come true.
“In light of historical evidence that it takes several decades to complete a major change in fuel use, this makes large climate change almost inevitable,” Hansen et al wrote in anticipation of the difficulties of a global shift away from dependence on carbon dioxide-emitting fossil fuels.
“CO2 effects on climate may make full exploitation of coal resources undesirable,” the paper concludes. “An appropriate strategy may be to encourage energy conservation and develop alternative energy sources, while using fossil fuels as necessary during the next few decades.”
As the “next few decades” are now, for us, coming to a close, where do we stand on the encouragement of energy conservation and development on alternative energy sources? Sadly the outlook is not as promising as it should be, not given our level of abilities to monitor the intricate complexities of our planet’s climate and to develop new technologies. True advancement will rely on our acceptance that a change is in fact necessary… a hurdle that is proving to be the most difficult one to clear.
Read van Oldenborgh and Haarsma’s blog post here, and see the full 1981 paper “Climate Impact of Increasing Carbon Dioxide” here. And for more news on our changing climate, visit NASA’s Global Climate Change site.
Tip of the anthropogenically-warmer hat to The Register.
Earth just doesn’t make crust like it used to… at least, not according to new research by a team of scientists in the UK.
Researchers with the Universities of Bristol, St Andrews and Portsmouth have studied elements trapped within zircon samples gathered from all over the planet to peer billions of years back in time at how Earth’s crust was being produced.
Zircon, a mineral found in granite, can be dated with precision and is thus an accurate measure for geologic timescales.
What they found was that 65% of our planet’s current crust had already existed 3 billion years ago. Since rocks older than 2.5 billion years are rare on Earth today, this means that some process began to take place that either reworked — or destroyed — a large portion of the older crust, and changed how new crust was formed.
During the first 1.5 billion years of Earth’s history, the team reports, the rate of crust formation was high — approximately 3 cubic kilometers was added to the continents each year. After that the rate dropped substantially, falling to about 0.8 cubic kilometers per year for the next 3 billion years — right up to the present day.
The cause is yet unknown, but it may be the result of the onset of plate tectonics driven by subduction — the process by which sections of Earth’s crust (“plates”) slide beneath other sections, sinking into the underlying mantle to be liquefied into magma by pressure and heat. New crust is created when the magma rises again where the plates separate… Earth’s current “conveyor belt” of crust formation.
Whatever process was in place prior to 3 billion years ago, it was much more efficient at creating crust.
“Such a sharp decrease in the crustal growth rate about 3 billion years ago indicates a dramatic change in the way the continental crust was generated and preserved,” said Dr. Bruno Dhuime of the University of Bristol’s School of Earth Sciences. “This change may in turn be linked to the onset of subduction-driven plate tectonics and discrete subduction zones as observed at the present day. The next challenge is to determine which tectonic regime shaped the Earth’s crust in the planet’s first 1.5 billion years before this change.”
The team’s paper “A Change in the Geodynamics of Continental Growth 3 Billion Years Ago” (Bruno Dhuime, Chris J. Hawkesworth, Peter A. Cawood, Craig D. Storey) was published March 16 in Science.
Read more on the University of Bristol’s press release here.
You’ve seen all the videos and images we’ve been featuring lately that astronauts on the International Space Station have taken of Earth from orbit. The one ubiquitous feature is the amount of lights showing up from cities and towns around the world.