As the philosopher Nietzsche famously said “He who would learn to fly one day must first learn to stand and walk and run and climb and dance; one cannot fly into flying.” This is certainly true when it comes to humanity’s understanding of the universe, something which has evolved over many thousands of years and been the subject of ongoing discovery.
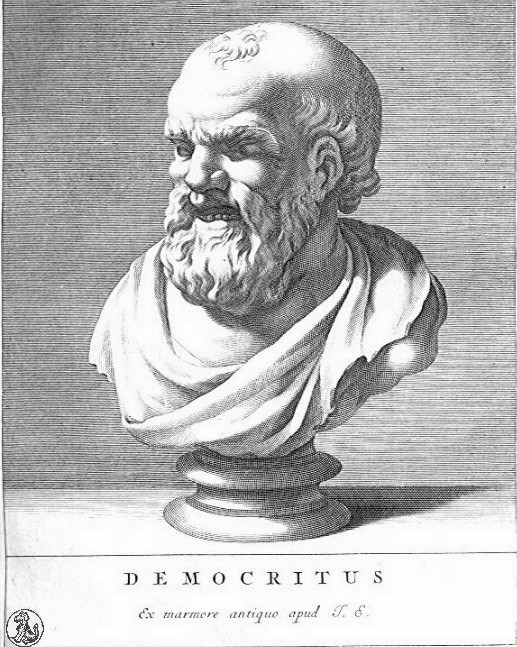
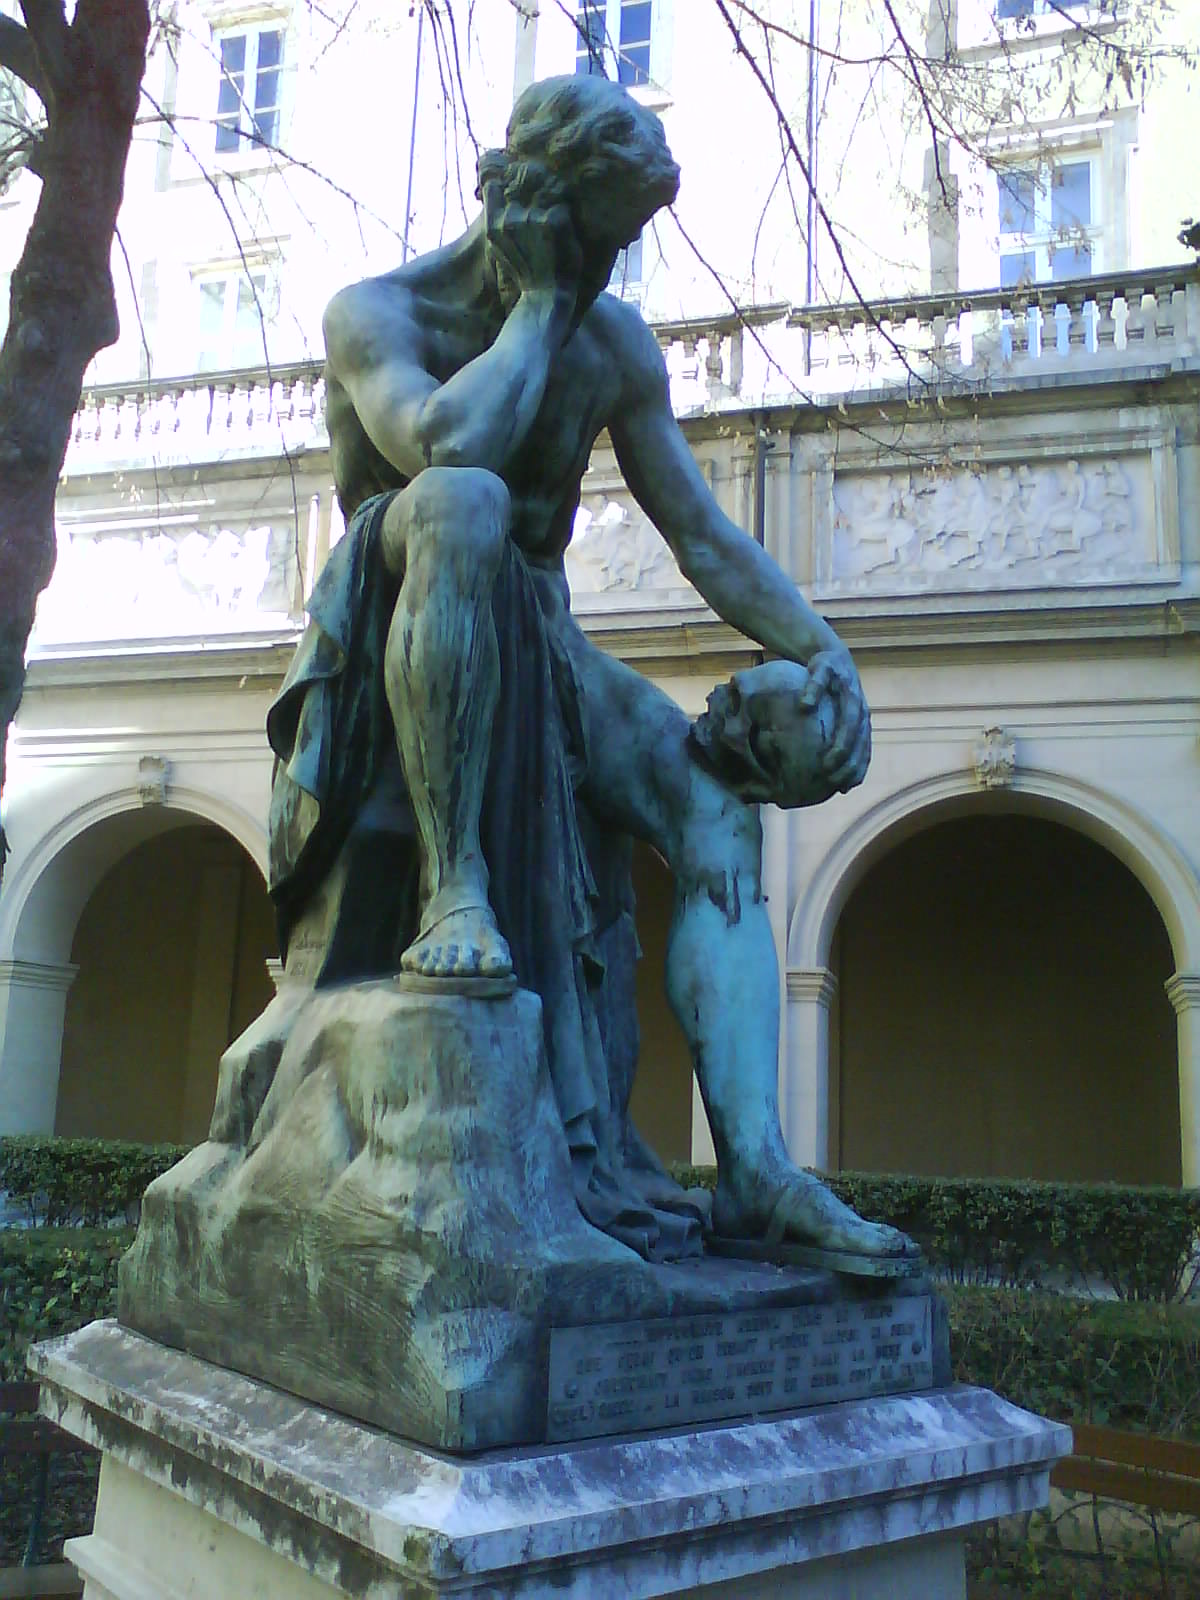
And along the way, many names stand out as examples of people who achieved breakthroughs and helped lay the foundations of our modern understanding. One such person is Democritus, an ancient Greek philosopher who is viewed by many as being the “father of modern science”. This is due to his theory of universe that is made up of tiny “atoms”, which bears a striking resemblance to modern atomic theory.
Though he is typically viewed as one of Greece’s many pre-Socratic natural philosopher, many historians have argued that he is more rightly classified as a scientist, at least when compared to his contemporaries. There has also been significant controversy – particularly in Germany during the 19th century – over whether or not Democritus deserves credit for atomic theory.
This argument is based on the relationship Democritus had with contemporary philosopher Leucippus, who is renowned for sharing his theory about atoms with him. However, their theories came down to a different basis, a distinction that allows Democritus to be given credit for a theory that would go on to become a staple of the modern scientific tradition.

Birth and Early Life:
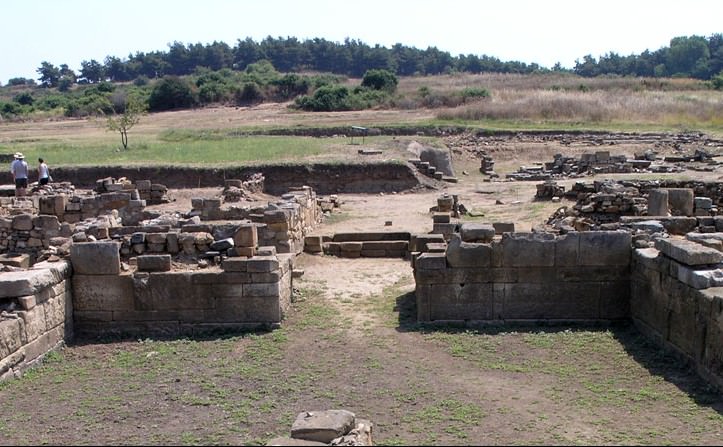
The precise date and location of Democritus birth is the subject the debate. While most sources claim he was born in Abdera, located in the northern Greek province of Thrace, around 460 BCE. However, other sources claim he was born in Miletus, a coastal city of ancient Anatolia and modern-day Turkey, and that he was born in 490 BCE.
It has been said that Democritus’ father was from a noble family and so wealthy that he received the Persian king Xerxes on the latter’s march through Abdera during the Second Persian War (480–479 BC). It is further argued that as a reward for his service, the Persian monarch gave his father and other Abderites gifts, and left several Magi among them. Democritus was apparently instructed by these Magi in astronomy and theology.
After his father had died, Democritus used his inheritance to finance a series of travels to distant countries. Desiring to feed his thirst for knowledge, Democritus traveled extensively across the known world, traveling to Asia, Egypt and (according to some sources) venturing as far as India and Ethiopia. His writings include descriptions of the the cities of Babylon and Meroe (in modern-day Sudan).
Upon returning to his native land, he occupied himself with the study of natural philosophy. He also traveled throughout Greece to acquire a better knowledge of its cultures and learned from many of Greece’s famous philosophers. His wealth allowed him to purchase their writings, and he wrote of them in his own works. In time, he would become one of the most famous of the pre-Socratic philosophers.
Leucippus of Miletus had the greatest influence on him, becoming his mentor and sharing his theory of atomism with him. Democritus is also said to have known Anaxagoras, Hippocrates and even Socrates himself (though this remains unproven). During his time in Egypt, he learned from Egyptian mathematicians, and is said to have become acquainted with the Chaldean magi in Assyria.
In the tradition of the atomists, Democritus was a thoroughgoing materialists who viewed the world in terms of natural laws and causes. This differentiated him from other Greek philosophers like Plato and Aristotle, for whom philosophy was more teleological in nature – i.e. more concerned with the purpose of events rather than the causes, as well things like essence, the soul, and final causes.
According to the many descriptions and anecdotes about Democritus, he was known for his modesty, simplicity, and commitment to his studies. One story claims he blinded himself on purpose in order to be less distracted by worldly affairs (which is believed to be apocryphal). He was also known for his sense of humor and is commonly referred to as the “Laughing Philosopher” – for his capacity to laugh at human folly. To his fellow citizens, he was also known as “The Mocker”.
Scientific Contributions:
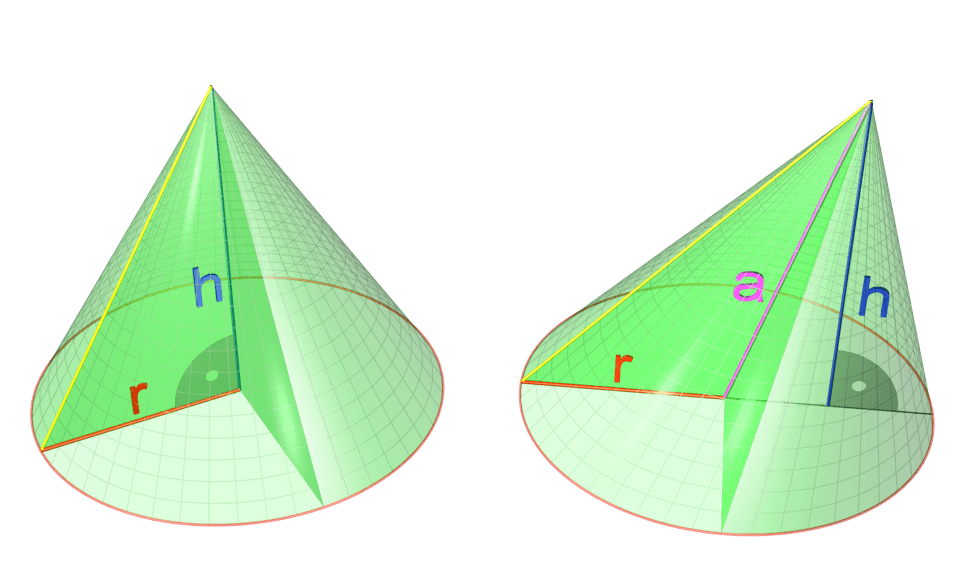
Democritus is renowned for being a pioneer of mathematics and geometry. He was among the first Greek philosophers to observe that a cone or pyramid has one-third the volume of a cylinder or prism with the same base and height. While none of his works on the subject survived the Middle Ages, his mathematical proofs are derived from other works with contain extensive citations to titles like On Numbers, On Geometrics, On Tangencies, On Mapping, and On Irrationals.
Democritus is also known for having spent much of his life experimenting with and examining plants and minerals. Similar to his work in mathematics and geometry, citations from existing works are used to infer the existence of works on the subject. These include On the Nature of Man, the two-volume collection On Flesh, On Mind, On the Senses, On Flavors, On Colors, Causes concerned with Seeds and Plants and Fruits, and to the three-volume collection Causes concerned with Animals.
From his examination of nature, Democritus developed what could be considered some of the first anthropological theories. According to him, human beings lived short lives in archaic times, forced to forage like animals until fear of wild animals then drove them into communities. He theorized that such humans had no language, and only developed it through the need to articulate thoughts and ideas.
Through a process of trial and error, human beings developed not only verbal language, but also symbols with which to communicate (i.e. written language), clothing, fire, the domestication of animals, and agriculture. Each step in this process led to more discoveries, more complex behaviors, and the many things that came to characterize civilized society.
In terms of astronomy and cosmology, Democritus was a proponent of the spherical Earth hypothesis. He believed that in the original chaos from which the universe sprang, the universe was composed of nothing but tiny atoms that came together to form larger units (a theory which bears a striking resemblance to The Big Bang Theory and Nebular Theory). He also believed in the existence of many worlds, which were either in state of growth or decay.
In a similar vein, Democritus advanced a theory of void which challenged the paradoxes raised by his fellow Greek philosophers, Parmenides and Zeno – the founders of metaphysical logic. According to these men, movement cannot exist because such a thing requires there to be a void – which is nothing, and therefore cannot exist. And a void cannot be termed as such if it is in fact a definable, existing thing.
To this, Democritus and other atomists argued that since movement is an observable phenomena, there must be a void. This idea previewed Newton’s theory of absolute space, in which space exists independently of any observer or anything external to it. Einstein’s theory of relativity also provided a resolution to the paradoxes raised by Parmenides and Zeno, where he asserted that space itself is relative and cannot be separated from time.
Democritus’ thoughts on the nature of truth also previewed the development of the modern scientific method. According to Democritus, truth is difficult, because it can only be perceived through senses-impressions which are subjective. Because of this, Aristotle claimed in his Metaphysics that Democritus was of the opinion that “either there is no truth or to us at least it is not evident.”
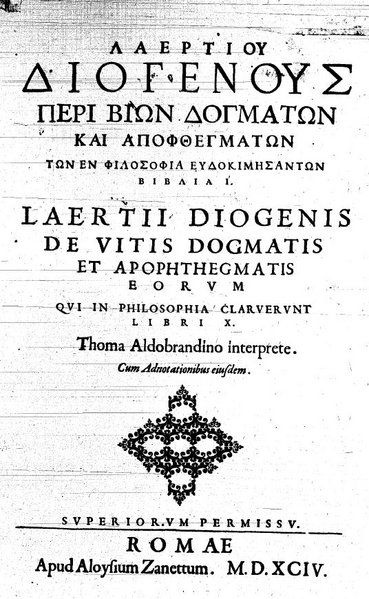
However, as Diogenes Laertius quoted in his 3rd century CE tract, Lives and Opinions of Eminent Philosophers: “By convention hot, by convention cold, but in reality atoms and void, and also in reality we know nothing, since the truth is at bottom.”
Ultimately, Democritus’ opinion on truth came down to a distinction between two kinds of knowledge – “legitimate” (or “genuine”) and bastard (or “secret”). The latter is concerned with perception through the senses, which is subjective by nature. This is due to the fact that our sense-perception are influence by the shape and nature of atoms as they flow out from the object in question and make an impression on our senses.
“Legitimate” knowledge, by contrast, is achieved through the intellect, where sense-data is elaborated through reasoning. In this way, one can get from “bastard” impressions to the point where things like connections, patterns and causality can be determined. This is consistent with the inductive reasoning method later elaborated by Renee Descartes, and is a prime example of why Democritus is considered to be an early scientific thinker.
Atomic Theory:
However, Democritus greatest contribution to modern science was arguably the atomic theory he elucidated. According to Democritus’ atomic theory, the universe and all matter obey the following principles:
- Everything is composed of “atoms”, which are physically, but not geometrically, indivisible
- Between atoms, there lies empty space
- Atoms are indestructible
- Atoms have always been, and always will be, in motion
- There are an infinite number of atoms, and kinds of atoms, which differ in shape, and size.
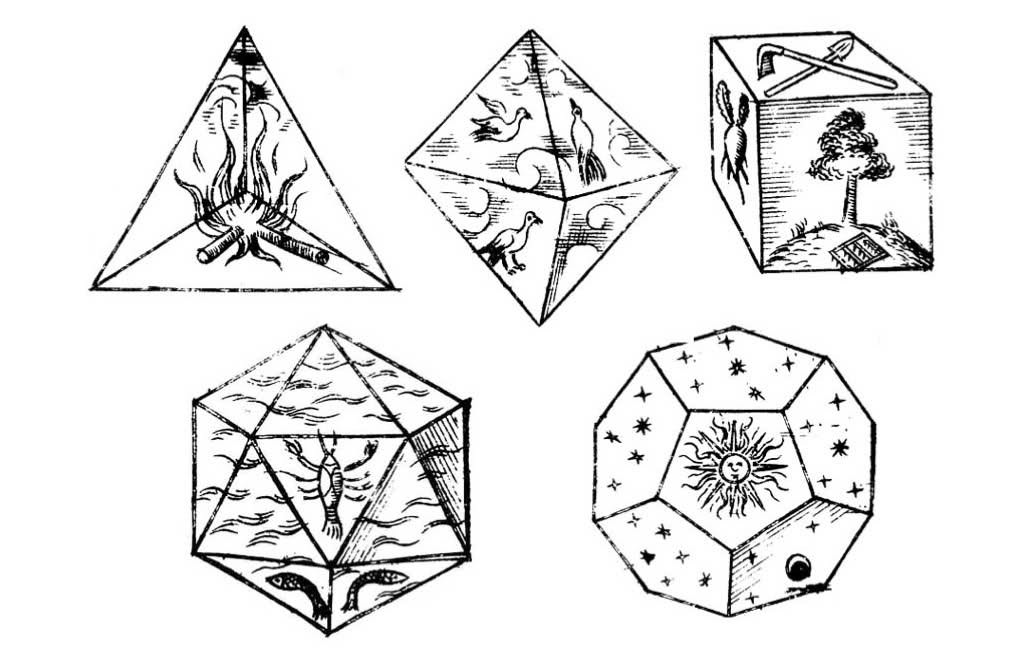
He was not alone in proposing atomic theory, as both his mentor Leucippus and Epicurus are believed to have proposed the earliest views on the shapes and connectivity of atoms. Like Democritus, they believed that the solidity of a material corresponded to the shape of the atoms involved – i.e. iron atoms are hard, water atoms are smooth and slippery, fire atoms are light and sharp, and air atoms are light and whirling.

However, Democritus is credited with illustrating and popularizing the concept, and for his descriptions of atoms which survived classical antiquity to influence later philosophers. Using analogies from our sense experiences, Democritus gave a picture or an image of an atom that distinguished them from each other by their shape, size, and the arrangement of their parts.
In essence, this model was one of an inert solid that excluded other bodies from its volume, and which interacted with other atoms mechanically. As such, his model included physical links (i.e. hooks and eyes, balls and sockets) that explained how connections occurred between them. While this bears little resemblance to modern atomic theory (where atoms are not inert and interact electromagnetically), it is more closely aligned with that of modern science than any other theory of antiquity.
While there is no clear explanation as to how scholars of classical antiquity came to theorize the existence of atoms, the concept proved to be influential, being picked up by Roman philosopher Lucretius in the 1st century CE and again during the Scientific Revolution. In addition to being indispensable to modern molecular and atomic theory, it also provided an explanation as to why the concept of a void was necessary in nature.
If all matter was composed of tiny, indivisible atoms, then there must also be a great deal of open space between them. This reasoning has also gone on to inform out notions of cosmology and astronomy, where Einstein’s theory of special relativity was able to do away with the concept of a “luminiferous aether” in explaining the behavior of light.
Diogenes Laertius summarized Democritus atomic theory as follows in Lives and Opinions of Eminent Philosophers:
“That atoms and the vacuum were the beginning of the universe; and that everything else existed only in opinion. That the worlds were infinite, created, and perishable. But that nothing was created out of nothing, and that nothing was destroyed so as to become nothing. That the atoms were infinite both in magnitude and number, and were borne about through the universe in endless revolutions. And that thus they produced all the combinations that exist; fire, water, air, and earth; for that all these things are only combinations of certain atoms; which combinations are incapable of being affected by external circumstances, and are unchangeable by reason of their solidity.”
Death and Legacy:
Democritus died at the age of ninety, which would place his death at around 370 BCE; though some writers disagree, with some claiming he lived to 104 or even 109. According to Marcus Aurelius’ book Meditations, Democritus was eaten by lice or vermin, although in the same passage he writes that “other lice killed Socrates”, implying that this was meant metaphorically. Since Socrates died at the hands of the Athenian government who condemned him, it is possible that Aurelius attributed Democritus death to human folly or politics.
While Democritus was highly esteemed amongst his contemporaries, there were also those who resented him. This included Plato who, according to some accounts, disliked him so much that he wished that all his books would be burned. However, Plato’s pupil Aristotle was familiar with the works of Democritus and mentioned him in both Metaphysics and Physics, where he described him as a “physicist” who did not concern himself with the ideals of form or essence.
Ultimately, Democritus is credited as being one of the founders of the modern science because his methods and theories closely resemble those of modern astronomers and physicists. And while his version of the atomic model differs greatly from our modern conceptions, his work was of undoubted value, and was a step in an ongoing process that included such scientists as John Dalton, Neils Bohr and even Albert Einstein.
As always, science is an process of continuing discovery, where new breakthroughs are built upon the foundations of the old and every generations attempts to see a little farther by standing on the shoulders of those who came before.
We have many interesting articles about atomic theory here at Universe Today. Here’s one about John Dalton’s atomic model, Neils Bohr’s atomic model, the “Plum Pudding” atomic model.
For more information, check out The History of the Atom – Democritus.
Astronomy Cast has a wonderful episode on the subject, titled Episode 392: The Standard Model – Intro


![Computer simulation of the Earth's field in a period of normal polarity between reversals.[1] The lines represent magnetic field lines, blue when the field points towards the center and yellow when away. The rotation axis of the Earth is centered and vertical. The dense clusters of lines are within the Earth's core](https://www.universetoday.com/wp-content/uploads/2010/03/Geodynamo_Between_Reversals-e1449100829326.gif)