Studying the large-scale structure of our galaxy isn’t easy. We don’t have a clear view of the Milky Way’s shape and features like we do of other galaxies, largely because we live within it. But we do have some advantages. From within, we’re able to carry out close-up surveys of the Milky Way’s stellar population and its chemical compositions. That gives researchers the tools they need to compare our own galaxy to the many millions of others in the Universe.
This week, an international team of researchers from the USA, UK, and Chile released a paper that does just that. They dug through a catalogue of ten thousand galaxies produced by the Sloan Digital Sky Survey, searching for galaxies with similar attributes to our own.
They discovered that the Milky Way has twins – many of them – but just as many that are only superficially similar, with fundamental differences buried in the data. What they discovered has implications for the future evolution of our own galaxy.
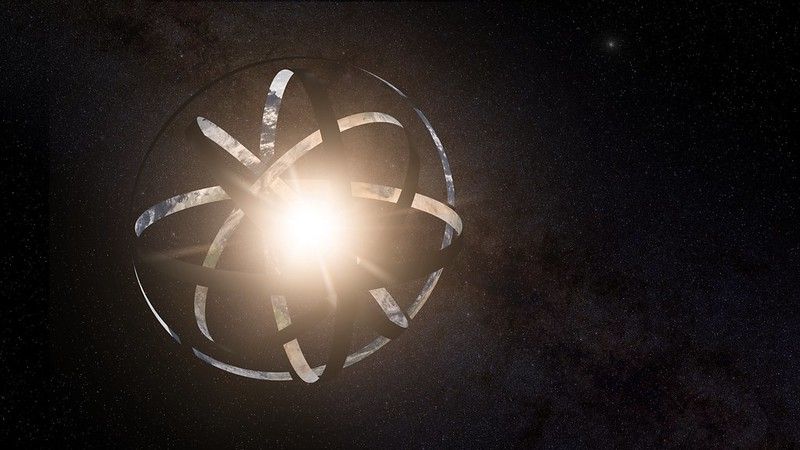
Black holes are more than just massive objects that swallow everything around them – they’re also one of the universe’s biggest and most stable energy sources. That would make them invaluable to the type of civilization that needs huge amounts of power, such as a Type II Kardashev civilization. But to harness all of that power, the civilization would have to encircle the entire black hole with something that could capture the power it is emitting.
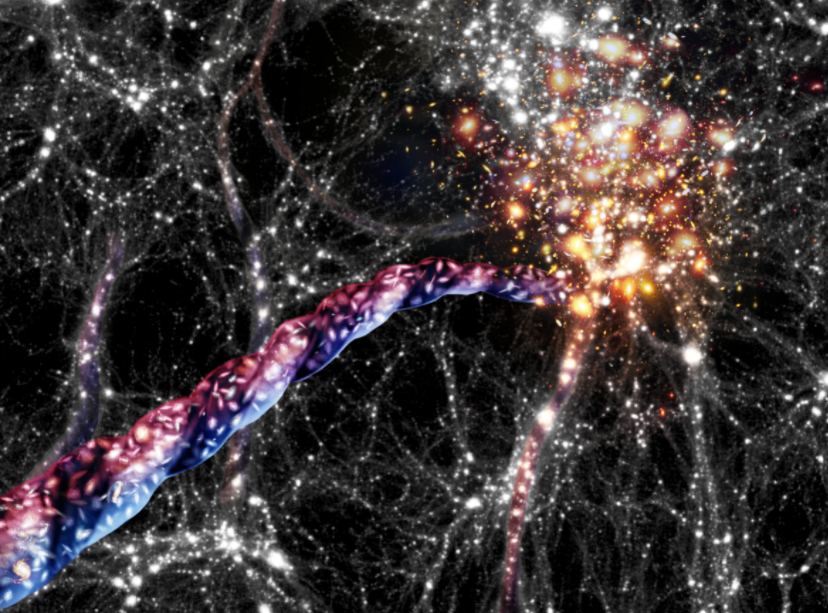
Artist’s impression of cosmic filaments: huge bridges of galaxies and dark matter connect clusters of galaxies to each other. Galaxies are funnelled on corkscrew like orbits towards and into large clusters that sit at their ends. Their light appears blue-shifted when they move towards us, and red-shifted when they move away. Credit: AIP/ A. Khalatyan/ J. Fohlmeister
We’ve known for a while about the large-scale structure of the Universe. Galaxies reside in filaments hundreds of millions of light-years long, on a backbone of dark matter. And, where those filaments meet, there are galaxy clusters. Between them are massive voids, where galaxies are sparse. Now a team of astronomers in Germany and their colleagues in China and Estonia have made an intriguing discovery.
These massive filaments are rotating, and this kind of rotation on such a massive scale has never been seen before.
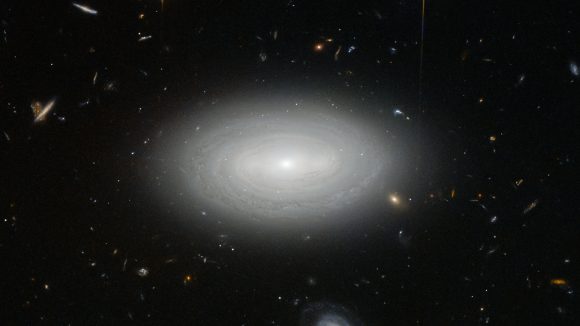
An illustration of cosmic expansion. Credit: NASA's Goddard Space Flight Center Conceptual Image Lab
For almost a century, astronomers have understood that the Universe is in a state of expansion. Since the 1990s, they have come to understand that as of four billion years ago, the rate of expansion has been speeding up. As this progresses, and the galaxy clusters and filaments of the Universe move farther apart, scientists theorize that the mean temperature of the Universe will gradually decline.
But according to new research led by the Center for Cosmology and AstroParticle Physics (CCAPP) at Ohio State University, it appears that the Universe is actually getting hotter as time goes on. After probing the thermal history of the Universe over the last 10 billion years, the team concluded that the mean temperature of cosmic gas has increased more than 10 times and reached about 2.2 million K (~2.2 °C; 4 million °F) today.
Once I accidentally took a photo of one of the most important stars in the Universe…
Andromeda Galaxy imaged at the SFU Trotter Observatory processed by Matthew Cimone
That star highlighted in the photo is called M31_V1 and resides in the Andromeda Galaxy. The Andromeda – AKA M31- is the closest galaxy to our own Milky Way. But before it was known as a galaxy, it was called the Andromeda Nebula. Before this particular star in Andromeda was studied by Edwin Hubble, namesake of the Hubble Space Telescope, we didn’t actually know if other galaxies even existed. Think about that! As recently as a hundred years ago, we thought the Milky Way might be the ENTIRE Universe. Even then…that’s pretty big. The Milky Way is on the order of 150,000 light years across. A light year is about 10 TRILLION kilometers so even at the speed of light it would take nearly the same length of time to cross the Milky Way as humans have existed on planet Earth. M31_V1 changed all that.
Accroding to new research, the Milky Way may still bear the marks of "ancient impacts". Credit: NASA/Serge Brunier
Understanding how the Universe came to be is one of the greater challenges of being an astrophysicist. Given the observable Universe’s sheer size (46.6 billion light years) and staggering age (13.8 billion years), this is no easy task. Nevertheless, ongoing observations, calculations and computer simulations have allowed astrophysicists to learn a great deal about how galaxies and larger structures have changed over time.
For example, a recent study by a team from the University of Kentucky (UK) has challenged previously-held notions about how our galaxy has evolved to become what we see today. Based on observations made of the Milky Way’s stellar disk, which was previously thought to be smooth, the team found evidence of asymmetric ripples. This indicates that in the past, our galaxy may have been shaped by ancient impacts.
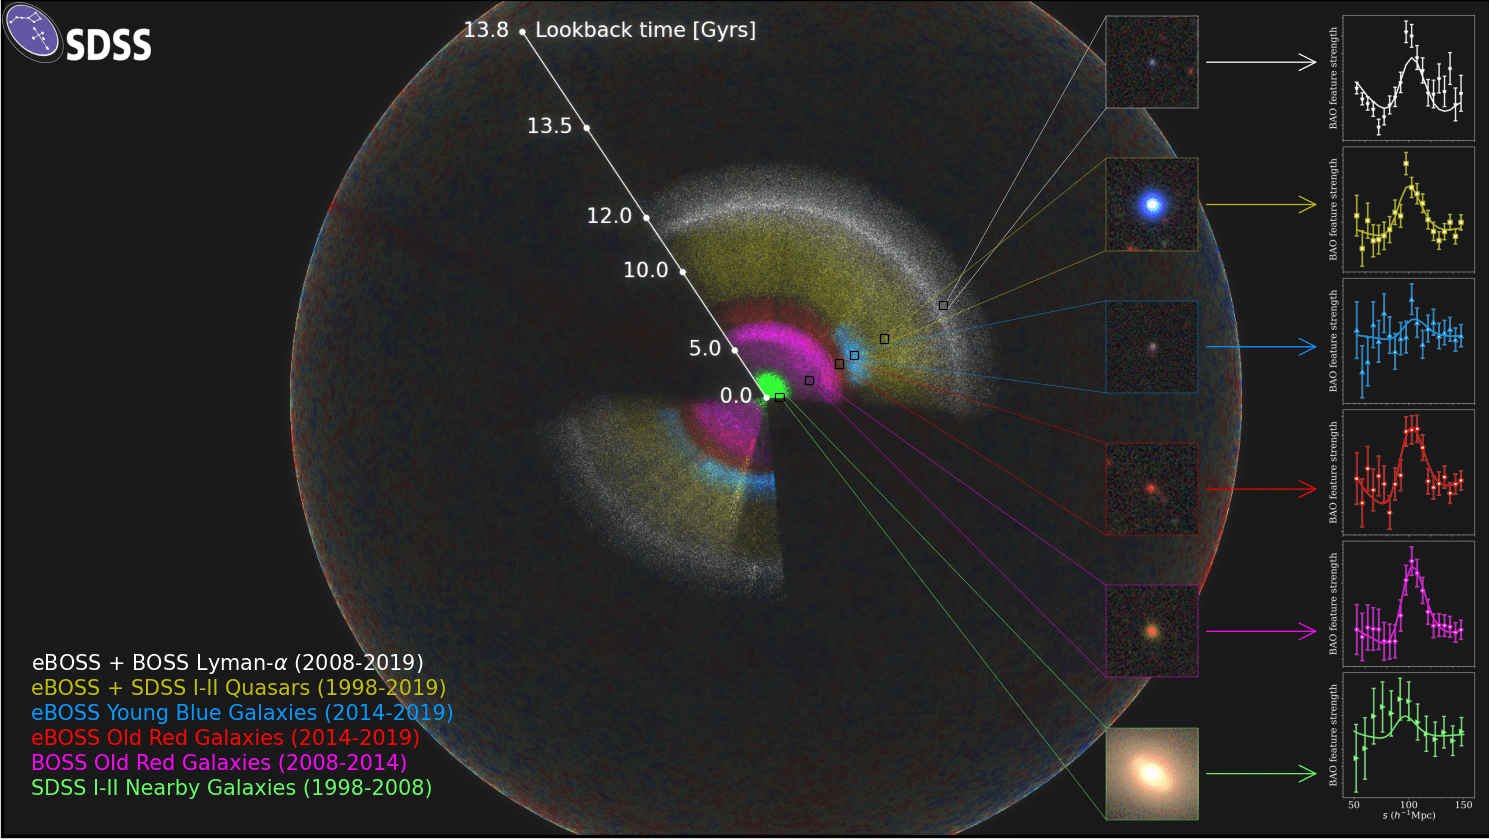
This study evolved from Ferguson’s senior thesis, which was overseen by Prof. Gardner. At the time, Ferguson sought to expand on previous research by Gardner and Yanny, which also sought to understand the presence of ripples in our galaxy’s stellar disk. For the sake of this new study, the team relied on data obtained by the Sloan Digital Sky Survey‘s (SDSS) 2.5m Telescope, located at the Apache Point Observatory in New Mexico.
This allowed the team to examine the spatial distribution of 3.6 million stars in the Milky Way Galaxy, from which they confirmed the presence of asymmetric ripples. These, they claim, can be interpreted as evidence of the Milky Way’s ancient impacts – in other words, that these ripples resulted from our galaxy coming into contact with other galaxies in the past.
These could include a merger between the Milky Way and the Sagittarius dwarf galaxy roughly 0.85 billion years ago, as well as our galaxy’s current merger with the Canis Major dwarf galaxy. As Prof. Gardner explained in a recent UK press release:
“These impacts are thought to have been the ‘architects’ of the Milky Way’s central bar and spiral arms. Just as the ripples on the surface of a smooth lake suggest the passing of a distant speed boat, we search for departures from the symmetries we would expect in the distributions of the stars to find evidence of ancient impacts. We have found extensive evidence for the breaking of all these symmetries and thus build the case for the role of ancient impacts in forming the structure of our Milky Way.”
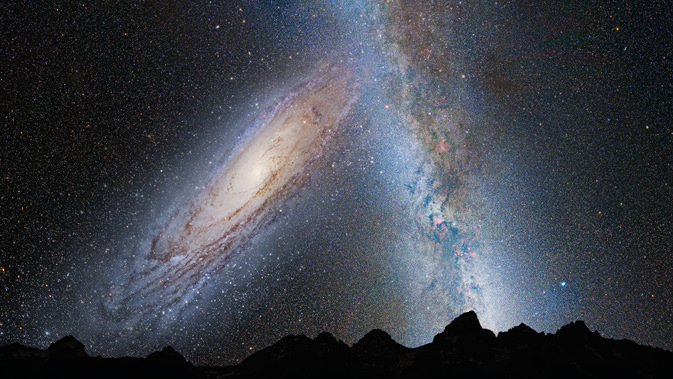
Illustration showing a stage in the predicted merger between our Milky Way galaxy and the neighboring Andromeda galaxy, as it will unfold over the next several billion years. Credit: NASA; ESA; Z. Levay and R. van der Marel, STScI; T. Hallas; and A. Mellinger
As noted, Gardner’s previous work also indicated that when it came to north/south symmetry of stars in the Milky Way’s disk, there was a vertical “ripple”. In other words, the number of stars that lay above or below the stellar disk would increase from one sampling to the next the farther they looked from the center of the galactic disk. But thanks to the most recent data obtained by the SDSS, the team had a much larger sample to base their conclusions on.
And ultimately, these findings confirmed the observations made by Ferguson and Lally, and also turned up evidence of an asymmetry in the plane of the galactic disk as well. As Ferguson explained:
“Having access to millions of stars from the SDSS allowed us to study galactic structure in an entirely new way by breaking the sky up into smaller regions without loss of statistics. It has been incredible watching this project evolve and the results emerge as we plotted the stellar densities and saw intriguing patterns across the footprint. As more studies are being done in this field, I am excited to see what we can learn about the structure of our galaxy and the forces that helped to shape it.”
Understanding how our galaxy evolved and what role ancient impact played is essential to understanding the history and evolution of the Universe as a whole. And in addition to helping us confirm (or update) our current cosmological models, studies like this one can also tell us much about what lies in store for our galaxy billions of years from now.
For decades, astronomers have been of the opinion that in roughly 4 billion years, the Milky Way will collide with Andromeda. This event is likely to have tremendous repercussions, leading to the merger of both galaxy’s supermassive black holes, stellar collisions, and stars being ejected. While it’s doubtful humanity will be around for this event, it would still be worthwhile to know how this process will shape our galaxy and the local Universe.
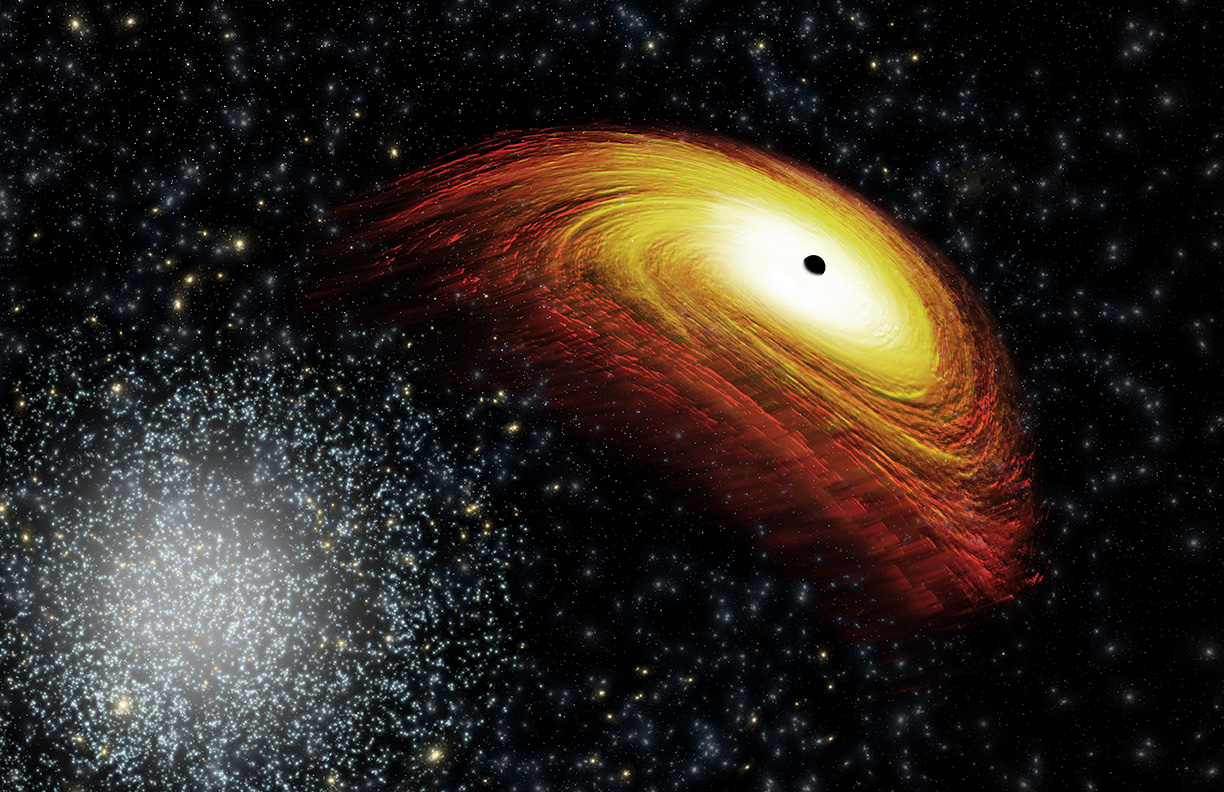
Using data from Chandra and other telescopes, astronomers have found a possible "recoiling" black hole. Credit: NASA/CXC/M.Weiss
When galaxies collide, all manner of chaos can ensue. Though the process takes millions of years, the merger of two galaxies can result in Supermassive Black Holes (SMBHs, which reside at their centers) merging and becoming even larger. It can also result in stars being kicked out of their galaxies, sending them and even their systems of planets into space as “rogue stars“.
But according to a new study by an international team of astronomers, it appears that in some cases, SMBHs could also be ejected from their galaxies after a merger occurs. Using data from NASA’s Chandra X-ray Observatory and other telescopes, the team detected what could be a “renegade supermassive black hole” that is traveling away from its galaxy.
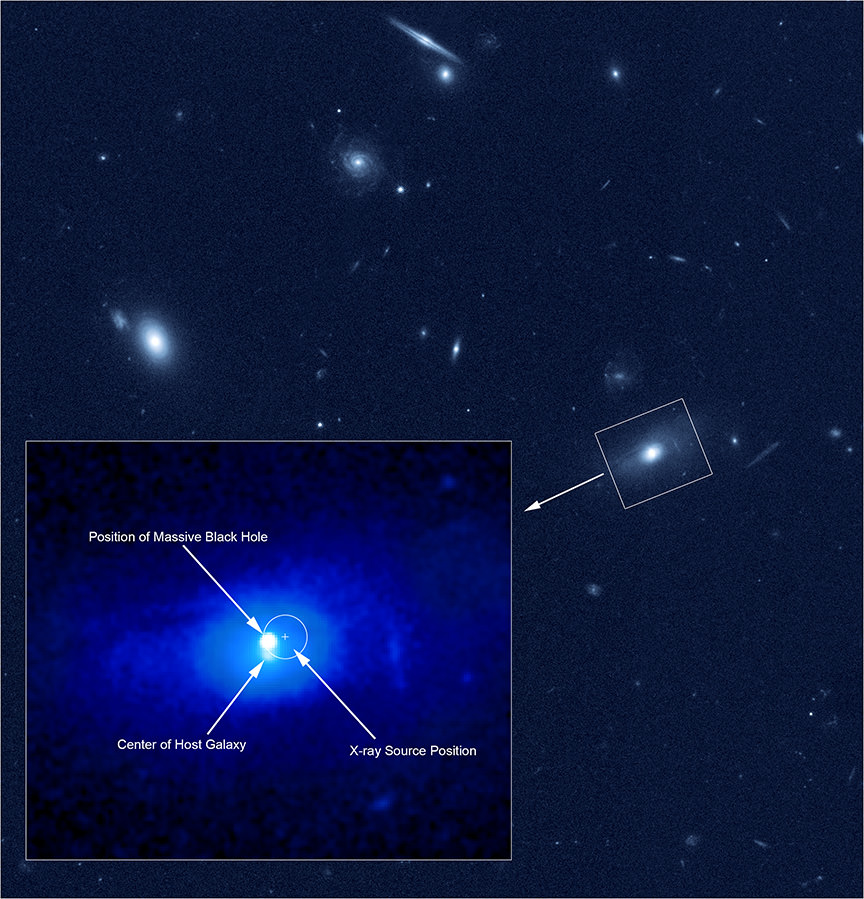
According to the team’s study – which appeared in the Astrophysical Journal under the title A Potential Recoiling Supermassive Black Hole, CXO J101527.2+625911 – the renegade black hole was detected at a distance of about 3.9 billion light years from Earth. It appears to have come from within an elliptical galaxy, and contains the equivalent of 160 million times the mass of our Sun.
Hubble data showing the two bright points near the middle of the galaxy. Credit: NASA/CXC/NRAO/D.-C.Kim/STScI
The team found this black hole while searching through thousands of galaxies for evidence of black holes that showed signs of being in motion. This consisted of sifting through data obtained by the Chandra X-ray telescope for bright X-ray sources – a common feature of rapidly-growing SMBHs – that were observed as part of the Sloan Digital Sky Survey (SDSS).
They then looked at Hubble data of all these X-ray bright galaxies to see if it would reveal two bright peaks at the center of any. These bright peaks would be a telltale indication that a pair of supermassive black holes were present, or that a recoiling black hole was moving away from the center of the galaxy. Last, the astronomers examined the SDSS spectral data, which shows how the amount of optical light varies with wavelength.
From all of this, the researchers invariably found what they considered to be a good candidate for a renegade black hole. With the help data from the SDSS and the Keck telescope in Hawaii, they determined that this candidate was located near, but visibly offset from, the center of its galaxy. They also noted that it had a velocity that was different from the galaxy – properties which suggested that it was moving on its own.
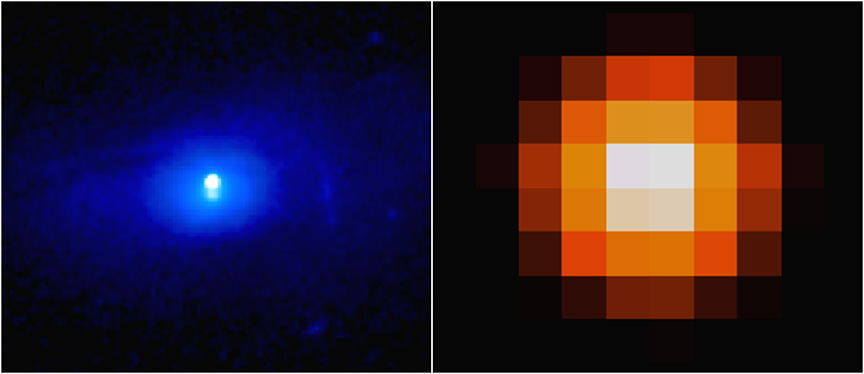
The image below, which was generated from Hubble data, shows the two bright points near the center of the galaxy. Whereas the one on the left was located within the center, the one on the right (the renegade SMBH) was located about 3,000 light years away from the center. Between the X-ray and optical data, all indications pointed towards it being a black hole that was kicked from its galaxy.
The bright X-ray source detected with Chandra (left), and data obtained from the SDSS and the Keck telescope in Hawaii. Credit: NASA/CXC/NRAO/D.-C.Kim/STScI
In terms of what could have caused this, the team ventured that the back hole might have “recoiled” when two smaller SMBHs collided and merged. This collision would have generated gravitational waves that could have then pushed the black hole out of the galaxy’s center. They further ventured that the black hole may have formed and been set in motion by the collision of two smaller black holes.
Another possible explanation is that two SMBHs are located in the center of this galaxy, but one of them is not producing detectable radiation – which would mean that it is growing too slowly. However, the researchers favor the explanation that what they observed was a renegade black hole, as it seems to be more consistent with the evidence. For example, their study showed signs that the host galaxy was experiencing some disturbance in its outer regions.
This is a possible indication that the merger between the two galaxies occurred in the relatively recent past. Since SMBH mergers are thought to occur when their host galaxies merge, this reservation favors the renegade black hole theory. In addition, the data showed that in this galaxy, stars were forming at a high rate. This agrees with computer simulations that predict that merging galaxies experience an enhanced rate of star formation.
But of course, additional researches is needed before any conclusions can be reached. In the meantime, the findings are likely to be of particular interest to astronomers. Not only does this study involve a truly rare phenomenon – a SMBH that is in motion, rather than resting at the center of a galaxy – but the unique properties involved could help us to learn more about these rare and enigmatic features.
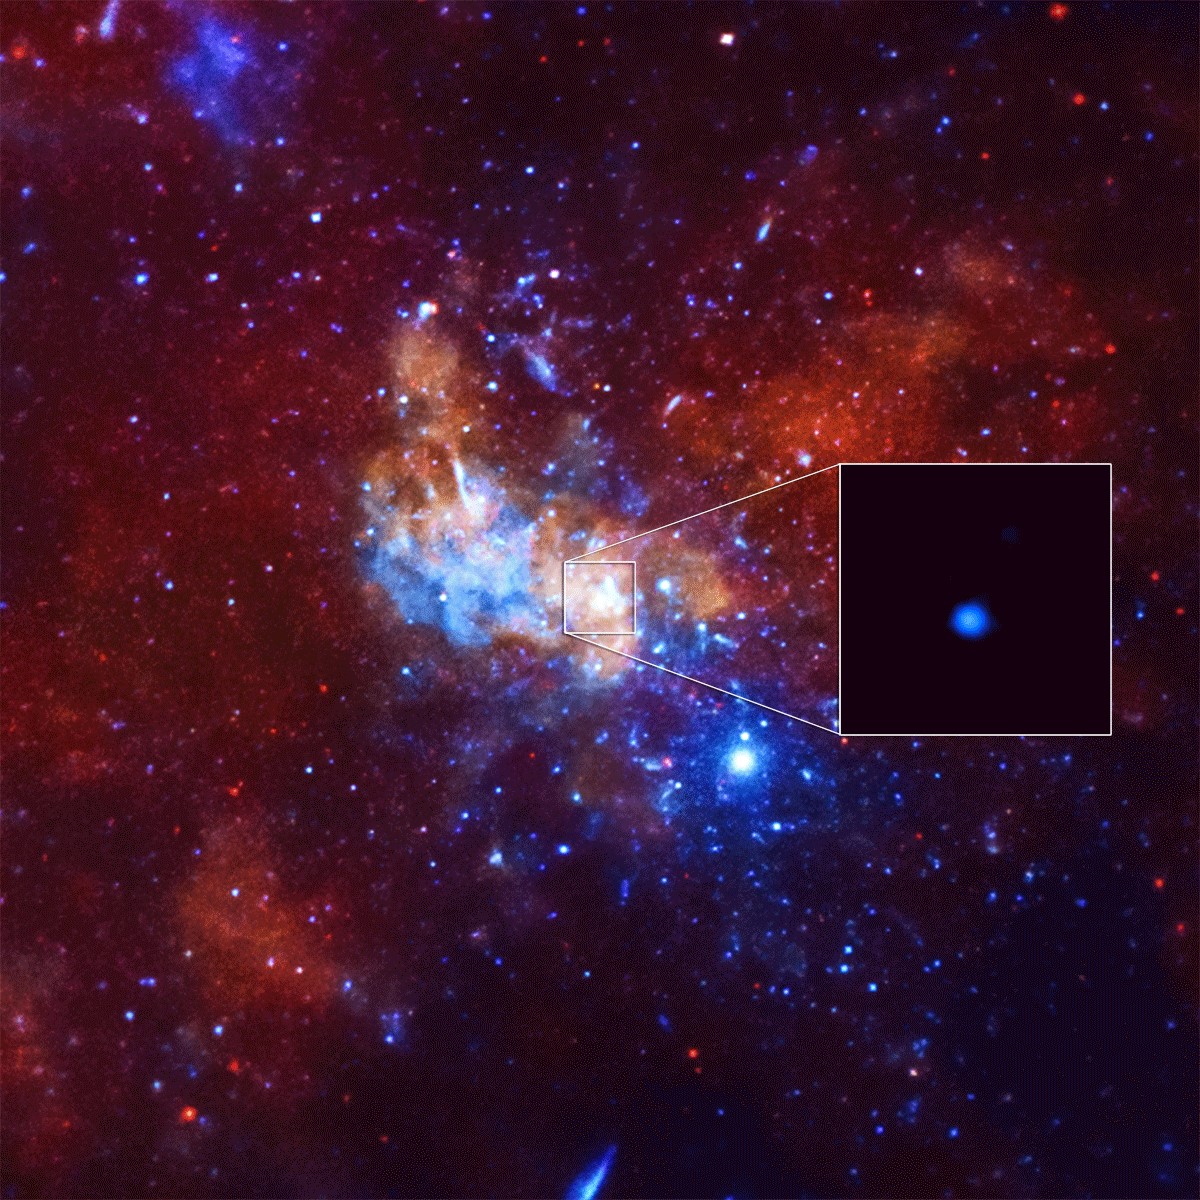
Detection of an unusually bright X-Ray flare from Sagittarius A*, a supermassive black hole in the center of the Milky Way galaxy. Credit: NASA/CXC/Stanford/I. Zhuravleva et al.
For one, the study of SMBHs could reveal more about the rate and direction of spin of these enigmatic objects before they merge. From this, astronomers would be able to better predict when and where SMBHs are about to merge. Studying the speed of recoiling black holes could also reveal additional information about gravitational waves, which could unlock additional secrets about the nature of space time.
And above all, witnessing a renegade black hole is an opportunity to see some pretty amazing forces at work. Assuming the observations are correct, there will no doubt be follow-up surveys designed to see where the SMBH is traveling and what effect it is having on the surrounding cosmic environment.
Ever since the 1970s, scientists have been of the opinion that most galaxies have SMBHs at their center. In the years and decades that followed, research confirmed the presence of black holes not only at the center of our galaxy – Sagittarius A* – but at the center of all almost all known massive galaxies. Ranging in mass from the hundreds of thousands to billions of Solar masses, these objects exert a powerful influence on their respective galaxies.
Be sure to enjoy this video, courtesy of the Chandra X-Ray Observatory:
An artists depiction of how the spectra of elements in the stars of the Milky Way reflect the importance these elements play in human life. Credit: Dana Berry/SkyWorks Digital Inc.; SDSS collaboration.
Scientist Carl Sagan said many times that “we are star stuff,” from the nitrogen in our DNA, the calcium in our teeth, and the iron in our blood.
It is well known that most of the essential elements of life are truly made in the stars. Called the “CHNOPS elements” – carbon, hydrogen, nitrogen, oxygen, phosphorous, and sulfur – these are the building blocks of all life on Earth. Astronomers have now measured of all of the CHNOPS elements in 150,000 stars across the Milky Way, the first time such a large number of stars have been analyzed for these elements.
“For the first time, we can now study the distribution of elements across our Galaxy,” says Sten Hasselquist of New Mexico State University. “The elements we measure include the atoms that make up 97% of the mass of the human body.”
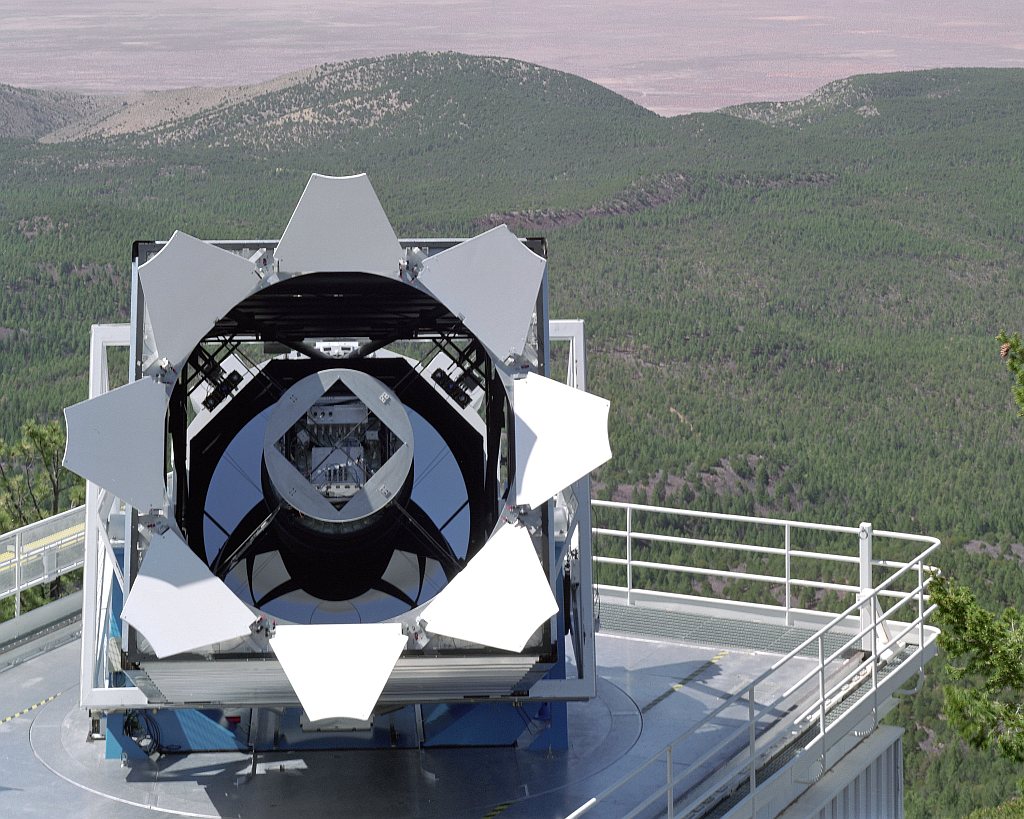
Astronomers with the Sloan Digital Sky Survey made their observations with the APOGEE (Apache Point Observatory Galactic Evolution Experiment) spectrograph on the 2.5m Sloan Foundation Telescope at Apache Point Observatory in New Mexico. This instrument looks in the near-infrared to reveal signatures of different elements in the atmospheres of stars.
Quote from Carl Sage. Credit: Pinterest
While the observations were used to create a new catalog that is helping astronomers gain a new understanding of the history and structure of our galaxy, the findings also “demonstrates a clear human connection to the skies,” said the team.
While humans are 65% oxygen by mass, oxygen makes up less than 1% of the mass of all of elements in space. Stars are mostly hydrogen, but small amounts of heavier elements such as oxygen can be detected in the spectra of stars. With these new results, APOGEE has found more of these heavier elements in the inner part of the galaxy. Stars in the inner galaxy are also older, so this means more of the elements of life were synthesized earlier in the inner parts of the galaxy than in the outer parts.
So what does that mean for those of us out on the outer edges of one of the Milky Way’s spiral arms, about 25,000 light-years from the center of the galaxy?
“I think it’s hard to say what the specific implications are for when life could arise,” said team member Jon Holtzman, also from New Mexico State, in an email to Universe Today. “We measure typical abundance of CHNOPS elements at different locations, but it’s not so easy to determine at any given location the time history of the CHNOPS abundances, because it’s hard to measure ages of stars. On top of that, we don’t know what the minimum amount of CHNOPS would need to be for life to arise, especially since we don’t really know how that happens in any detail!”
Holtzman added it is likely that, if there is a minimum required abundance, that minimum was probably reached earlier in the inner parts of the Galaxy than where we are.
The team also said that while it’s fun to speculate how the composition of the inner Milky Way Galaxy might impact how life might arise, the SDSS scientists are much better at understanding the formation of stars in our Galaxy.
“These data will be useful to make progress on understanding Galactic evolution,” said team member Jon Bird of Vanderbilt University, “as more and more detailed simulations of the formation of our galaxy are being made, requiring more complex data for comparison.”
Sloan Foundation 2.5m Telescope at Apache Point Observatory. Credit: SDSS.
“It’s a great human interest story that we are now able to map the abundance of all of the major elements found in the human body across hundreds of thousands of stars in our Milky Way,” said Jennifer Johnson of The Ohio State University. “This allows us to place constraints on when and where in our galaxy life had the required elements to evolve, a sort ‘temporal Galactic habitable zone’”.
The catalog is available at the SDSS website, so take a look for yourself at the chemical abundances in our portion of the galaxy.
The Sloan Digital Sky Survey telescope stands out against the breaktaking backdrop of the Sacramento Mountains. 234 stars out of the Sloan's catalogue of over 2.5 million stars are producing an unexplained pulsed signal. Image: SDSS, Fermilab Visual Media Services
We all want there to be aliens. Green ones, pink ones, brown ones, Greys. Or maybe Vulcans, Klingons, even a being of pure energy. Any type will do.
That’s why whenever a mysterious signal or energetic fluctuation arrives from somewhere in the cosmos and hits one of our many telescopes, headlines erupt across the media: “Have We Finally Detected An Alien Signal?” or “Have Astronomers Discovered An Alien Megastructure?” But science-minded people know that we’re probably getting ahead of ourselves.
Skepticism still rules the day when it comes to these headlines, and the events that spawn them. That’s the way it should be, because we’ve always found a more prosaic reason for whatever signal from space we’re talking about. But, being skeptical is a balancing act; it doesn’t mean being dismissive.
What we’re talking about here is a new study from E.F. Borra and E. Trottier, two astronomers at Laval University in Canada. Their study, titled “Discovery of peculiar periodic spectral modulations in a small fraction of solar type stars” was just published at arXiv.org. ArXiv.org is a pre-print website, so the paper itself hasn’t been peer reviewed yet. But it is generating interest.
The two astronomers used data from the Sloan Digital Sky Survey, and analyzed the spectra of 2.5 million stars. Of all those stars, they found 234 stars that are producing a puzzling signal. That’s only a tiny percentage. And, they say, these signals “have exactly the shape of an ETI signal” that was predicted in a previous study by Borra.
A portion of the 234 stars that are sources of the pulsed ETI-like signal. Note that all the stars are in the narrow spectral range F2 to K1, very similar to our own Sun. Image: Ermanno F. Borra and Eric Trottier
Prediction is a key part of the scientific method. If you develop a theory, your theory looks better and better the more you can use it to correctly predict some future events based on it. Look how many times Einstein’s predictions based on Relativity have been proven correct.
The 234 stars in Borra and Trottier’s study aren’t random. They’re “overwhelmingly in the F2 to K1 spectral range” according to the abstract. That’s significant because this is a small range centred around the spectrum of our own Sun. And our own Sun is the only one we know of that has an intelligent species living near it. If ours does, maybe others do too?
The authors acknowledge five potential causes of their findings: instrumental and data reduction effects, rotational transitions in molecules, the Fourier transform of spectral lines, rapid pulsations, and finally the ETI signal predicted by Borra (2012). They dismiss molecules or pulsations as causes, and they deem it highly unlikely that the signals are caused by the Fourier analysis itself. This leaves two possible sources for the detected signals. Either they’re a result of the Sloan instrument itself and the data reduction, or they are in fact a signal from extra-terrestrial intelligences.
This graph shows the number of detected signals by Spectral Type of star. Image: Ermanno F. Borra and Eric Trottier
The detected signals are pulses of light separated by a constant time interval. These types of signals were predicted by Borra in his 2012 paper, and they are what he and Trottier set out to find in the Sloan data. It may be a bit of a red flag when scientist’s find the very thing they predicted they would find. But Trottier and Borra are circumspect about their own results.
As the authors say in their paper, “Although unlikely, there is also a possibility that the signals are due to highly peculiar chemical compositions in a small fraction of galactic halo stars.” It may be unlikely, but lots of discoveries seem unlikely at first. Maybe there is a tiny subset of stars with chemical peculiarities that make them act in this way.
To sum it all up, the two astronomers have found a tiny number of stars, very similar to our own Sun, that seem to be the source of pulsed signals. These signals are the same as predicted if a technological society was using powerful lasers to communicate with distant stars.
We all want there to be aliens, and maybe the first sign of them will be pulsed light signals from stars like our own Sun. But it’s all still very preliminary, and as the authors acknowledge, “…at this stage, this hypothesis needs to be confirmed with further work.”
The Breakthrough team don’t seem that excited about Borra’s findings. They’ve already poured cold water on it, trotting out the old axiom that “Extraordinary claims require extraordinary evidence” in a statement on Borra’s paper. They also give Borra’s findings a score of 0 to 1 on the Rio Scale. The Rio Scale is something used by the international SETI community to rank detections of phenomena that could indicate advanced life beyond Earth. A rating of 0 to 1 means its insignificant.
Clearly I need to learn to be more specific when I write these articles. Everything time I open my mouth, I need to prepare for the collective imagination of the viewers.
We did a whole article about the biggest things in the Universe, and identified superclusters of galaxies as the best candidate. Well, the part of superclusters actually gravitationally bound enough to eventually merge together in the future. But you had other ideas, including dark energy, or the Universe itself as the biggest thing. Even love? Aww.
One intriguing suggestion, though, is the idea of the vast cosmic voids between galaxies. Hmm, is the absence of something a thing? Whoa, time to go to art school and talk about negative space.
Ah well, who cares? It’s a super interesting topic, so let’s go ahead and talk about voids.
When most people imagine the expansion of the Universe after the Big Bang, they probably envision an equally spaced smattering of galaxies zipping away from one another. And that’s pretty accurate at the smallest scales.
Credit: NASA, ESA, and E. Hallman (University of Colorado, Boulder)
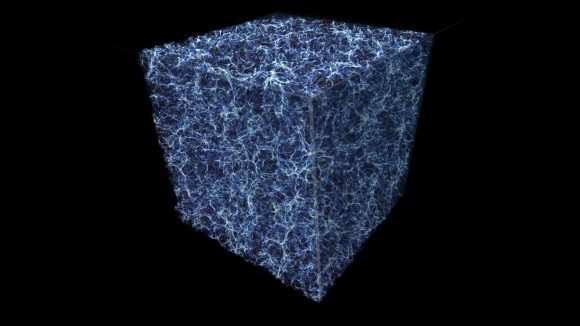
But at the largest scales, like when you can see billions of light-years in a cube that fits on your computer screen, then a larger structure starts to take shape.
It looks less like an explosion, and more like a tasty tasty sponge cake, with huge filaments, walls, and the vast gaps in between. The gaps, the voids, the supervoids, are the point of today’s article, but to understand the gaps, we’ve got to understand why the Universe is clumped up the way it is.
Run the Universe clock backwards, all the way to the beginning, to a fraction of a second after the Big Bang. When the entire cosmos was compressed down into a tiny region of superheated plasma.
Although it was mostly uniform in density, there were slight variations – quantum fluctuations in spacetime itself. And as the Universe expanded, those differences were magnified. What started out as tiny differences in the density of matter at the smallest scale, turned into regions of higher and lower density of matter in the Universe.
Here we are, 13.8 billion years after the Big Bang, and we can see how the microscopic variations at the beginning of time were magnified to the largest scales. Instead of individual galaxies, we see huge walls containing thousands of galaxies; filaments of galaxies connect in nodes. These structures are huge; hundreds of millions of light-years across, containing thousands of galaxies. But the gaps, the voids, between these clusters can be even larger.
Astronomers first started thinking about these voids back in the 1970s, when the first large-scale surveys of the Universe were made. By measuring the redshift of galaxies, and determining how fast they were speeding away from us, astronomers started to realize that the distribution of galaxies wasn’t even.
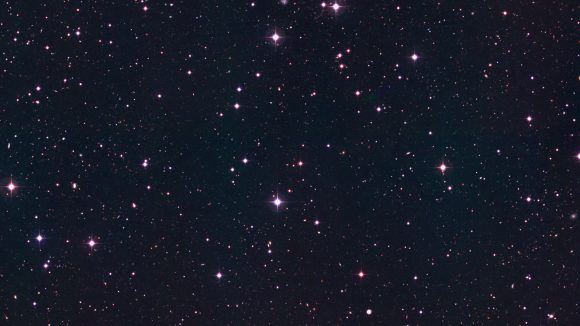
Red-shifted galaxies. Credit: ESO
Some galaxies were relatively close, but then there were huge gaps in distance, and then another cluster of galaxies collected together.
Over the last few decades, astronomers have built sophisticated 3-dimensional models that map out the Universe in the largest scales. The Sloan Digital Sky Survey, updated in 2009, has provided the most accurate map so far. The Large Synoptic Survey Telescope, destined for first light in a few years will take this to the next level.
The largest void that we currently know of is known as the Giant Void (original, I know), and it’s located about 1.5 billion light-year away. It has a diameter of 1 billion to 1.3 billion light-years across.
To be fair, these regions aren’t really completely empty. They just have less density than the regions with galaxies. In general, they’ve got about a tenth the density of matter that’s average for the Universe.
Galaxy MCG+01-02-015 is so isolated that if our galaxy, the Milky Way, were to be situated in the same way, we would not have known of the existence of other galaxies until the 1960s Credit: ESA/Hubble & NASA and N. Gorin (STScI). Acknowledgement: Judy Schmidt
Which means that there’s still gas and dust in these regions, as well as dark matter. There will still be stars and galaxies out in the middle of those voids. Even the Giant Void has 17 separate galaxy clusters inside it.
You might imagine continuing to scale outward. Maybe you’re wondering if the this spongy distribution of matter is actually just the next step to an even larger structure, and so on, and so on. But it isn’t. In fact, astronomers call this “the End of Greatness”, because it doesn’t seem like there’s any larger structure to the Universe.
As the expansion of the Universe continues, these voids are going to get even larger. The walls and filaments connecting clusters of galaxies will stretch and break. The voids will merge with each other, and only gravitationally bound galaxy clusters will remain as islands, adrift in the expanding emptiness.
The full scale of the observable Universe is truly mind boggling. We’re here in this tiny corner of the Local Group, which is part of the Virgo Supercluster, which is perched on the precipice of vast cosmic voids. So much to explore, so let’s get to work.