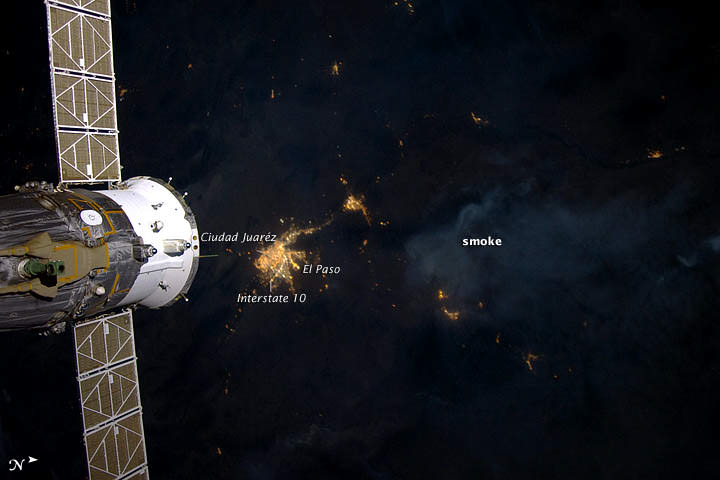
The Whitewater-Baldy fire is the largest wildfire in New Mexico’s history and has charred more than 465 square miles of the Gila National Forest since it started back on May 16, 2012 after several lightning strikes in the area. This wildfire produced so much smoke that it was visible even at night to the astronaut photographers on the International Space Station. This image was taken on June 2, 2012 by the crew of Expedition 31 on the ISS, with a Nikon D3S digital camera. A Russian spacecraft docked to the station is visible on the left side of the image.
The powerful windstorms that swept across the US last week was captured by several different satellites. This type of storm, called a derecho, moved from Illinois to the Mid-Atlantic states on June 29, and the movie from NOAA’s GOES-13 satellite shows the storms’ sudden expansion and speed. The storms left a more than 1,000-km (700-mile) trail of destruction across the Midwest and mid-Atlantic, cutting power to millions and killing thirteen people.
A derecho (pronounced “deh-REY-cho”) is not your average, ordinary local summer thunderstorm. These are widespread, long-lived but rare wind storms that are usually associated with a band of rapidly moving showers or thunderstorms. Damage from a derecho is usually in one direction along a relatively straight track. By definition an event is classified a derecho if the wind damage swath extends more than 400 km (240 miles) and includes wind gusts of at least 93 km/h (58 mph) or greater along most of its length.
These storms occur in the United States during the late spring and summer, with more than three quarters occurring between April and August.
The movie begins on June 28 at 15:15 UTC (11:15 a.m. EDT) and ends on June 30, 2012 at 16:01 UTC (12:01 p.m. EDT). In the animation, the derecho’s clouds appear as a line in the upper Midwest on June 29 at 14:32. By 16:02 UTC, they appear as a rounded area south of Lake Michigan. By 21:32, the area of the derecho’s clouds were near Lake Erie and over Ohio expanding as the system track southeast. By 06:30 UTC, the size appears to have almost doubled as the derecho moves over West Virginia, Maryland, Pennsylvania and Virginia. At 02:32 UTC on June 30 (10:32 p.m. EDT), the Derecho was over the mid-Atlantic bringing a 160 km (100 mile) line of severe storms and wind gusts as high as 144 km/h (90 mph) to the region.
“It is interesting how the process is a self-sustaining process that is fed by a combination of atmospheric factors that all have to be in place at the same time,” said Joe Witte, a meteorologist in Climate Change Communication at George Mason University, Va. and a consultant to NASA. “That is why they are relatively rare: not all the elements line up that often.”
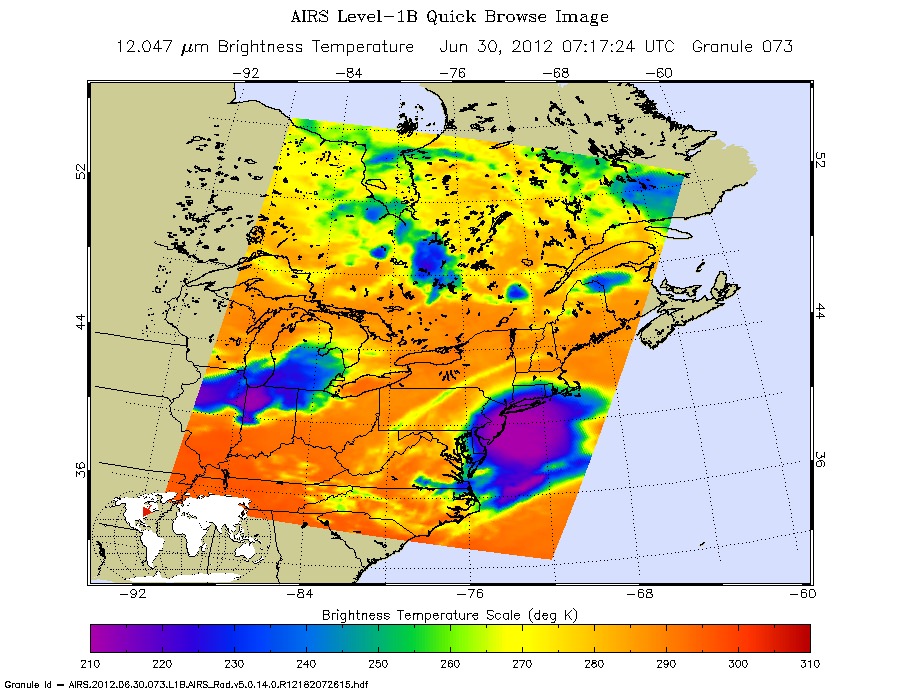
NASA’s Aqua satellite flew over the derecho on June 29 and June 30, using the Atmospheric Infrared Sounder instrument (AIRS) onboard to capture infrared imagery of the event, as seen above.
“The AIRS infrared image shows the high near-surface atmospheric temperatures blanketing the South and Midwestern U.S., approaching 98 degrees Fahrenheit,” said Ed Olsen of the AIRS Team at NASA’s Jet Propulsion Laboratory.
The AIRS images for June 30 show areas of intense convection centered off the New Jersey coast and another, less intense, system over Iowa-Indiana-Ohio. The area off the New Jersey coast is no longer a rapidly moving linear front. The near-surface atmospheric temperatures over the South and Midwest had decreased by 10 to 15 Fahrenheit in most areas,” Olsen said.
NASA’s Suomi National Polar-orbiting Partnership satellite (NPP) captured night-time images on June 28 and June 30, that reflected the massive blackouts that occurred after the derecho swept through the mid-Atlantic states. You can see the comparison images here at NASA’s Earth Observatory website.
The mechanics of a derecho go like this: The downburst mentioned by Witte, above, occurs when cold air in the upper atmosphere is cooled more by the evaporation of some of the rain and melting of the frozen precipitation pushed up into the high levels of the towering cumulonimbus (thunderclouds). That cold air becomes much denser than the surrounding air and literally falls to the ground, accelerating like any other falling body.
“The huge blob of very cold air from the upper atmosphere has a higher forward wind speed since it is high in the atmosphere,” Witte said. “This gives the ‘blob’ great forward momentum. Add that speed to the falling speed and the result is a very powerful forward moving surface wind.”
The process of a derecho can become self-sustaining as hot and humid air is forced upward by the gust front and develops more (reinforcing) towering clouds. If there is a rear low level jet stream, there is nothing to stop the repeating process.
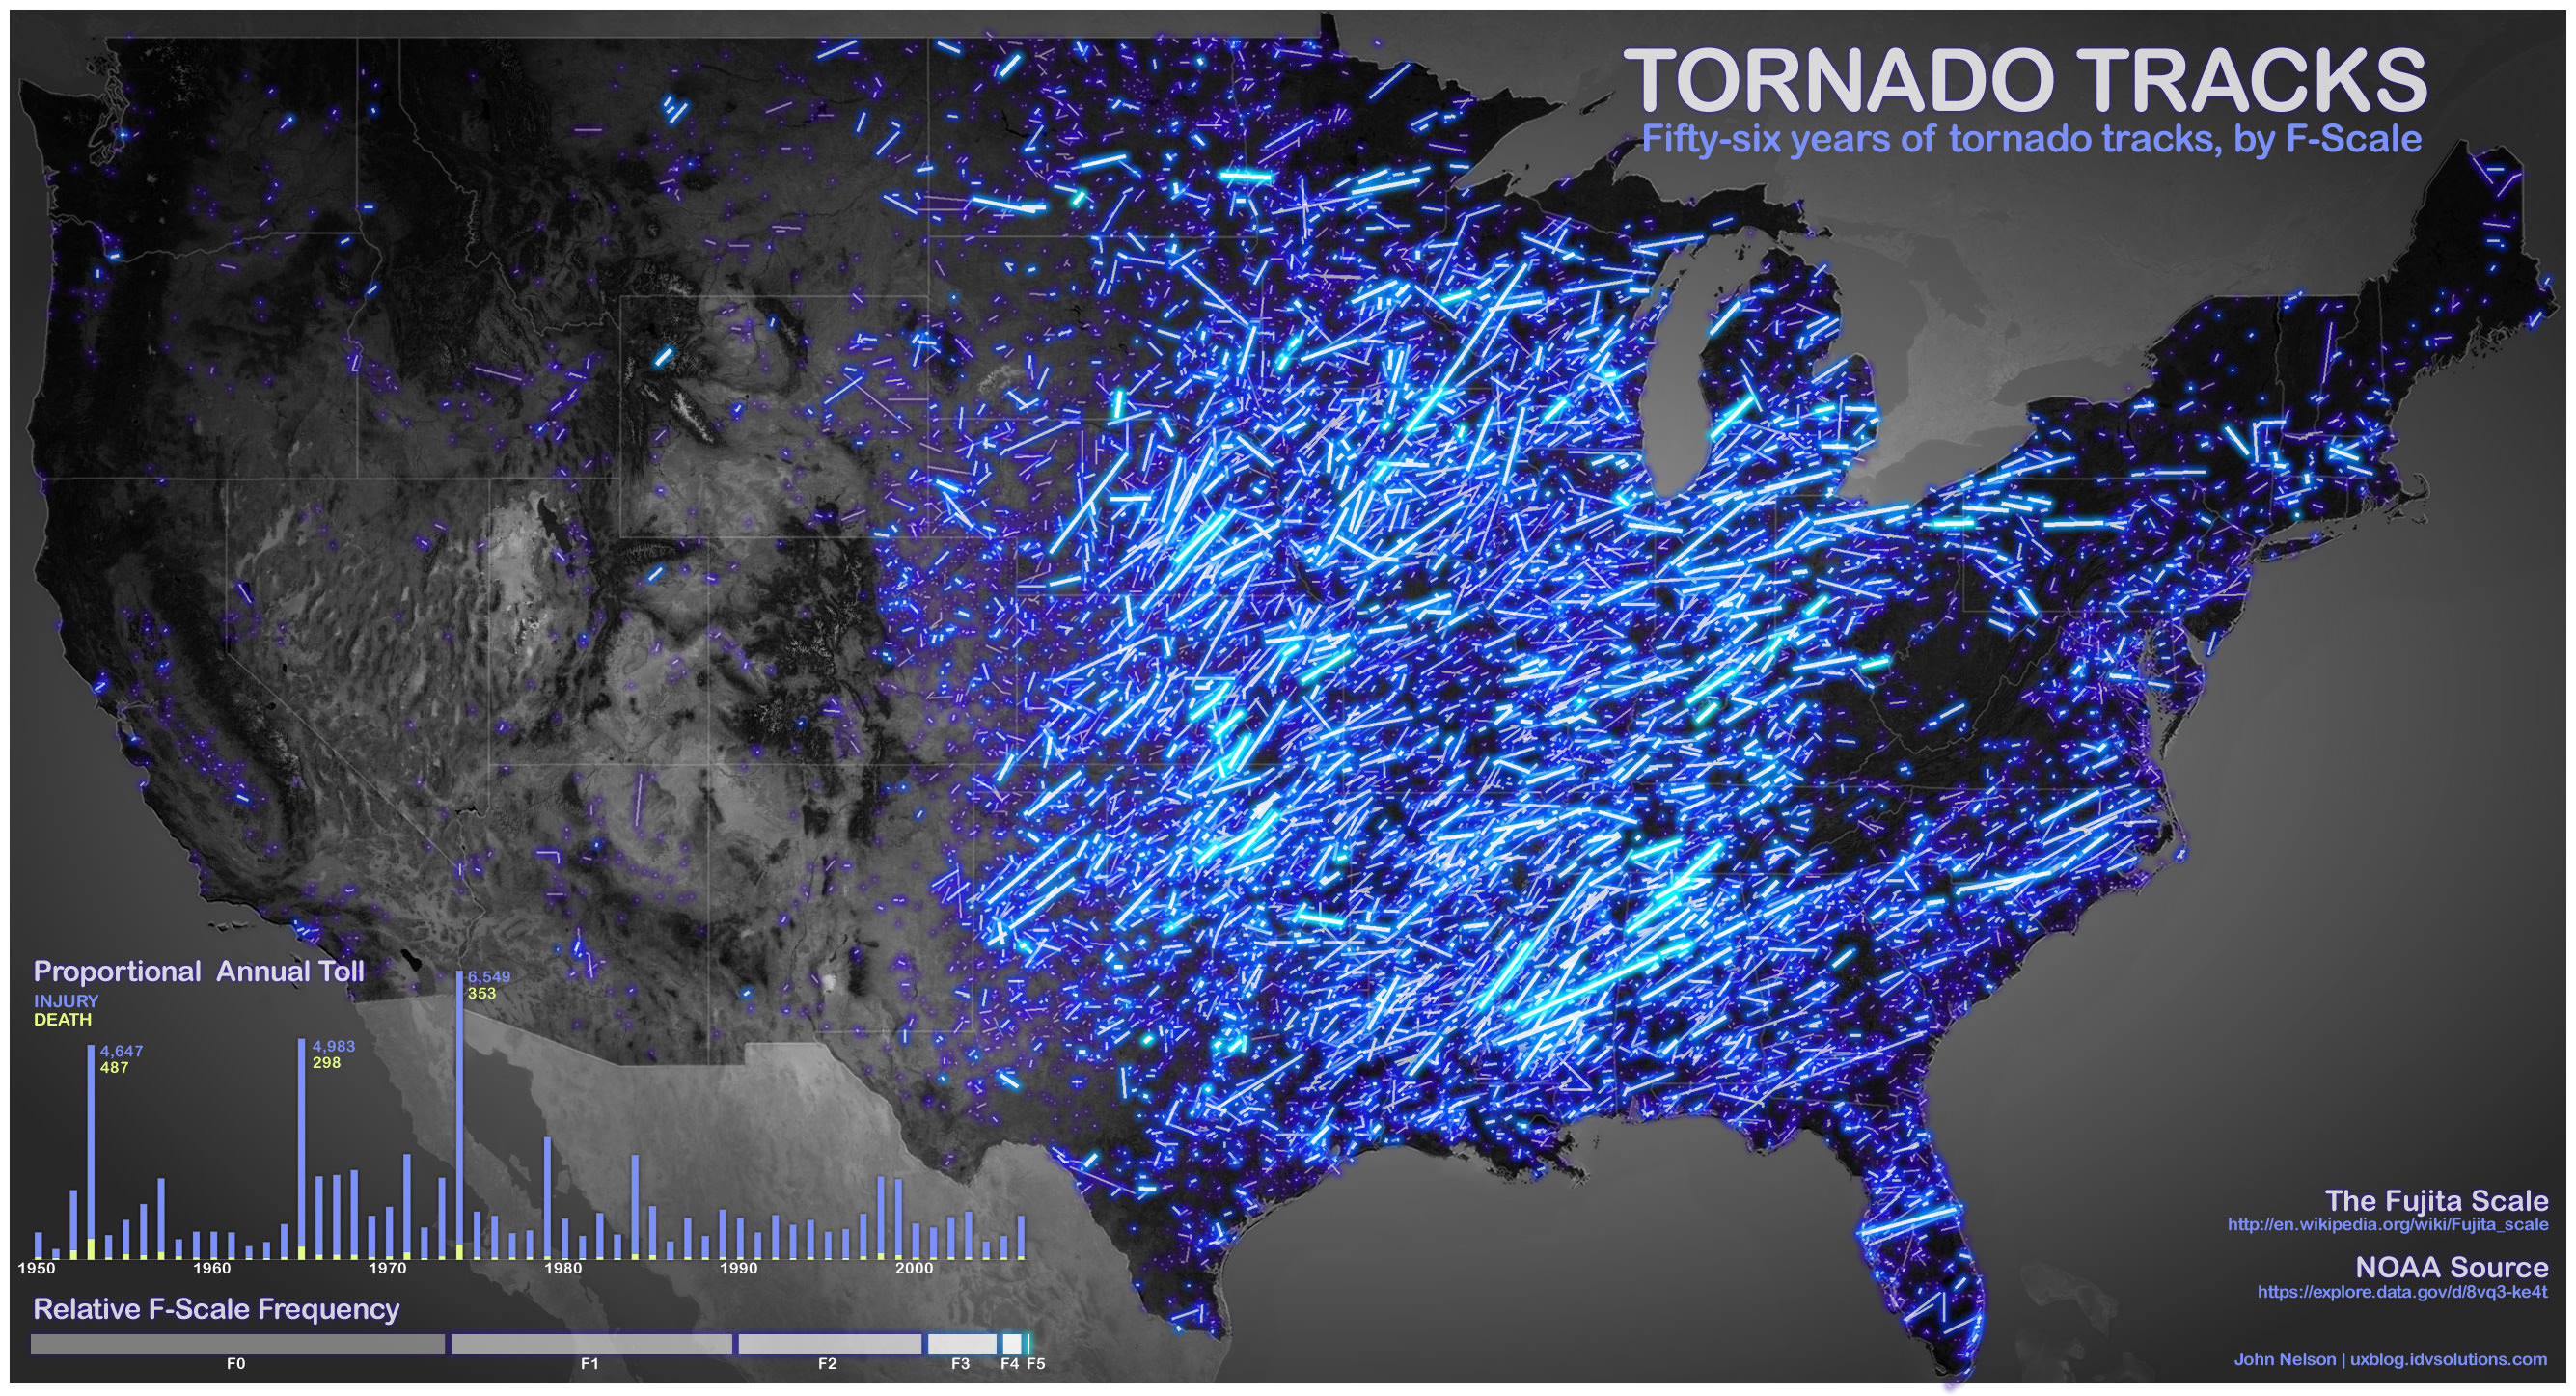
The tracks of tornadoes in the US during the past 56 years, categorized by F-Scale. Credit: John Nelson
[/caption]
It’s a wonder of nature, baby. Using information from data.gov, tech blogger John Nelson has created this spectacular image of tornado paths in the US over a 56 year period. The graphic categorizes the storms by F-scale with the brighter neon lines representing more violent storms.
Makes you want to hang on to something solid.
Nelson also provided some stats on all the storms in the different categories:
The numbers represent total deaths, total injuries, average miles the storms traveled
F0: 7, 267, 2
F1: 111, 3270, 6.58
F2: 363, 10373, 11.4
F3: 958, 18160, 17.80
F4: 1912, 28427, 28.62
F5: 1013, 11038, 38.87
This provides a new appreciation for the term “suck zone” used in the movie “Twister.”
While tornadoes don’t travel in straight lines, Nelson explains that based on the data, the vectors were created using touchdown points and liftoff points.
Nelson said he got the data from this Data.gov page doing a “tornado tracks” search.
If a portion of Earth underwent a major cataclysm, how long would it take for life to recover? The 1980 eruption of Mount St. Helens is giving scientists an unprecedented opportunity to witness a recovery from devastation, as the eruption leveled the surrounding forest, blasted away hundreds of meters of the mountain’s summit, and claimed 57 human lives. Landsat satellites have tracked the what has happened on the mountain, and how the forest was reclaimed — all on its own. This video shows a timelapse of the recovery, with annual images from 1979-2011 from the Landsat satellites, which acquired the images seen here between 1979 and 2011. Continue reading “Watch How Life Recovers from Devastation”
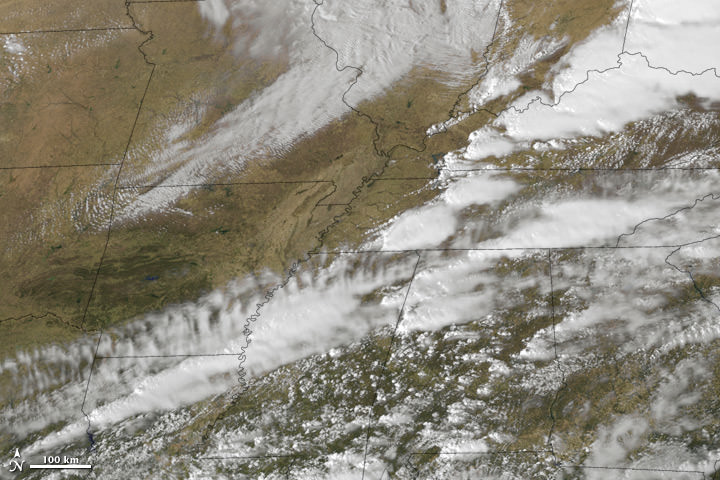
Tornadoes in the Midwest US, March 2, 2012 Tornadoes swept the Midwest US on March 2, 2012. In this image, clouds are rendered using thermal infrared (heat) and visible imagery from the Geostationary Operational Environmental Satellite-East (GOES-East). Background land information is from the Moderate Resolution Imaging Spectroradiometer (MODIS). Image credit: NOAA-NASA GOES Project/NASA Earth Observatory.
[/caption]
The 2012 tornado season got off to a rousing start. Between February 28th and March 3rd, two deadly storm systems developed in the southern United States. The storms spawned numerous tornadoes that together killed at least 52 people. This kind of extreme tornado activity, so early in the year, has fueled fears that global warming will increase the severity and duration of the tornado season. But, scientific studies show that this is not necessarily to be expected.
Early tornadoes are not unheard of. For example, on February 29 in 1952, two tornadoes caused severe damage in the south-eastern US. But this year, the number of early tornadoes has been much higher. The National Oceanic and Atmospheric Administration reported that in January of 2012, the tornado total was 95, much higher than the 1991–2010 average of 35. And the five-day total for February 28 to March 3 could rank as the highest ever since record-keeping began in 1950, according to meteorologist Dr. Jeff Masters, co-founder of the Weather Underground. With such a record-breaking start, it is not surprising people worry that a more severe 2012 storm season is ahead, and that global warming is to blame.
Tornadoes form when warm and moist air from the Gulf of Mexico meets with very cold and dry air above, which was brought south from the arctic. The collision of these air masses, which have different densities, as well as speeds and directions of motion, forces them to want to switch places very rapidly. This creates updrafts of warm and wet air, which produce thunderstorms. And, as the updrafts climb through the atmosphere, they encounter fast- moving jet stream winds, which change speed and direction with altitude. These changes give the updraft a strong twisting motion that spawns tornadoes.
The severity of tornadoes is rated on the Fujita Scale, which examines how much damage is left after a tornado has passed: F0-F1 tornadoes produce minor damage and so are considered weak, F2-F3 tornadoes produce significant damage and are considered strong, and F4-F5 tornadoes produce severe damage and are considered violent. The problem with this ranking is that it is related to a human-based assessment of damage; you need something (buildings, vegetation, etc.) to be destroyed and someone to see the damage. So, a severe tornado that occurs somewhere where there is nothing to be destroyed would be classed as weak, and one that occurs where there is no-one to see the damage wouldn’t even be counted.
National Oceanic and Atmospheric Administration's VORTEX-99 team observed several tornadoes on May 3, 1999, in central Oklahoma. The tube-like funnel is attached at the top to a rotating cloud base and surrounded by a translucent dust cloud near the ground. Image credit: NOAA.
Still, tornado awareness and volunteer reporting programs, along with good record-keeping, have significantly improved our understanding of tornadoes and their frequency. Surprisingly, the Storm Prediction Center’s tornado database, which goes back to 1950, does not show an increasing trend in recent tornadoes. This finding is confirmed by Dr. Stanley Changnon from the University of Illinois at Urbana-Champaign, whose study of insurance industry records was published last year. Dr. Changnon’s work shows that tornado catastrophes and their losses peaked in the years between 1966 and 1973, but have shown no upward trend since that time. In fact, the number of the most damaging storms, those rated as F2 to F5 has actually decreased over the past 5 decades. So, it does not appear that global warming is increasing the number of tornadoes that occur.
This is actually not as surprising as it seems. While a local increase in temperature and humidity, whether caused by global warming or not, would be expected to create more thunderstorms, it is not clear that these thunderstorms would spawn tornadoes. The reason is that global warming does not increase temperatures the same everywhere. Warming at the poles is expected to exceed warming at more southern latitudes. This means that cold polar air will be much less colder than before and warm Gulf of Mexico air will only be slightly warmer. When these two air masses meet above the southern US, the temperature difference between them will not be so great and their drive to swap places will be much less intense. The result will be a significantly slower moving updraft of warm air that is not expected to produce as many extreme thunderstorms or spawn as many tornadoes.
So, global warming is not expected to increase the total frequency of tornado activity. However, warming global temperatures will mean an earlier spring and the potential for earlier tornadoes. In fact, the early tornado numbers we’ve seen so far this year may be a sign of a global warming-induced shift in the tornado season, according to Dr. Masters. If this is the case, the tornado season may start earlier, but it will also end earlier. As meteorologist Harold Brooks from the National Severe Storms Laboratory in Norman, Oklahoma, points out, this record start to the 2012 tornado season does not necessarily mean the rest of the season will be severe.
Sources:
Recap of deadly U.S. tornado outbreak February 28-March 3, 2012, M. Daniel, EarthSky Mar 5, 2012.
NASA Earth Observatory, March 5, 2012.
Temporal distribution of weather catastrophes in the USA, S.A. Changnon, Climatic Change 106 (2), 129-140, 2011, doi: 10.1007/s10584-010-9927-1.
Does Global Warming Influence Tornado Activity? Diffenbaugh et al., EOS 89 (53), 553-554, 2008.
As 2011 is drawing to a close, the festive season is here and many of us are winding down and looking forward to the holidays. But this is a great time to look ahead to 2012 and pencil into our calendar and diaries the top astronomical events we don’t want to miss next year.
2012 is going to be a great year for astronomy observing, with some rare and exciting things taking place and a good outlook with some of the regular annual events.
So what top wonders should we expect to see and what will 2012 bring?
Conjunction of Venus and Jupiter Venus & Jupiter Conjunction Credit: Anthony Arrigo UtahSkies.org
On March 15th the Planets Venus and Jupiter will be within 3 degrees and very close to each other in the early evening sky. This will be quite a spectacle as both planets are very bright (Venus being the brightest) and the pair will burn brightly together like a pair of alien eyes watching us after the Sun sets.
This conjunction (where planets group close together as seen from Earth) will be a fantastic visual and photographic opportunity, as it’s not often you get the brightest Planets in our Solar System so close together.
Transit of Venus Transit of Venus Credit: Australian Space Alliance
For many, the transit of Venus is the year’s most anticipated astronomical event and it takes place on June 5th – 6th. The Planet Venus will pass between the Earth and the Sun and you will see Venus (a small black circle) slowly move across, or “transit” the disc of the Sun.
Transits of Venus are very rare and only a few have been witnessed since the dawn of the telescope. Be sure not to miss this very rare event as the next one isn’t visible for over another 100 years from now in 2117 and the next after that is in 2125.
The full transit of Venus in 2012 will be visible in North America, the northwest part of South America, Western Pacific, North East Asia, Japan, Australia and New Zealand. Other parts of the world will see a partial transit such as observers in the UK, who will only be able to see the last part of the transit as the Sun rises.
First contact will be at 22:09 UT and final contact will be at 04:49 UT
Take note! You have to use the right equipment for viewing the Sun, such as eclipse glasses, solar filters, or projection through a telescope. Never ever look directly at the Sun and never look at it through a normal telescope or binoculars – You will be permanently blinded! The transit of Venus will be a very popular event, so contact your local astronomy group and see if they are holding an event to celebrate this rare occasion.
Meteor Showers Don't Miss the Major 2012 Meteor Showers Credit: Shooting Star Wallpapers
2011 was a poor year for meteor showers due to the presence of a largely illuminated Moon on all of the major showers; this prevented all but the brightest meteors being seen.
In contrast 2012 brings a welcome respite from the glare of the Moon as it gives little or no interference with this year’s major showers. The only other issue left to contend with is the weather, but if you have clear skies on the evenings of these celestial fireworks, you are in for a treat.
The Quadrantid Meteor Shower peak is narrow and just before dawn on January 4th this shower is expected to have a peak rate (ZHR) of around 80 meteors per hour.
The Perseid Meteor Shower peak is fairly broad with activity increasing on the evenings of the August 9th and 10th with the showers peak on the morning of the 12th. Perseids are the most popular meteor shower of the year as it tends to be warm and the shower has very bright meteors and fireballs, with rates of 100+ an hour at its peak.
The Geminid Meteor Shower is probably the best meteor shower of the year with high rates of slow bright meteors. The peak is very broad and rates of 100+ meteors per hour can be seen. The best time to look out for Geminids is on the evenings of the 12th to 14th December, but they can be seen much earlier or later than the peak.
If you want to find out more and enjoy the meteor showers of 2012, why not join in with a meteorwatch and visit meteorwatch.org
Jupiter and the Moon Occultation of Jupiter by the Moon on July 15th as seen from Southern England Credit: Adrian West
European observers are in for a very rare treat as the Moon briefly hides the planet Jupiter on the morning of July 15th. This “lunar occultation” can be seen from southern England and parts of Europe at approximately 1:50am UT (dependant on location) and the planet re-emerges from the dark lunar limb at approximately 3:10am UT.
This is a great chance to watch this rare and bright event, and it will also be a fantastic imaging opportunity.
Annular Eclipse Annular Eclipse Credit: Kitt Peak Observatory
American observers will have treat on May 20th with an annular eclipse of the Sun. The eclipse will be visible from many western US states and a partial eclipse visible from most of North America.
Because the Moon’s orbit is not a perfect circle and is slightly elliptical, it moves closer and further away from us slightly in its orbit by 13% and on July 15th it is at its furthest point away from the Earth as it passes in front of the Sun.
Normally the Moon covers the entire disc of the Sun and creates a total solar eclipse, but because the Moon is at its furthest point in its orbit on the 15th, we get an annular eclipse, where we can still see a ring of bright light around the Sun, but we don’t get totality.
The eclipse starts roughly at 6:20pm local time for the Western US states and lasts for four and a half minutes.
As mentioned earlier; never, ever look at the Sun without proper protection such as eclipse glasses or filters for equipment! This can damage your eyes and permanently blind you. This is the same for cameras; the sensitive chips inside can be damaged.
The World Not Ending
End Of The World
Finally we get to December 21st, in which astronomy-minded folks will celebrate the solstice. But in case you haven’t heard, some have prophesied the end of the world, saying the Mayan calendar ends. This has been the subject of much discussion, comedy and media coverage, and it has even been made into films.
Will the Antichrist press the red button and will there be the Rapture? Will the Earth reverse its magnetic poles, or will we get wiped out by a solar flare, rogue comet or asteroid?
Nope, probably not. You can read our entire series which explains why this whole 2012 end-of-the-world craze is complete hokum.
All I know is 2012 is going to be a great year for astronomy with some very interesting, rare events taking place, with many more regular events to see, as well.
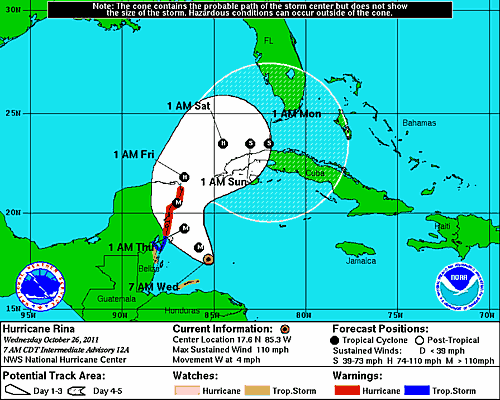
Hurricane Rina's location and forecasted path as of 7 am CDT on Oct 26, 2011. Credit: NOAA
“It’s a big one!” said International Space Station commander Mike Fossum as the space station flew over Hurricane Rina at 2:39 p.m. EDT on Oct. 25, 2011. External cameras on the ISS captured these views as the station flew 248 miles over the Caribbean Sea east of Belize.
Rina’s maximum sustained winds remained steady at about 110 mph early Wednesday, said the U.S. National Hurricane Center in Miami, making it a Category 2 storm. Forecasters predict it will strengthen to a major hurricane as it nears the Mexican coast Wednesday night before rolling over the island of Cozumel, then along the coast to Cancun.
See a map of the Hurricane’s projected path below.
The late season hurricane, which continues to intensify, was located 300 miles east-southeast of Chetumal, Mexico, barely moving west-northwest at a glacial three miles an hour. Hurricane warnings have been issued for the Yucatan from north of Punta Gruesa, Mexico, to Cancun.
Tropical Storm Lee - Visible image from the GOES-13 satellite on Sunday, Sept. 4 at 9:32 a.m. EDT. It shows the extent of Lee's cloud cover over Louisiana, Mississippi, Alabama and the Florida Panhandle and spread into the Tennessee Valley. The thickest clouds and heaviest rainfall stretch from the northeast to southwest of the center. Credit: NASA/NOAA GOES Project
[/caption]
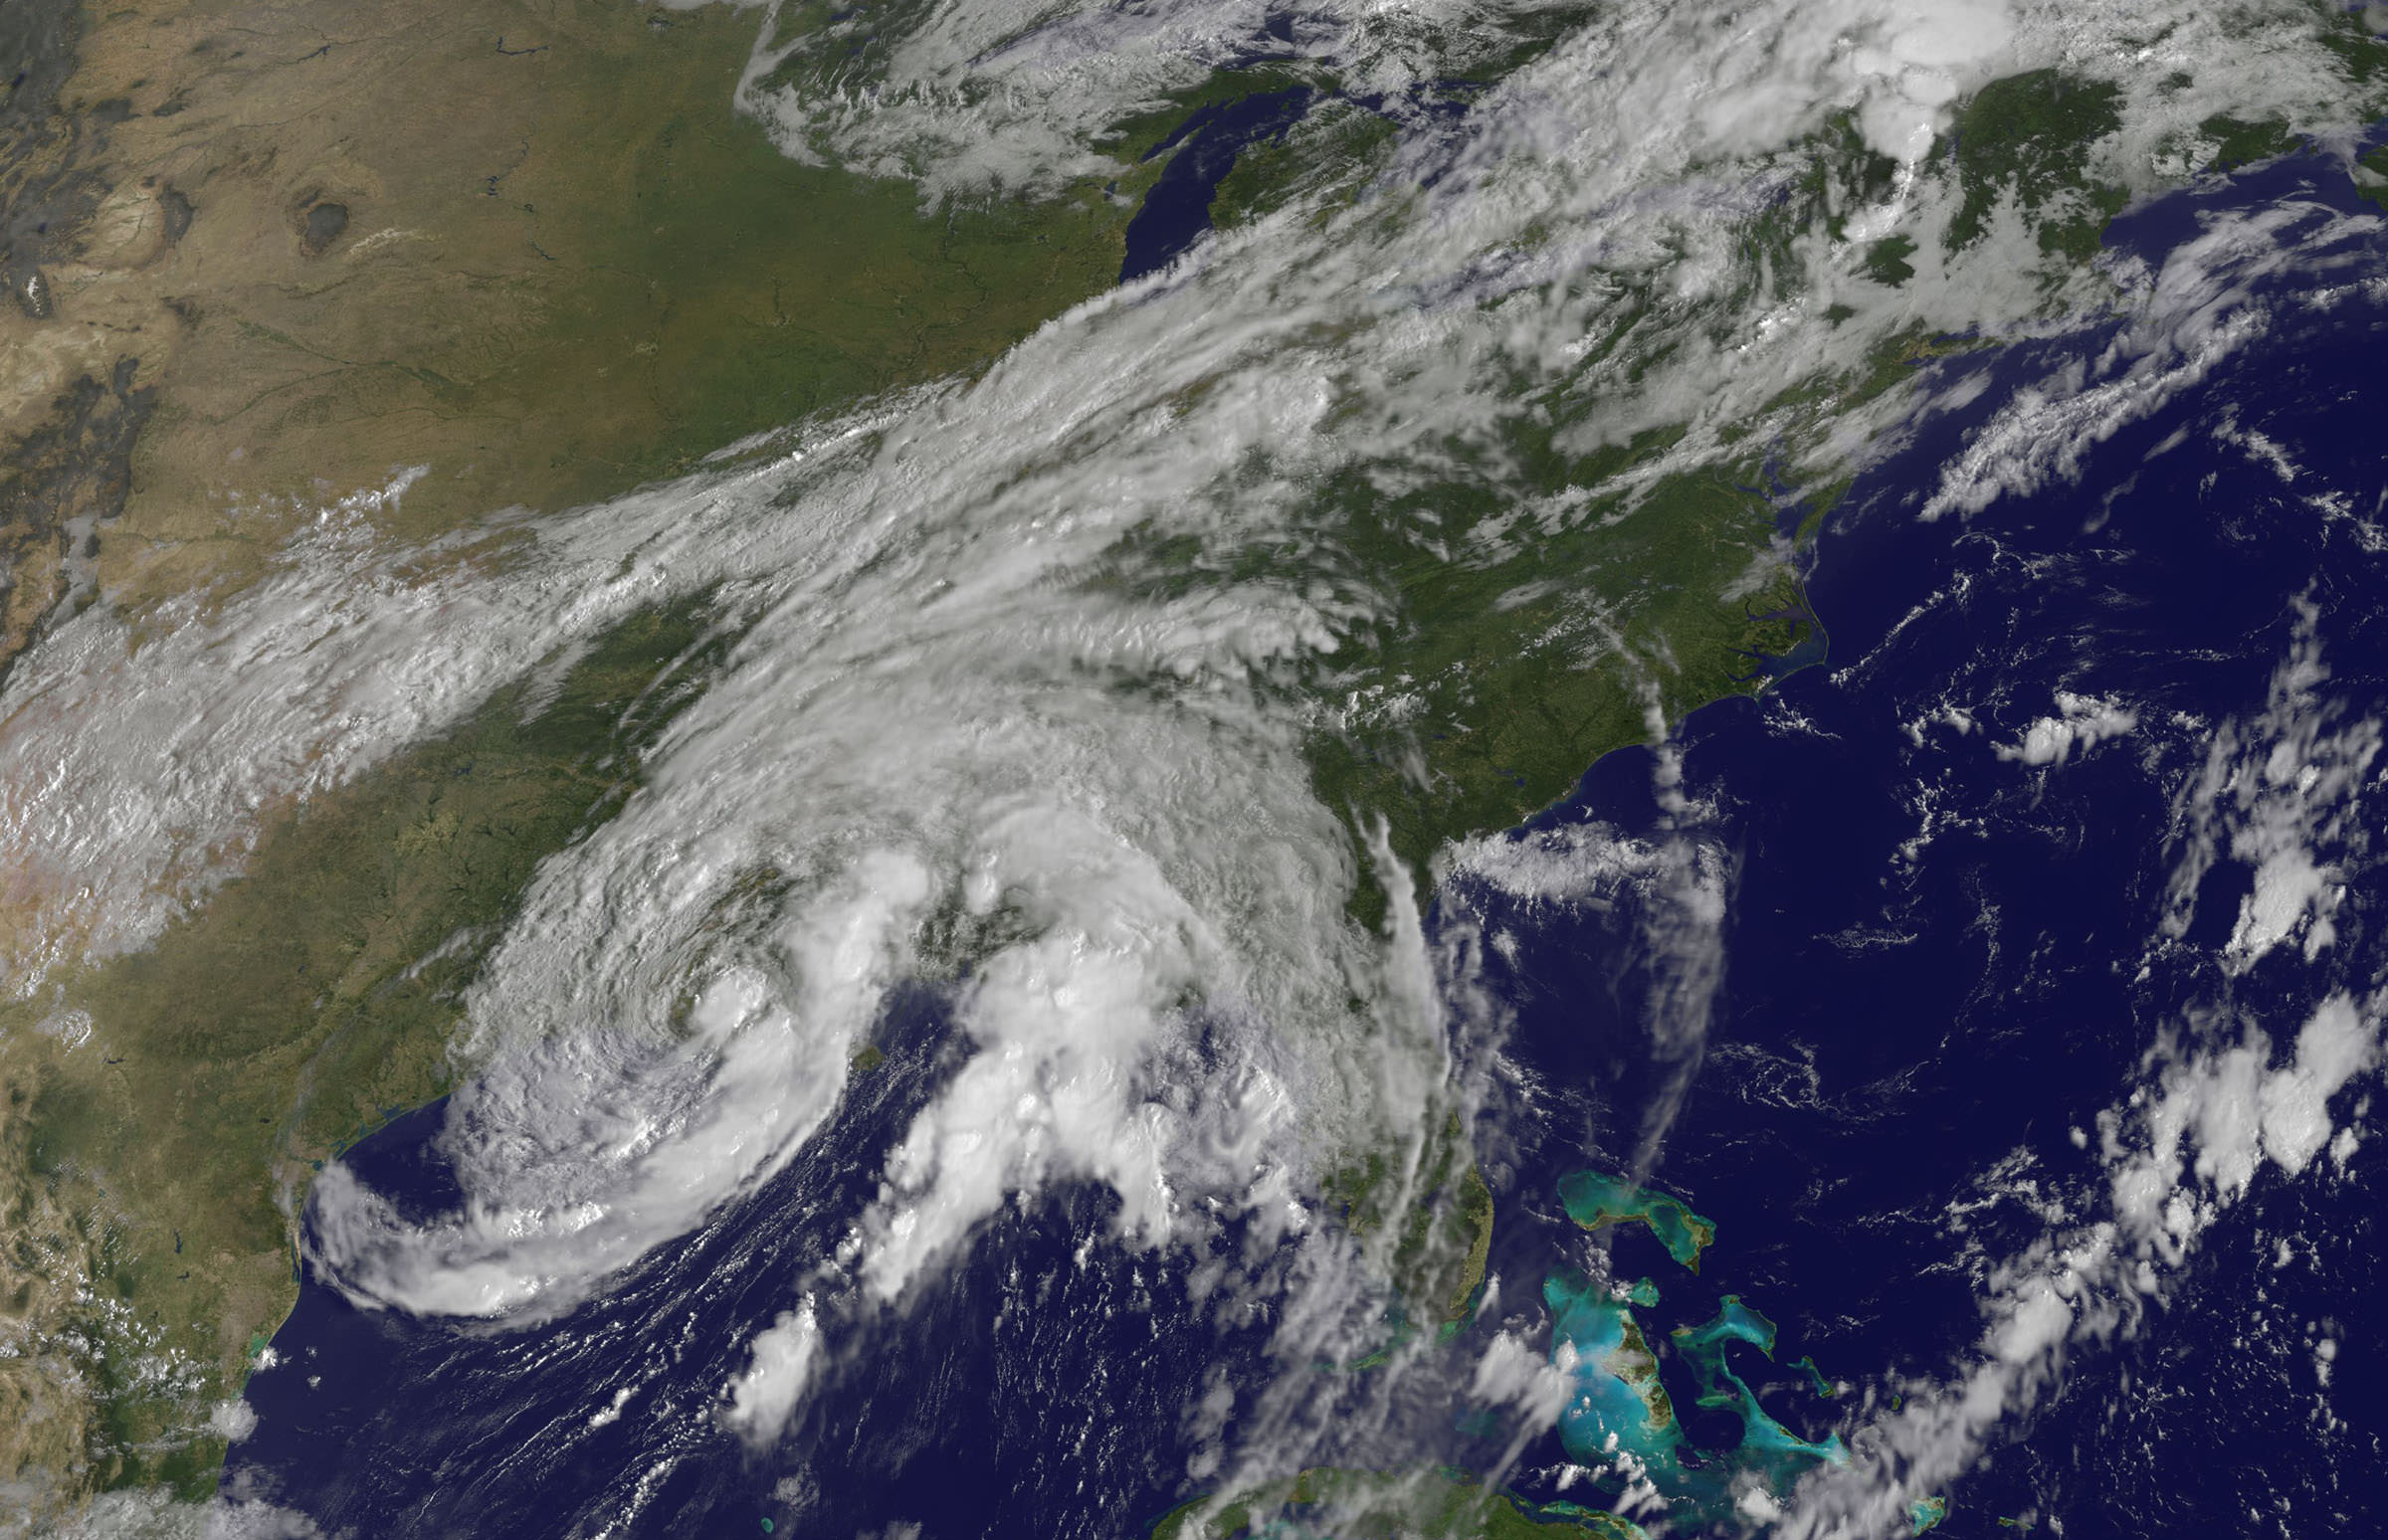
New imagery from NASA and NOAA satellites taken today (Sept 4) shows the extent of a hurricane season storm currently ravaging the US Gulf Coast and another potentially posing a new threat to US East Coast areas still suffering from the vast destruction caused by Hurricane Irene just days ago. Data from the NASA and NOAA satellites is critical in providing advance warning to government officials and local communities to save human lives and minimize property damage. .
Slow moving Tropical Storm Lee has unleashed strong thunderstorms and heavy rainfall in several Gulf Coast states. Rainfall amounts of up to 7 to 14 inches over the last 48 hours are currently drenching coastal and inland communities – especially in Louisiana, Mississippi and Alabama along a wide swath that extends from Texas to the Florida panhandle.
Isolated pockets of Gulf State areas may see up to 20 inches of rainfall. Severe flooding to homes and roads has occurred in some locations. Winds have diminished from 60 mph on Saturday (Sept. 3) to 45 mph on Sunday.
Imagery and measurements from the Aqua and GOES-13 satellites from NASA and NOAA revealed that TS Lee finally made landfall in Louisiana after two days of drenching rain along the Gulf Coast..
A tropical storm warning is in effect on Sept 4 for New Orleans, Lake Pontchartrain, and Lake Maurepas. Fortunately the rebuilt levees in New Orleans appear to holding in the first serious test since the vast destruction of Hurricane Katrina. Other areas are less lucky.
This infrared image of Tropical Storm Lee on Sept. 3 at 3:47 p.m. EDT when the center was still sitting south of the Louisiana coast. The strongest thunderstorms and coldest clouds (purple) stretched from Mobile Bay, south into the Gulf of Mexico and covered about 1/3rd of the Gulf of Mexico. Winds were 55 mph at the time of this image. The image was taken by the AIRS instrument on NASA's Aqua satellite. Credit: NASA JPL, Ed Olsen NASA
Lee’s tropical force winds now extend out 275 miles from the center. A large part of Lee is still over the Gulf of Mexico where the driving wind and rain affected operations on some oil rigs.
Lee has spawned more than a dozen tornadoes in the Gulf Coast states. The storm is spreading more heavy rain and winds on a northeast to east- northeast heading tracking towards Tennessee over the next 24 to 36 hours according to the latest weather forecasts.
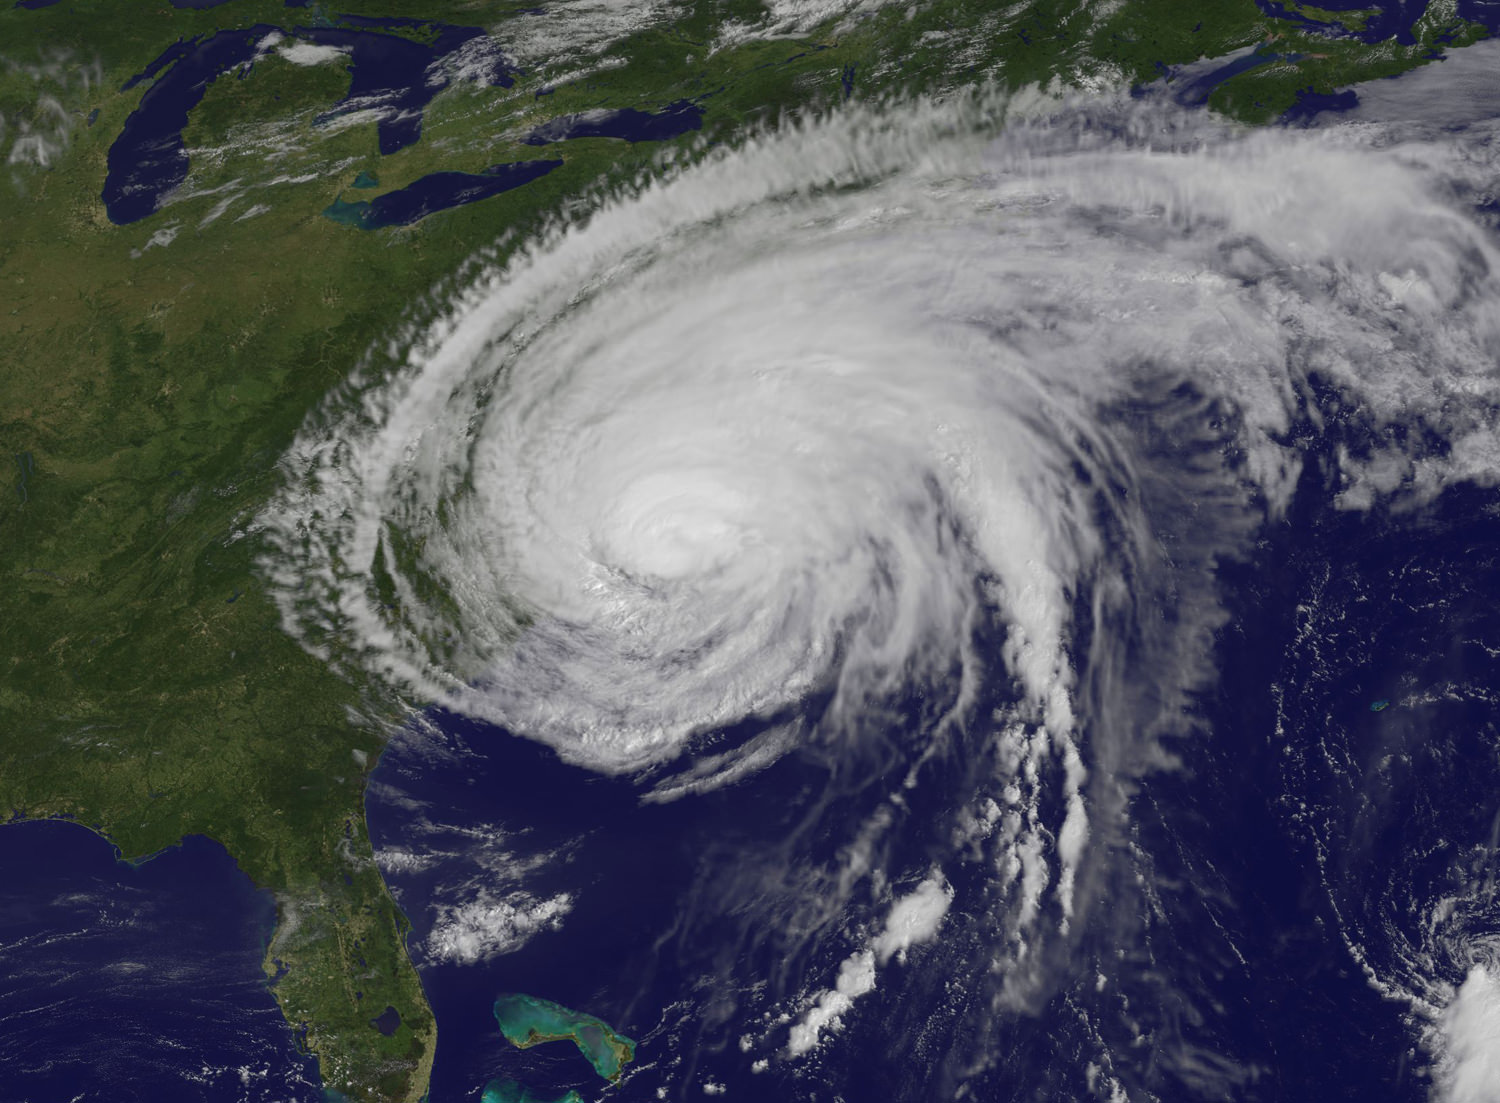
Meanwhile Hurricane Katia is packing winds of 110 MPH and is on a path that could cause it to make landfall on the Outer Banks of North Carolina just a week after the state suffered from Hurricane Irene.
This GOES-13 satellite image shows Hurricane Katia (right), Tropical Depression 13 (left) and System 94L (top). Credit: NASA/NOAA GOES Project
Irene caused extensive flooding and devastation on the hundred year scale in several US states still reeling from flooding and destruction. More than 43 deaths have been reported so far, including emergency rescue workers. Initial damage estimates are over $6 Billion.
Thousands of East Coast homes and businesses are still without power as strong after effects from Irene continue to play out.
President Obama toured flood stricken areas of Paterson, New Jersey today (Sept. 4).
According to a statement by Rob Gutro, of NASA’s Goddard Space Flight Center, Greenbelt, Md; Tropical Storm Lee’s winds had dropped from 60 mph exactly 24 hours before to 45 mph at 8 a.m. EDT on Sept. 4.
Lee’s center was over Vermillion Bay, Louisiana near 29.7 North and 92.0 West. It was crawling to the northeast near 3 mph (6 kmh) and expected to continue in that direction today, turning to the east-northeast tonight. Because Lee’s center is over land, he is expected to continue weakening gradually in the next couple of days. Lee’s outer bands still extend far over the Gulf of Mexico, bringing in more moisture and keeping the system going.
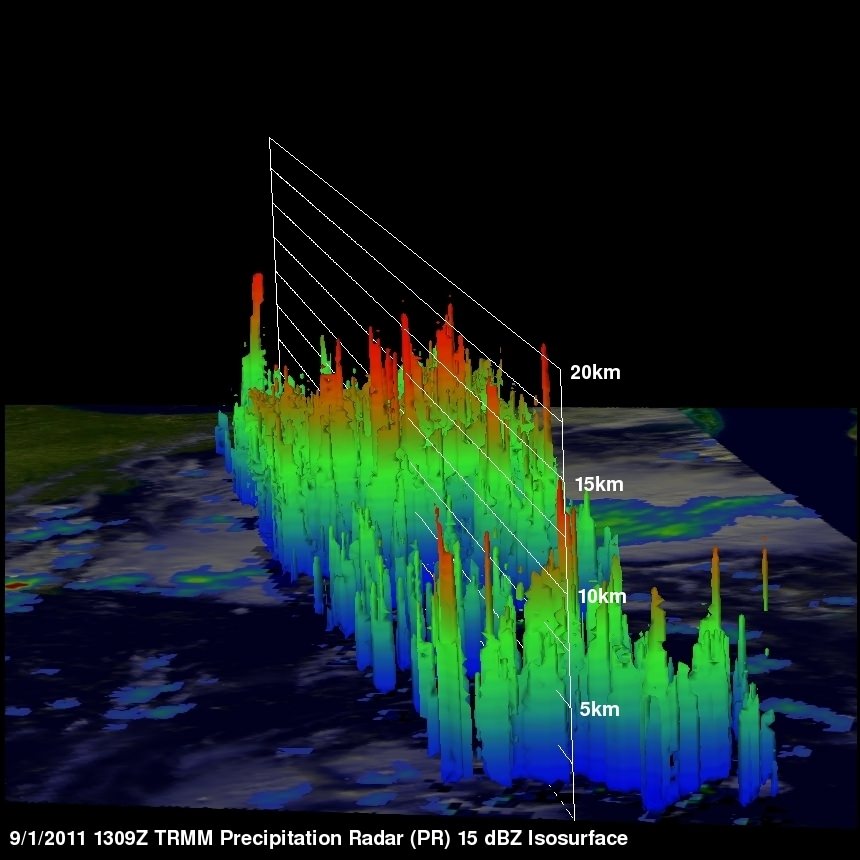
Here's a 3-D look at Tropical Depression 13 from NASA's TRMM Satellite on Sept 1. Some of the highest thunderstorm towers in that area were shown by PR data to reach heights of over 15km (~9.3 miles) and there were areas of heavy rain - which is going to affect the shoreline.. waves of rainfall to move inland. Credit: NASA/GoddardThis visible image of Tropical Storm Lee was taken from the GOES-13 satellite on Saturday, Sept. 3 at 9:32 a.m. EDT. It shows the extent of Lee's cloud cover over Louisiana, Mississippi, Alabama and the Florida Panhandle. The clearing on the southeastern side is a result of drier air moving in and preventing development of thunderstorms. Credit: NASA/NOAA GOES Project
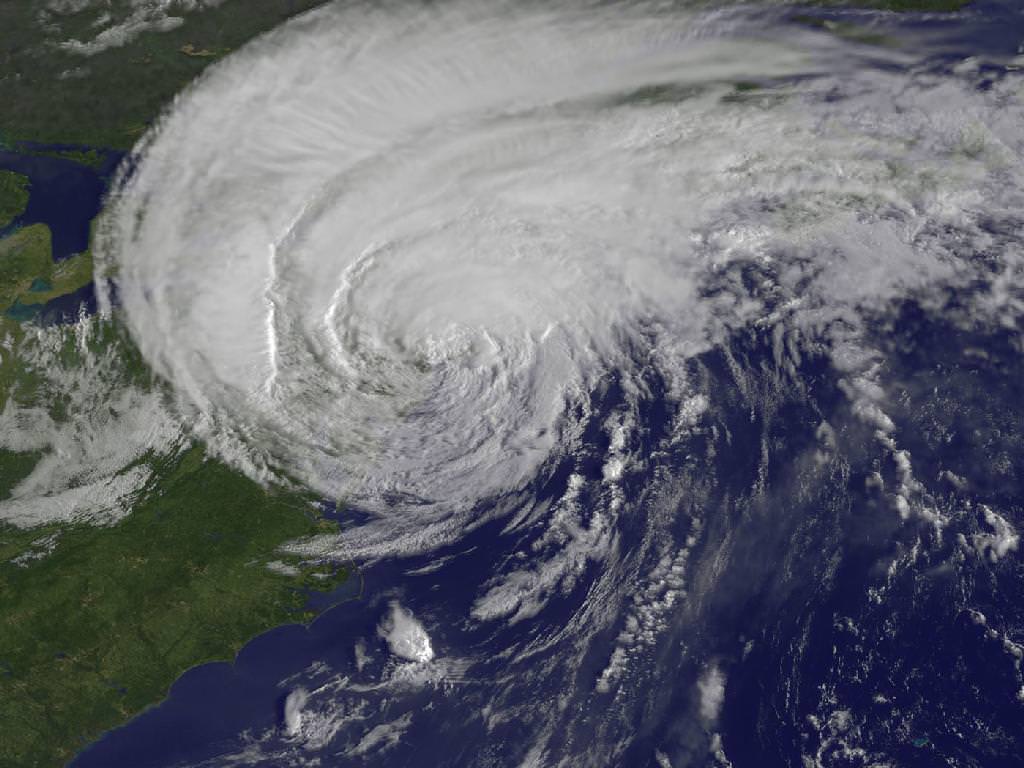
Irene Makes Landfall Over New York. This GOES-13 satellite image is of Hurricane Irene just 28 minutes before the storm made landfall in New York City. The image shows Irene's huge cloud cover blanketing New England, New York and over Toronto, Canada. Shadows in Irene's clouds indicate the bands of thunderstorms that surrounded the storm. Credit: NASA/NOAA GOES Project
NASA Video Caption: The Life of Hurricane Irene from the Caribbean to Canada from August 21 through August 29 seen by NASA/NOAA satellites. Credit: NASA/NOAA/GOES/MODIS
The new NASA animation above shows the birth and subsequent destructive and deadly path followed by Hurricane Irene from August 21 through August 29, 2011 starting in the Caribbean, and then tracking along the US East Cost and up into Canada. The observations combine images taken by NASA and NOAA Earth orbiting satellites.
The cloud images were captured by the NASA/NOAA GOES-13 satellite and overlaid on a true-color NASA MODIS map. Irene followed a lengthy course over Puerto Rico, Hispaniola, the Bahamas, and then along the entire US East with landfalls over North Carolina, New Jersey and New York.
NASA ISS astronaut Ron Garan and cameras flying overhead aboard the International Space Station (ISS) also photographed vivid images showing the magnitude of Irene slamming into the US East coast.
Irene caused widespread property damage. Massive and raging flooding in several US states destroyed houses, crushed businesses and washed away bridges and roads and more. The worst flooding is yet to come to some inland portions of Vermont, New Jersey, New York, Pennsylvania and elsewhere as uncontrollable waters continue to rise at numerous rivers, lakes and even ponds, threatening even more misery in their wake.
[/caption]
So far 41 fatalities in 12 states have been attributed to Irene and more may be expected as searches continue. Some communities have been entirely cut off due to washed out access. Airlifts of food and water have begun. More people are being evacuated from New Jersey towns today, Aug 30.
Brave emergency rescue workers have put their own lives at peril and saved the lives of countless others of all ages from babies to the elderly. Some 8 million customers, including my area, lost power due to extensive flooding, downed trees and electrical wires, and devastated infrastructure.
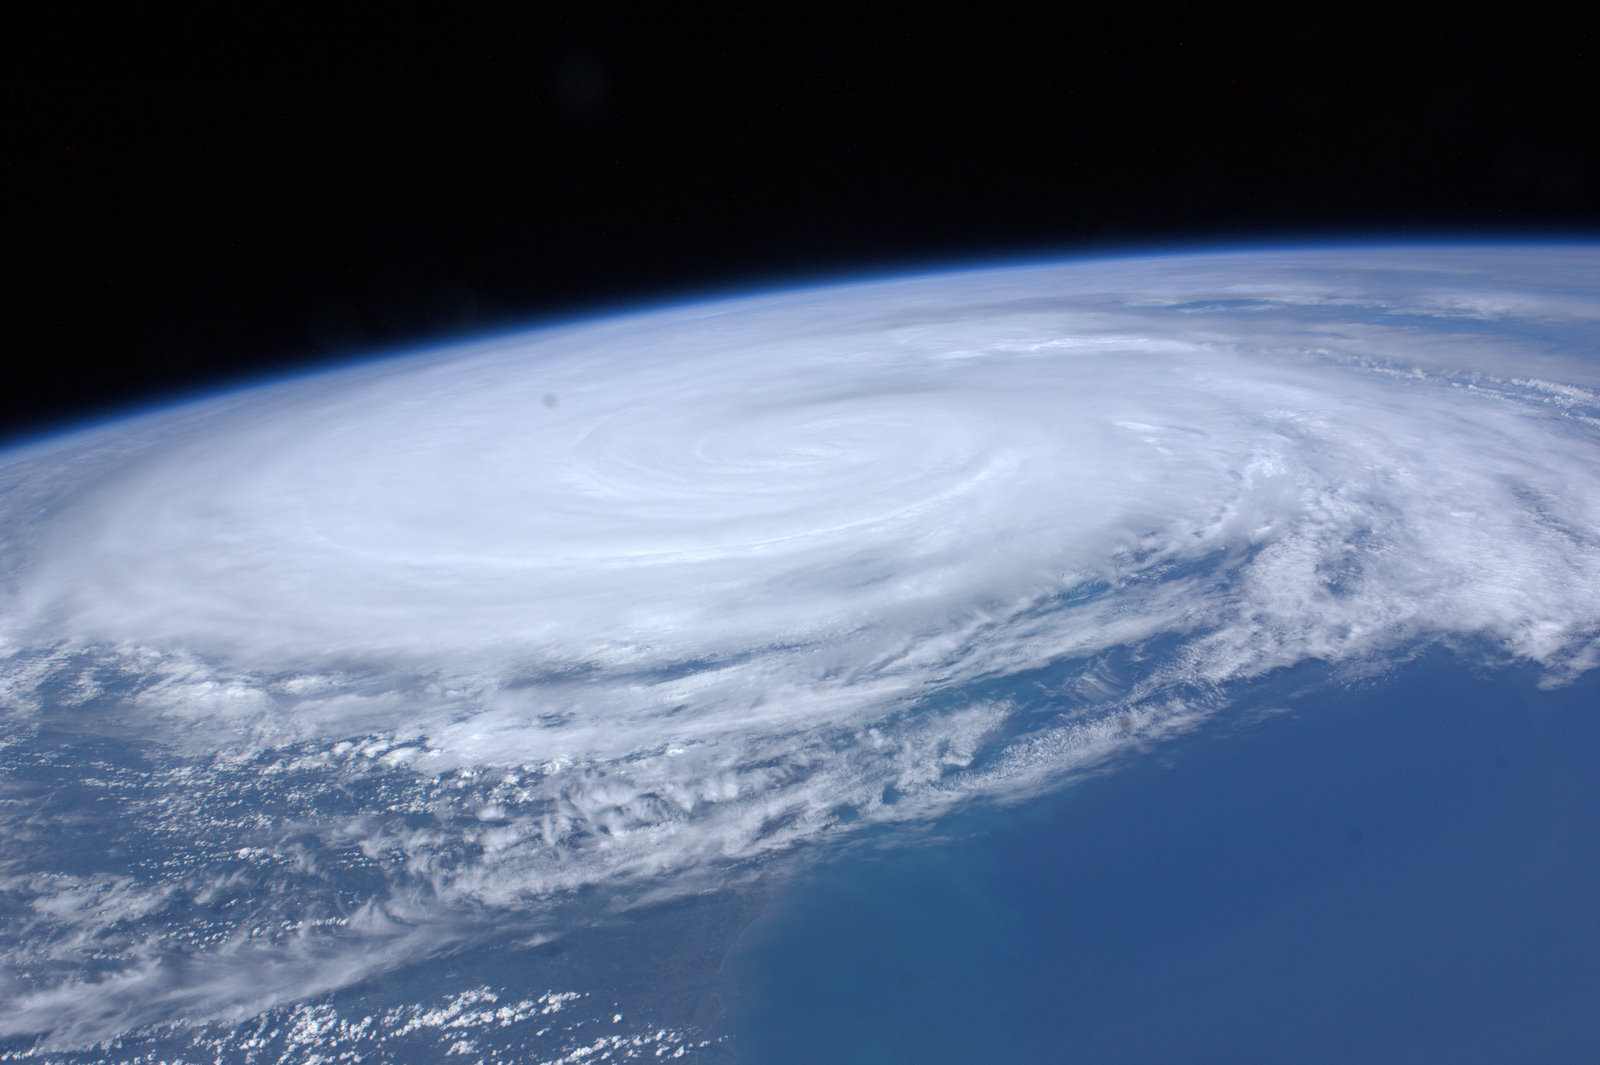
Hurricane Irene twitpic from the International Space Station on 8/27/11 by NASA Astronaut Ron Garan
Irene From Space and the ISS as it crossed the coast on August 27, 2011 at 3:32pm EST. Hope everyone is OK wrote NASA Astronaut Ron Garan with his twitpic from the ISS. Credit: NASA/Ron Garan aboard the ISS
Emergency crews are hard at work to restore power as quickly as possible, but many thousands of homes and businesses could be without power for up to a week or more. About 3.3 million customers are still without power today.
NASA’s GOES-13 satellite captured a dramatic view of Hurricane Irene just 28 minutes prior to making landfall over New York City. Today’s NASA Image of the day shows the humongous cloud cover spanning the US East coast from the Mid-Atlantic States up to New Jersey, New York, Pennsylvania, and New England and into Toronto, Canada.
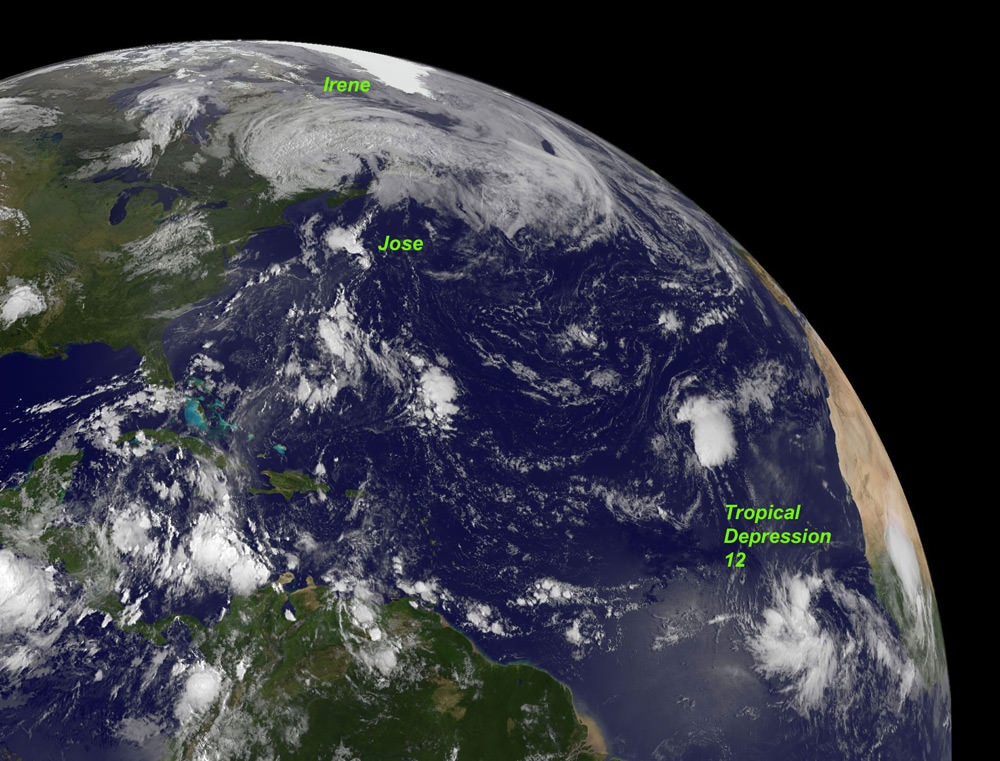
This GOES-13 image from Monday, August 29 at 7:45 a.m. EDT shows an active Atlantic Ocean with the remnants of Hurricane Irene moving into Quebec and Newfoundland (left), Tropical Storm Jose (center) and newly formed Tropical Depression 12 (right). Credit: NASA/NOAA GOES ProjectIrene slams into North Carolina. The GOES-13 satellite saw Hurricane Irene on August 27, 2011 at 10:10 a.m. EDT after it made landfall at 8 a.m. in Cape Lookout, North Carolina. Irene's outer bands had already extended into New England. Credit: NASA/NOAA GOES Project
Many transit systems and airports in Irene’s path were shutdown ahead of the storm.
Send me your photos of Irene’s destruction to post at Universe Today.
GOES satellite image of Hurricane Irene as of 18:15 UTC on August 26, 2011. Credit: NOAA
What a view: Here’s a video of Hurricane Irene’s path, starting on August 24 up until 18:40 UTC on August 26, 2011, as seen by a GOES satellite. Even though Hurricane Irene is continuing to slowly weaken as it pushes closer to the Carolina coast, this massive storm could affect a huge area of the Eastern US seaboard, and tropical storm force winds and squalls are buffeting the coast. Irene will impact the entire Mid-Atlantic and Northeast Coast, including Washington, Philadelphia, New York City, Hartford, Ct. and Boston this weekend.
This hurricane spans nearly 1,000 kilometers (600 miles).
Below is a video taken from the International Space Station late yesterday afternoon. Includes astronaut commentary on the view of this “huge, scary storm” from 370 km (230 miles) up:
Cameras mounted on the International Space Station captured this video. Forecasters are predicting landfall on the outer banks of North Carolina Saturday before tracking up the mid-Atlantic states and a possible path over the metropolitan New York area and New England late this weekend.
[/caption]
Hot off the wires is this satellite image of Hurricane Irene taken less than an hour ago (as of this writing) by one of the GOES satellites for NOAA.


 on the Terra satellite on August 25. Credit: NASA")