So You Want to Look at the Moon?

The Moon. Photo credit: NASA.

This Saturday September 22, 2012 marks the 3rd annual International Observe the Moon Night (InOMN), when people all over the world will gather to observe the Moon. But what do you do the rest of the year? Luckily, in today’s internet age, there is a great deal of lunar data, from a range of missions, available on-line for you to look at. Also, some great tools have been developed that make data easy to access, put into context, and interpret, giving everyone the power to explore the Moon like a scientist. All you need to do it click on the URL and you’re off…

InOMN was originally started in as a celebration of the wonderful lunar data that was being returned by missions such as the Lunar Reconaissance Orbiter, Chandrayaan-1, and other spacecraft. Since then it has grown to phenomenal proportions, with hundreds of individual events hosted literally all over the world. To learn more about InOMN, or to find the event nearest you, visit the InOMN website.

But what do you do if there is no event being hosted near you, or if the weather turns cloudy in your geographic region? You can always join the CosmoQuest InOMN Hangout on Google+.

For more information about InOMN, listen to a 365 Days of Astronomy podcast on this year’s event.

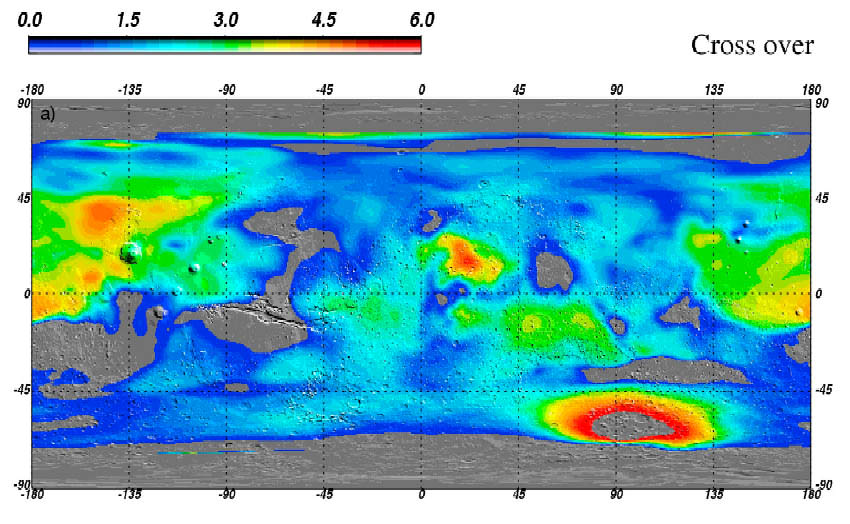
However, a true passion and interest in the Moon is not a one day thing. What if you want to look at the Moon on some other day, or see details that are too small to be resolved by even the largest telescopes on Earth? As it happens, data from those same missions that inspired the very first InOMN is very easy for the average person to see, any time they want to. Lunar Reconnaissance Orbiter Camera (LROC) data from the Lunar Reconnaissance Orbiter and Moon Mineralogy Mapper (M3) data from the Chandrayaan-1 spacecraft can be accessed on-line using the ACT-REACT Quick Map tool.

ACT-REACT Quick Map tool
ACT-REACT Quick Map (http://target.lroc.asu.edu/da/qmap.html) places skinny little strips of high resolution data from the Lunar Reconnaissance Orbiter Camera into context on the Moon. Credit: NASA/GSFC/Arizona State University.


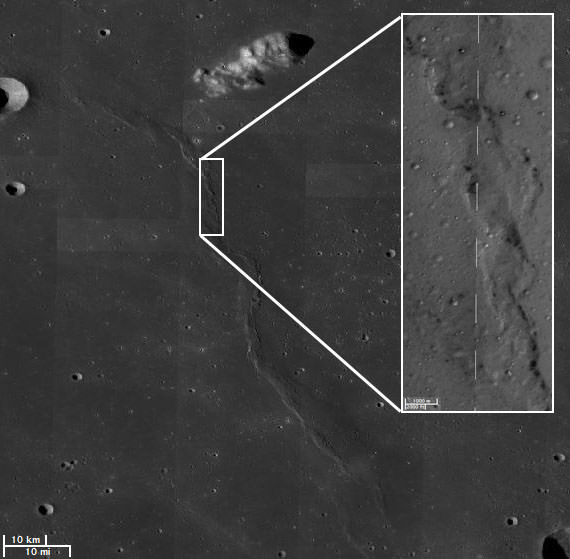
This LROC version of the ACT-REACT Quick Map tool (there is also a MESSENGER version for Mercury data) was originally developed by the LROC team to place skinny little strips of LROC Narrow Angle Camera data into context on the Moon, and to help with targeting for further high resolution data collection. They partnered with software firm Applied Coherent Technology (ACT) to create this relatively user friendly on-line tool, and then made it accessible for anyone who wants to use it!

The interface of the ACT-REACT Quick Map tool is fairly intuitive. If you have used Google Maps, you should be able to navigate your way around fairly quickly. For more details on the available features, check out the LROC data user tutorial and the M3 data user tutorial. Though, one of the first things you might want to know how to do is to turn off the bright colours that represent elevation (uncheck the LROC WAC Color Shaded Relief checkbox). This shaded relief layer is great when you want to understand the topography of fairly large features, but is more distracting than helpful when looking at highest resolution data.

Colour Shaded Relief layer
The colour shaded relief data is great at showing off the elevation of large features, but is less useful when zoomed in to smaller scales. Turn it off by unchecking the LROC WAC Color Shaded Relief checkbox. Credit: NASA/GSFC/Arizona State University


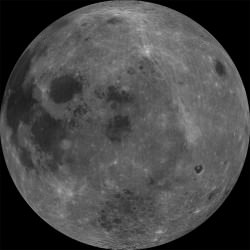
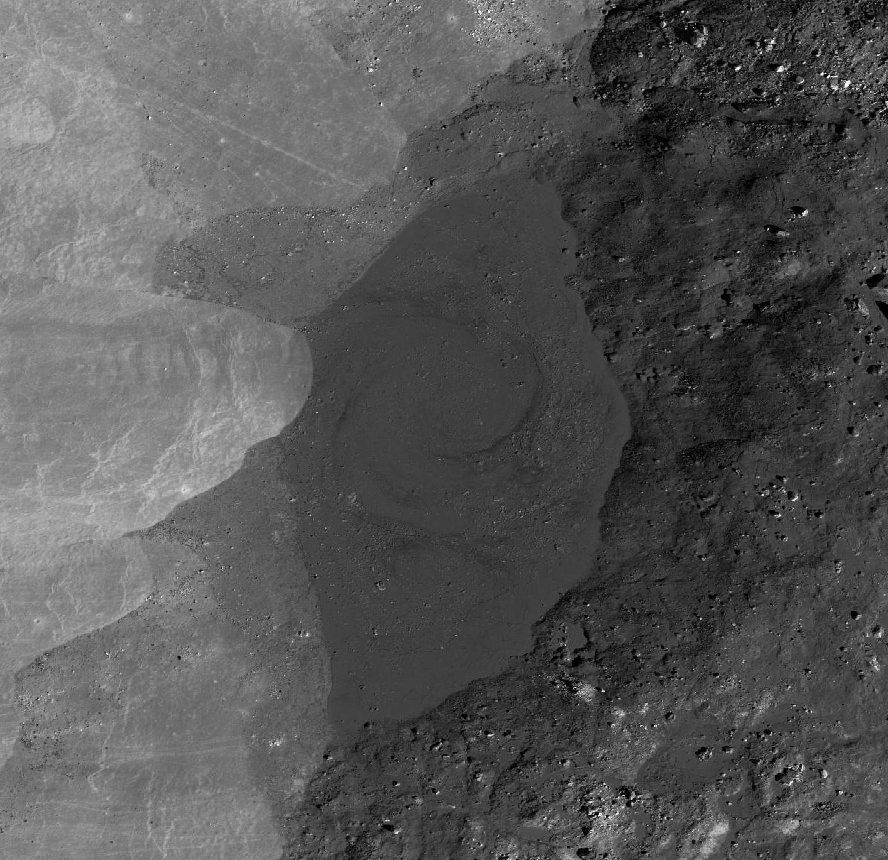
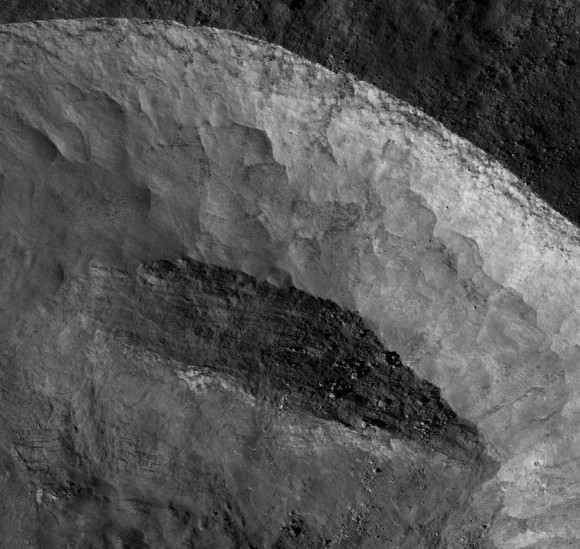
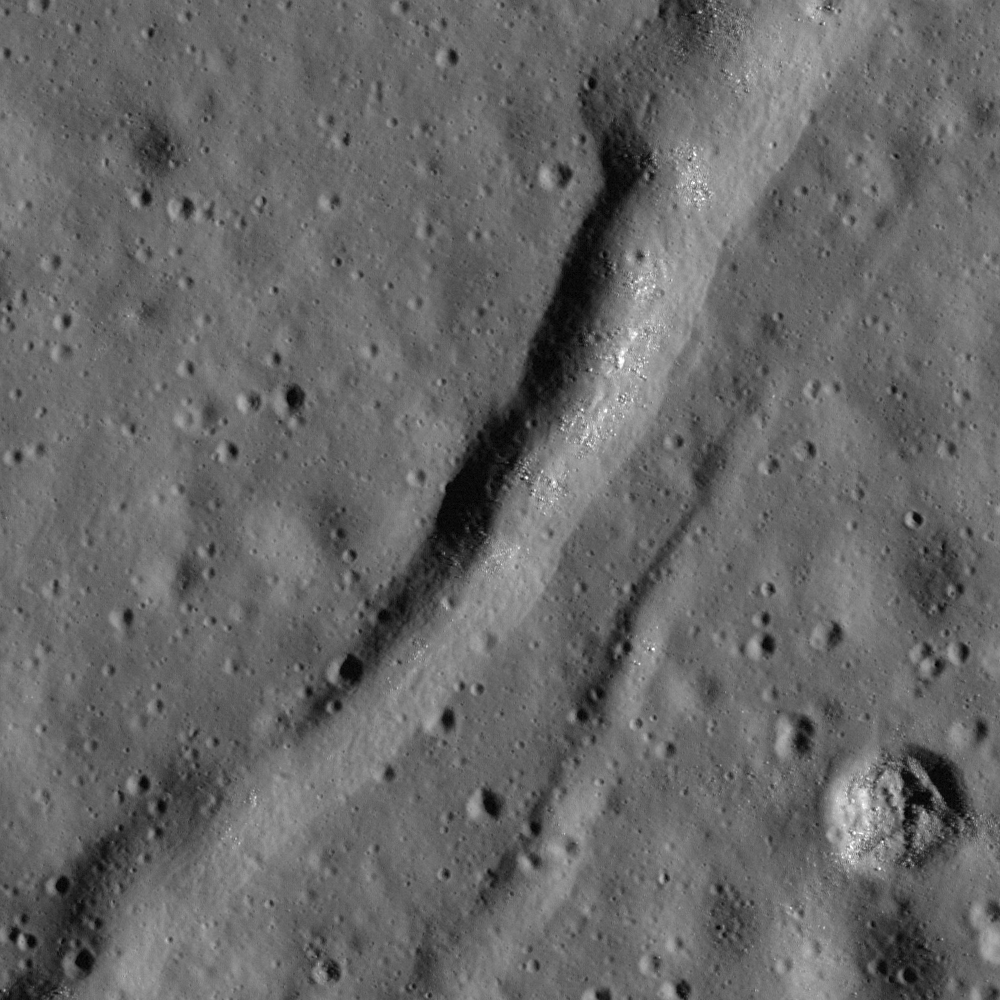
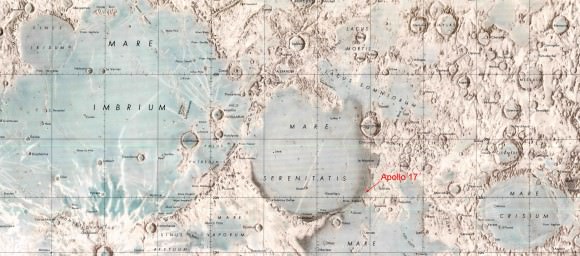
The most exciting thing about the ACT-REACT Quick Map tool is that it makes these amazing lunar data sets available to the public in a way that was never possible before. Anyone sitting at their computer at home can study the Moon, viewing large lunar features, like impact basins and maria, and then zooming into to see details as small as their desk. This kind of technological advance opens the door for every enthusiast to conduct their own personal explorations of the Moon, and gives them an opportunity to see and think like the scientists who are currently working with this data to discover new and exciting information about our Moon.

Landslides Zoom-In
Zooming in allows you to see spectacular landslides along the walls of a crater. At the highest resolutions, individual boulders can be seen. Credit: NASA/GSFC/Arizona State University


So, after International Observe the Moon Night is over, don’t wait until next year to look at the Moon again. Head over to ACT-REACT Quick Map and start exploring!

Thin Skinned and Wrinkled, Mercury is Full of Surprises

[/caption]

Until relatively recently, Mercury was one of the most poorly understood planets in the inner solar system. The MESSENGER mission to Mercury, is changing all of the that. New results from the Mercury Laser Altimeter (MLA) and gravity measurements are showing us that the planet closest to our sun is thin skinned and wrinkled, which is very different from what we originally thought.

The MErcury Surface, Space ENvironment, GEochemistry, and Ranging (MESSENGER) spacecraft was launched back in 2004. It took a long time getting to its destination, completing 3 flybys of Mercury before finally entering orbit a little over a year ago. Currently, the spacecraft is in a highly eccentric polar orbit, approaching the planet much closer in the north than in the south. This allows the northern hemisphere to be probed and imaged at enviably high resolutions, but leaves the southern hemisphere poorly understood.

Even so, the data returned from MESSENGER is showing us some quite unanticipated findings. Two papers from the MESSENGER team, published in today’s issue of Science, are showing some surprising results from the laser altimeter and gravity experiments.

Using NASA’s Deep Space Network, Earth-based radio tracking of MESSENGER has allowed minute changes in the spacecraft’s orbit to be monitored and recorded. From this, Dr. Maria Zuber of MIT and her team calculated a model of Mercury’s gravity. Meanwhile, the on-board laser altimeter has provided invaluable topographic information. Combined together, these data have allowed the MESSENGER team to glean a great deal of information about the planet’s interior workings.

One of the most striking findings is that the iron-rich core of Mercury is very large. A combination of measurements and models suggest that the core has both a solid interior portion and a liquid outer portion. And while it is not certain how much of the core is solid and how much is liquid, it is clear that the total core has a radius of about 2030 km. This is a huge core, representing 83% of Mercury’s 2440 km radius!

Interior of Mercury vs Earth
The internal structure of Mercury is very different from that of the Earth. The core is a much larger part of the whole planet in Mercury and it also has a solid iron-sulfur cover. As a result, the mantle and crust on Mercury are much thinner than on the Earth.
Credit: Case Western Reserve University

Furthermore, these calculations suggest that the layer above the core is much denser than previously expected. Results from MESSENGER’s X-Ray spectrometer indicate that the crust, and by extension the mantle, are too low in iron to explain this high density. Dr. Zuber’s team think that the only way to explain this discrepancy is by the presence of a solid iron-sulfur layer just above the core. Such a layer could be anywhere from 20 to 200 km thick, leaving only a very thin crust and mantle at the top. This kind of interior structure is completely different from what was originally suggested for Mercury, and it is nothing like what we have seen in the other planets!

This striking fact may help explain some unexpected altimeter results, which show that Mercury’s topography has less variation than other planets. The total difference between the highest and lowest elevations on Mercury is only 9.85 km. Meanwhile, the Moon has a total difference of 19.9 km between its highest and lowest points, and on Mars this difference is 30 km. Dr. Zuber and her team speculate that the presence of the core so close to the surface could keep the mantle hot, allowing topographic features to relax. In such a scenario, the lithosphere under tall impact-formed mountains would sink down into a mushy mantle that cannot support their weight. Conversely, the thin lithosphere under impact basins would rebound upwards, taking part of the mobile mantle with it.

In fact, the gravity data shows evidence of exactly this kind of process, in the form of “mascons”. These mass concentrations form when large imacts make the local crust very thin, allowing denser mantle material to rise closer to the surface as the lithosphere rebounds from the impact event. Mascons are well known from studies on the Moon and Mars, and now MESSENGER’s gravity data has revealed three such mascons on Mercury, located in the Caloris, Sobkou, and Budh basins.

Mercury Topography Northern Hemisphere
The elliptical polar orbit of the MESSENGER spacecraft means that measurements at the North Pole of Mercury are much better than those at the South Pole, or even at the equator. This is evident in the better spatial resolution that can be seen at the high latitudes in this elevation map of the northern hemisphere. Major impact structures are identified by black circles.
Credit: NASA/Johns Hopkins University Applied Physics Laboratory/Carnegie Institution of Washington

Interestingly enough, the mascons in Sobkou and Budh basins are not immediately obvious. They only show up when the effects of a regional topographic high are adjusted for. This topographic feature is a large quasi-linear rise that extends over half the circumference of Mercury in the mid-latitudes. The rise even passes through the northern part Caloris basin (which is large enough that its mascon is not overwhelmed by the rise). Studies of this rise by the MESSENGER team suggest that it is relatively young, having formed well after the formation of the basins, after the volcanic flooding of their interiors and exteriors, and even after some of the later impact craters that cover the flooded surfaces.

Dr. Zuber and her team also identified another young topographically elevated region, the Northern Rise, located in the lowlands surrounding the North Pole. They speculate that these young rises represent a buckling of the lithosphere, which happened when the planet’s interior cooled and contracted. This interpretation is supported by the presence of lobate scarps and ridges that can be seen around the planet, and which represent faulting of the crust when it was compressed.

So, it seems that Mercury is unlike the other planets of the Solar System. It appears to have a disproportionately large core that is covered by a thin skin of mantle and lithosphere. Furthermore, this skin seems to have wrinkled like a raisin’s when the huge core of the planet shrunk as it cooled.

Sources
Gravity Field and Internal Structure of Mercury from MESSENGER, Smith et al., Science V336 (6078), 214-217, April 13 2012, DOI:10.1126/science.1218809

Topography of the Northern Hemisphere of Mercury from MESSENGER Laser Altimetry, Zuber et al., Science V336 (6078), 217-220, April 13 2012, DOI:10.1126/science.1218805

Fears of Tornado Catastrophes Due to Global Warming Unfounded

Tornadoes in the Midwest US, March 2, 2012 Tornadoes swept the Midwest US on March 2, 2012. In this image, clouds are rendered using thermal infrared (heat) and visible imagery from the Geostationary Operational Environmental Satellite-East (GOES-East). Background land information is from the Moderate Resolution Imaging Spectroradiometer (MODIS). Image credit: NOAA-NASA GOES Project/NASA Earth Observatory.

[/caption]

The 2012 tornado season got off to a rousing start. Between February 28th and March 3rd, two deadly storm systems developed in the southern United States. The storms spawned numerous tornadoes that together killed at least 52 people. This kind of extreme tornado activity, so early in the year, has fueled fears that global warming will increase the severity and duration of the tornado season. But, scientific studies show that this is not necessarily to be expected.

Early tornadoes are not unheard of. For example, on February 29 in 1952, two tornadoes caused severe damage in the south-eastern US. But this year, the number of early tornadoes has been much higher. The National Oceanic and Atmospheric Administration reported that in January of 2012, the tornado total was 95, much higher than the 1991–2010 average of 35. And the five-day total for February 28 to March 3 could rank as the highest ever since record-keeping began in 1950, according to meteorologist Dr. Jeff Masters, co-founder of the Weather Underground. With such a record-breaking start, it is not surprising people worry that a more severe 2012 storm season is ahead, and that global warming is to blame.

Tornadoes form when warm and moist air from the Gulf of Mexico meets with very cold and dry air above, which was brought south from the arctic. The collision of these air masses, which have different densities, as well as speeds and directions of motion, forces them to want to switch places very rapidly. This creates updrafts of warm and wet air, which produce thunderstorms. And, as the updrafts climb through the atmosphere, they encounter fast- moving jet stream winds, which change speed and direction with altitude. These changes give the updraft a strong twisting motion that spawns tornadoes.

The severity of tornadoes is rated on the Fujita Scale, which examines how much damage is left after a tornado has passed: F0-F1 tornadoes produce minor damage and so are considered weak, F2-F3 tornadoes produce significant damage and are considered strong, and F4-F5 tornadoes produce severe damage and are considered violent. The problem with this ranking is that it is related to a human-based assessment of damage; you need something (buildings, vegetation, etc.) to be destroyed and someone to see the damage. So, a severe tornado that occurs somewhere where there is nothing to be destroyed would be classed as weak, and one that occurs where there is no-one to see the damage wouldn’t even be counted.

National Oceanic and Atmospheric Administration's VORTEX-99 team observed several tornadoes on May 3, 1999, in central Oklahoma. The tube-like funnel is attached at the top to a rotating cloud base and surrounded by a translucent dust cloud near the ground. Image credit: NOAA.

Still, tornado awareness and volunteer reporting programs, along with good record-keeping, have significantly improved our understanding of tornadoes and their frequency. Surprisingly, the Storm Prediction Center’s tornado database, which goes back to 1950, does not show an increasing trend in recent tornadoes. This finding is confirmed by Dr. Stanley Changnon from the University of Illinois at Urbana-Champaign, whose study of insurance industry records was published last year. Dr. Changnon’s work shows that tornado catastrophes and their losses peaked in the years between 1966 and 1973, but have shown no upward trend since that time. In fact, the number of the most damaging storms, those rated as F2 to F5 has actually decreased over the past 5 decades. So, it does not appear that global warming is increasing the number of tornadoes that occur.

This is actually not as surprising as it seems. While a local increase in temperature and humidity, whether caused by global warming or not, would be expected to create more thunderstorms, it is not clear that these thunderstorms would spawn tornadoes. The reason is that global warming does not increase temperatures the same everywhere. Warming at the poles is expected to exceed warming at more southern latitudes. This means that cold polar air will be much less colder than before and warm Gulf of Mexico air will only be slightly warmer. When these two air masses meet above the southern US, the temperature difference between them will not be so great and their drive to swap places will be much less intense. The result will be a significantly slower moving updraft of warm air that is not expected to produce as many extreme thunderstorms or spawn as many tornadoes.

So, global warming is not expected to increase the total frequency of tornado activity. However, warming global temperatures will mean an earlier spring and the potential for earlier tornadoes. In fact, the early tornado numbers we’ve seen so far this year may be a sign of a global warming-induced shift in the tornado season, according to Dr. Masters. If this is the case, the tornado season may start earlier, but it will also end earlier. As meteorologist Harold Brooks from the National Severe Storms Laboratory in Norman, Oklahoma, points out, this record start to the 2012 tornado season does not necessarily mean the rest of the season will be severe.

Sources:
Recap of deadly U.S. tornado outbreak February 28-March 3, 2012, M. Daniel, EarthSky Mar 5, 2012.
NASA Earth Observatory, March 5, 2012.
Temporal distribution of weather catastrophes in the USA, S.A. Changnon, Climatic Change 106 (2), 129-140, 2011, doi: 10.1007/s10584-010-9927-1.
Does Global Warming Influence Tornado Activity? Diffenbaugh et al., EOS 89 (53), 553-554, 2008.

A ‘Melted’ Moon Makes for Bad Future Landing Sites

Very rough melts show up as red in the mini-RF data (left), but still appear smooth in the corresponding LRO wide angle camera image (right). These impact melts are located just outside Tycho crater, whose rim is visible at the top left. Image Credit Left: Carter et al. Image Credit Right: NASA/GSFC/ASU

[/caption]

The miniature radio frequency (min-RF) radar instrument aboard the Lunar Reconnaissance Orbiter (LRO) is revealing some interesting things about how impact melts form around craters on the Moon. Impacts produce a crater, ejecta (pulverized rock that is thrown around the crater), and melt. A lot is known about craters and ejecta, because they form such spectacular features on the planetary surfaces. But melt is a fairly minor component of the impact process, and so is not as easily observed. Relatively little is therefore known about impact melts. Now, new data from the mini-RF radar instrument is helping to fill this knowledge gap and also offering insight into future landing spots on the Moon.

Radar is an active remote sensing system, meaning it transmits a signal and then records what bounces back, providing information about the surfaces that were encountered. If the transmitted signal hits a smooth surface, then the returned signal will have a polarization direction that is opposite to what was transmitted. But, if the surface is rough, the signal may bounce more than once, switching polarization each time, so the returned polarization will be the same as the transmitted signals. By controlling the polarization of the transmitted signal and monitoring the polarization of the returned signals, researchers can calculate the ratio of same-sense to opposite sense circular polarization, a parameter called CPR. Smooth surfaces will have a low CPR, while rough surfaces will have a high CPR.

Tycho Melt close up view with LROC data
Pressure ridges can be seen in the rough part of this melt, where the underlying fluid pushed the chilled crust and bunched it up like a table cloth. But even the smooth parts of this melt contain numerous bits of rock, which can't be seen at the scale of this LRO narrow angle camera image.
Image credit: NASA/GSFC/Arizona State University.
Click on the image to explore the LROC data from this area in greater detail.

The mini-RF transmits in the radar S band, at wavelengths of 12.6 cm, and so tells us about surface roughness at the 12.6 cm scale. For example, a sandy beach covered with sand grains that are about 1-2 mm in size (much smaller than the transmitted wavelength) will appear smooth to the Mini-RF (have low CPR values). But, a beach covered with hand-sized pebbles (about the size of the transmitted wavelength) will appear rough (have high CPR values). It is important to note that this kind of information is not currently available from our existing image data, which even at its best can only resolve things on the 50 cm scale. Furthermore, the mini-RF radar can penetrate up to 1 m below the surface, providing information about buried surfaces as well.

Working with the mini-RF data, Dr. Lynn Carter and a team of researchers from NASA Goddard Space Flight Centre, Johns Hopkins University, and the Lunar and Planetary Institute have taken a look at impact melts around a variety of craters. They found that impact melt ponds and flows tend to have CPR values that are greater than surrounding non-melt regions. This means that mini-RF data can be used to help find and identify melt materials, including buried ones! From their limited survey, Dr. Carter and her team have found that impact melt ponds and flows are more common on the Moon than was previously known. With more work, they will be able to better catalogue the number and size of melt ponds and flows around lunar craters, improving our understanding of how much melt is produced by impacts and how it travels.

Dr. Carter and her team also found that, within individual melt ponds or flows, roughness values can vary. Rough surfaces may represent bunching up of a partially cooled crust as it is pushed by the still fluid melt underneath. Such pressure ridges are seen in terrestrial lava flows. Smooth surfaces may represent melts that cooled quickly, or the last melts to arrive at a pond (and so not subject to pushing from more inflowing melt). But, even the “smooth” melts, which appear quite flat in visual imagery, tend to have very high CPR values, indicating that they are, in fact, very rough. There is probably a lot of solid rock and ejecta debris (something we can’t see in the currently available imagery) entrained in the melt material to make them so rough at this scale. To understand what this kind of surface might look like, we can consider terrestrial a’a flows (which are actually slightly less rough than lunar melts).

This work has important implications for future lunar exploration. Imagine how difficult landing on a surface as rugged at an a’a flow would be. This is why site selection scientists work very hard at identifying smooth areas for spacecraft to land. However, if surfaces that look extremely smooth in visual imagery are actually rough like an a’a flow, this can present a problem. Mini-RF data could be helpful in identifying such rough regions and eliminating them from consideration.

Even "smooth" impact melt flows are rougher than this a'a flow, produced by the Kamoamoa fissure eruption in Hawaii. Image Credit: U.S. Department of Interior, U.S. Geological Survey.

Source: Initial observations of lunar impact melts and ejecta flows with the Mini-RF radar, Carter et al., Journal of Geophysical Research V117, 2012, doi:10.1029/2011JE003911.

If the Moon Currently has Liquid Magma, Why isn’t it Erupting?

A new look at old data has given scientists more insight into the Moon's core. Credit: Science

[/caption]

Last year, scientists took another look at the seismic data collected by Apollo era experiments and discovered that the lower mantle of the Moon, the part near the core-mantle boundary, is partially molten (e.g., Apollo Data Retooled to Provide Precise Readings on Moon’s Core, Universe Today, Jan. 6, 2011). Their findings suggest that the lowest 150 km of the mantle contains anywhere from 5 to 30% liquid melt. On the Earth, this would be enough melt for it to separate from the solid, rise up, and erupt at the surface. We know that the Moon had volcanism in the past. So, why is this lunar melt not erupting at the surface today? New experimental studies on simulated lunar samples may provide the answers.

It is suspected that the current lunar magmas are too dense, in comparison to their surrounding rocks, to rise to the surface.  Just like oil on water, less dense magmas are buoyant and will percolate up above the solid rock. But, if the magma is too dense, it will stay where it is, or even sink.

Motivated by this possibility, an international team of scientists, led by Mirjam van Kan Parker from the VU University Amsterdam, has been studying the character of lunar magmas. Their findings, which were recently published in the Journal Nature Geoscience, show that lunar magmas have a range of densities that are dependent on their composition.

Ms van Kan Parker and her team squeezed and heated molten samples of magma and then used X-ray absorption techniques to determine the material’s density at a range of pressures and temperatures. Their studies used simulated lunar materials, since lunar samples are considered too valuable for such destructive analysis. Their simulants modelled the composition of Apollo 15 green volcanic glasses (which have a titanium content of 0.23 weight %) and Apollo 14 black volcanic glasses (which have a titanium content of 16.4 weight %).

Samples of these simulants were subjected to pressures up to 1.7 GPa (atmospheric pressure, at the surface of the Earth, is 101 kPa, or 20,000 times less than what was achieved in these experiments). However, pressures in the lunar interior are even greater, exceeding 4.5 GPa. So, computer calculations were conducted to extrapolate from the experimental results.

Apollo 15 green glass beads
Apollo 15 green glass beads. Credit: NASA

The combined work shows that, at the temperatures and pressures typically found in the lower lunar mantle, magmas with low titanium contents (Apollo 15 green glasses) have densities that are less than the surrounding solid material. This means they are buoyant, should rise to the surface, and erupt. On the other hand, magmas with high titanium contents (Apollo 14 black glasses) were found to have densities that are about equal to or greater than their surrounding solid material. These would not be expected to rise and erupt.

Since the Moon has no active volcanic activity, the melt currently located at the bottom of the lunar mantle must have a high density. And, Ms van Kan Parker’s results suggest that this melt should be made of high titanium magmas, like those that formed the Apollo 14 black glasses.

A new look at old data has given scientists more insight into the Moon's core. Credit: Science

This finding is significant, because high titanium magmas are thought to have formed from titanium-rich source rocks. These rocks represent the dregs that were left at the base of the lunar crust, after all the buoyant plagioclase minerals (which make up the crust) had been squeezed upwards in a global magma ocean. Being dense, these titanium-rich rocks would have quickly sunk to the core-mantle boundary in an overturn event. Such an overturn even had been postulated over 15 years ago. Now, these exciting new results provide experimental support for this model.

These dense, titanium-rich rocks are also expected to have a lot of radioactive elements, which tend to get left behind when other elements are preferentially taken up by mineral crystals. The resulting radiogenic heat from the decay of these elements could explain why parts of the lower lunar mantle are still hot enough to be molten. Ms van Kan Parker and her team further speculate that this radiogenic heat could also be helping to keep the lunar core partially melted even today!

Sources:
X-Rays Illuminate the Interior of the Moon, Science Daily, Feb. 19, 2012.
Neutral buoyancy of titanium-rich melts in the deep lunar interior, van Kan Parker et al. Nature Geoscience, Feb. 19, 2012, doi:10.1038/NGEO1402.

Lunar Crater Reveals Many Secrets, Including a Not-So-Young Age

Giordano Bruno crater on the Moon
Giordano Bruno crater on the eastern far side limb of the Moon (35.9? N, 102.8? E) is being revealed in great detail by the Lunar Reconnaissance Orbiter Camera.

[/caption]

The Moon is covered with craters of various shapes and sizes, and in various states of preservation. Scientists have studied these spectacular features for over five decades, yet there are still many things about craters that we just don’t understand. The study of craters is important because we use them to determine the ages of planetary surfaces. Now, very high resolution imagery from the Lunar Reconnaissance Orbiter Camera (LROC) is allowing us to see lunar craters as never before. Under such scrutiny, one very fresh crater is revealing a host of secrets about the crater-forming process and revealing that it’s not as young as some people may have originally thought.

The crater in question is Giordano Bruno, a 22 km diameter crater located on the far side of the Moon, just beyond the eastern limb. Like all craters on the Moon, this one was named after a famous scientist, in this case, a sixteenth century Italian philosopher who was burned at the stake in 1600 for proposing the existence of “countless Earths.” Because of its position on the far side, Giordano Bruno crater was not seen by humans until it was photographed by the Soviet Luna-3 mission in 1959. But then, this crater was immediately recognized as one of significance, because of its very bright and extensive ray system.

Moon Eastern Limb Clementine
The spectacular rays and the brightness of Giordano Bruno crater are evident in this Clementine data mosaic of the eastern limb of the Moon. Giordano Bruno is the bright spot in the upper centre of this image and some of its rays can be seen extending a quarter of the way around the lunar globe.
Image credit: NASA/JPL/USGS

Along with its bright rays, the crisp rim of the crater, it’s very steep slopes, and a lack of observed superposed craters all argued for a very young age for this intriguing crater. Some researchers even suggested that the formation of this crater was observed by medieval monks in 1178, and recorded as a lunar transient event. Other workers think the age should be closer to 1 million years old. This is still very young by the standards of similar-sized lunar craters, but not within written history.

Over the past 2 years, the acquisition of LROC data has allowed Giordano Bruno crater to be studied in much greater detail than ever before. Images taken by the LROC Narrow Angle Cameras (NAC’s) have resolutions of about half a meter per pixel. This means that something the size of a chair would take up one pixel, and your kitchen table would be roughly resolvable as a 2 x 3 pixel rectangle. With resolutions like that, interesting and unexpected features are being revealed.

One of the most spectacular features is a swirl of impact melt on the western edge of the crater floor. This whirlpool-like structure shows that the melt here underwent chaotic mixing while it was liquid. You can also see that parts of the melt are actually mixtures of real melt and rock fragments that have been incorporated during movement of the melt.

Melt Swirl in Giordano Bruno crater, Moon
Like cream in coffee, a swirl captures the incomplete mixing that occurred when a viscous combination of impact melt and rock fragments flowed off the crater walls into some less rocky impact melt, which had pooled at the western edge of the crater.
Image credit: NASA/GSFC/Arizona State University

Recently published work by Dr. Yuriy Shkuratov (from the Astronomical Institute of Kharkov in Ukraine) and his colleagues used a new technique to study this swirl. Multiple images taken under different conditions were combined to provide roughness calculations for the area. Their research shows that there is a depression in the centre of this structure and that higher segments of the whirlpool swirl exhibit greater roughness than the surrounding melt. They interpret this to mean that the cooling impact melt pool was disturbed by melt flows coming off the crater walls. These incoming flows were more viscous because they had incorporated rock fragments and so did not mix as readily with the other melt material.

One of the other features studied by Dr. Shkuratov and his team is a large slump of wall material near the northern rim of Giordano Bruno. Such slumps are common in larger craters and are believed to form during the late stages of crater formation. This means that the slump block should be the same age as the crater. However, Dr. Shkuratov and colleagues have found that, while there are no craters on the slumped material, a number of small craters are located on the inner wall near this large landslide. They interpret this to mean that the slump is a more recent event. This is significant, because up until now, such big changes were not thought to occur so long after crater formation.

Slump Block in Giordano Bruno crater, Moon
A segment of the crater wall detaches and slumps downward. But when?
Image credit: NASA/GSFC/Arizona State University

The most intriguing result of Dr. Shkuratov’s study is the indication of a not-so-young age for Giordano Bruno. A number of very bright landslides, much smaller than the one on the north wall, are observed around the crater. Similarly, small bright craters are found superposed on many parts of the crater walls. These landslides and craters are much brighter than the surrounding materials. On the Moon, brighter means younger, since materials tend to darken as they age, due to a process called “space weathering.” If these craters and landslides are indeed young, this means that the surrounding darker material of Giordano Bruno crater must be older. Data from Japan’s Kaguya mission confirms that these variations in brightness are not related to compositional variations, and so must be age-related. Based on this and other evidence, Dr. Shkuratov’s team conclude that Giordano Bruno crater must be at least one million years old.

So, whatever the medieval monks saw when they recorded the occurrence of a lunar transient event in 1178, it was not the impact that formed Giordano Bruno crater.

Discover the secrets of Giordano Bruno crater for yourself, using LROC data at the ACT-REACT Quick Map web site

Source: The lunar crater Giordano Bruno as seen with optical roughness imagery. Shkuratov et al., Icarus 218, 2012, 525-533, doi:10.1016/j.icarus/2011.12.023.

New Insights into the Moon’s Mysterious Magnetic Field

Lunar Dynamo
Moon with cut-away showing stylized interior with dynamo and magnetic field lines.

Ever since the Apollo era, scientist have known that the Moon had some kind of magnetic field in the past, but doesn’t have one now. Understanding why is important, because it can tell us how magnetic fields are generated, how long they last, and how they shut down. New studies of Apollo lunar samples answer some of these questions, but they also create many more questions to be answered.

The lunar samples returned by the Apollo missions show evidence of magnetization. Rocks are magnetized when they are heated and then cooled in a magnetic field. As they cool below the Curie temperature (about 800 degrees C, depending on the material), the metallic particles in the rock line up along ambient magnetic fields and freeze in that position, producing a remnant magnetization.

This magnetization can also be measured from space. Studies from orbiting satellites show that the Moon’s magnetization extends well beyond the regions sampled by Apollo astronauts. All this magnetization means that the Moon must have had a magnetic field at some point in its early history.

Most of the magnetic fields we know of in the Solar System are generated by a dynamo. Basically, this involves convection in a metallic liquid core, which effectively moves the metal atoms’ electrons, creating an electric current. This current then induces a magnetic field. The convection itself is thought to be driven by cooling. As the outer core cools, the colder portions sink to the interior and let the warmer interior sections move outwards towards the exterior.

Because the Moon is so small, a magnetic dynamo that is driven by convective cooling is expected to have shut down some time around 4.2 billion years ago. So, evidence of magnetization after this time would need either 1) an energy source other than cooling to drive the motion of a liquid core, or 2) a completely different mechanism for creating magnetic fields.

Laboratory experiments have suggested one such alternate method. Large basin-forming impacts could produce short-lived magnetic fields on the Moon, which would be recorded in the hot materials ejected during the impact event. In fact, some observations of magnetization are located at the opposite side of the Moon (the antipode) from large basins.

So, how can you tell if magnetization in a rock was formed by a core dynamo or an impact event? Well, impact-induced magnetic fields last only about 1 day. If a rock cooled very slowly, it would not record such a short-lived magnetic field, so any magnetism it retains must have been produced by a dynamo. Also, rocks that have been involved in impacts show evidence of shock in their minerals.

One lunar sample, number 76535, which shows evidence of slow cooling and no shock effects, has a distinct remnant magnetization. This, along with the age of the sample, suggests that the Moon had a liquid core and a dynamo-generated magnetic field 4.2 billion years ago. Such a core dynamo is consistent with convective cooling. But, what if there are younger samples?

New studies recently published in Science by Erin Shea and her colleagues suggest this may be the case. Ms Shea, a graduate student at MIT, and her team studied sample 10020, a 3.7 billion year old mare basalt brought back by the Apollo 11 astronauts. They demonstrated that sample 10020 shows no evidence of shock in its minerals. They estimated that the sample took more than 12 days to cool, which is much slower than the lifetime of an impact-induced magnetic field. And they found that the sample is very strongly magnetized.

From their studies, Ms Shea and her colleagues conclude that the Moon had a strong magnetic dynamo, and therefore a moving metallic core, around 3.7 billion years ago. This is well after the time a convective cooling dynamo would have shut down. It is not clear, however, if the dynamo was continually active since 4.2 billion years ago, or if the mechanism that moved the liquid core was the same at 4.2 and 3.8 billion years. So, what other ways are there to keep a liquid core moving?

Recent studies by a team of French and Belgian scientists, led by Dr. Le Bars, suggest that large impacts can unlock the Moon from its synchronous rotation with the Earth. This would create tides in the liquid core, much like the Earth’s oceans. These core tides would cause significant distortions at the core-mantle boundary, which could drive large-scale flows in the core, creating a dynamo.

In another recent study, Dr. Dwyer and colleagues suggested that precession of the lunar spin axis could stir the liquid core. The early Moon’s proximity to the Earth would have made the Moon’s spin axis wobble. This precession would cause different motions in the liquid core and overlying solid mantle, producing a long-lasting (longer than 1 billion years) mechanical stirring of the core. Dr. Dwyer and his team estimate that such a dynamo would naturally shut down about 2.7 billion years ago as the Moon moved away from the Earth over time, diminishing its gravitational influence.

Unfortunately, the magnetic field suggested by the study of sample 10020 doesn’t fit either of these possibilities. Both these models would provide magnetic fields that are too weak to have produced the strong magnetization observed in sample 10020. Another method for mobilizing the liquid core of the Moon will need to be found in order to explain these new findings.

Sources:
A Long-Lived Lunar Core Dynamo. Shea, et al. Science 27, January 2012, 453-456. doi:10.1126/science.1215359.

A long-lived lunar dynamo driven by continuous mechanical stirring. Le Bars et al. Nature 479, November 2011, 212-214. doi:10.1038/nature10564.

An impact-driven dynamo for the early Moon. Dwyer et al. Nature 479, November 2011, 215-218. doi:10.1038/nature10565.

Large Amounts of Water Ice Found Underground on Mars

Global map of Water ice on Mars
New estimates of water ice on Mars suggest there may be large reservoirs of underground ice at non-polar latitudes. The map here shows "water-equivalent hydrogen". Oranges and reds on the map (values greater than 4.5 weight % water-equivalent hydrogen at the surface) point out areas where the amount of deeply buried water ice is greater than what can fit in the pore spaces of the surface rocks. Image credit: Feldman et al., 2011

[/caption]

Many models predict that water ice shouldn’t be stable on Mars today, anywhere beyond the poles, no matter how deep you bury it. And yet, a recently published study shows that large regions outside the polar areas may, in fact, contain a relative abundance of water. This is exciting, not only because water has implications for the possibility of life on Mars, but also because it can provide a valuable resource to future explorers, both as a fuel and for life support. And if this water is near the equator, that makes it much easier to get to.

Over the past 7 years, lots of spacecraft observations have given us evidence for the presence of water on Mars, either at the surface or not far below. Radar data have shown that large amounts of water ice are stored at the poles (Lots of Pure Water Ice at Mars North Pole). And pictures of gullies have hinted at reserves of water beneath the surface (NASA Says Liquid Water Made Martian Gullies). Now, a team of scientists, led by Dr. William Feldman of the Planetary Science Institute in Tucson, Arizona, have taken a new look at some of that data.

Dr. Feldman and his team used data from the Mars Odyssey Neutron Spectrometer (MONS) to estimate the amount of water ice that is present outside of the polar regions of Mars, where water ice is not expected to be found. The MONS is an instrument that counts Martian neutrons from orbit. These “neutron counts” are sensitive to the presence of hydrogen and how deep it is below the surface. Using models that take the characteristics of the Martian surface and the relationship of hydrogen to water into account, the MONS data can be used to predict the amount and depth of water and water ice in the surface. Doing just that, Dr. Feldman’s team produced a nearly global map of potential underground ice deposits.

Global map of Water ice on Mars
New estimates of water ice on Mars suggest there may be large reservoirs of underground ice at non-polar latitudes. The map here shows "water-equivalent hydrogen". Oranges and reds on the map (values greater than 4.5 weight % water-equivalent hydrogen at the surface) point out areas where the amount of deeply buried water ice is greater than what can fit in the pore spaces of the surface rocks.
Image credit: Feldman et al., 2011.

This map shows the “weight percent of water-equivalent hydrogen”, or how much of the rock’s weight comes from hydrogen that is bound up in water molecules. Since hydrogen atoms are much lighter than the other atoms that make up a rock, a small weight percent of hydrogen equals a much larger volume of water ice. In fact, Dr. Feldman’s team estimate that values of 4.5 weight % hydrogen or greater (oranges and reds on the map), mean the volume of water ice at depth is larger than what can fit into pore spaces (the spaces between the grains that make up a rock). This means that you no longer have ice in a rock; now you have rocks in ice!

Four regions containing such bulk ice stand out in the map: Promethei Terra in the lower right of the map, Arabia Terra in the upper centre, Arcadia Planitia in the upper left, and Elysium Planetia spanning from the centre right, across the Martian “date line” (180 degrees longitude), to the centre left of the map. The ice deposits here are “buried less than about 1 m below the surface,” writes Dr. Feldman. He does admit that their findings may also indicate the presence of large quantities of minerals that contain water molecules in their chemical make-up. However, their results are supported by other evidence. In the Elysium Planetia region, evidence of glacial features has been seen in high resolution stereo data from ESA’s Mars Express orbiter ( Mars Express Reveals Possible Martian Glaciers). And in the Arcadia Planitia region, buried water ice has been identified in CRISM data, where an almost pure ice layer was excavated from less than 1 meter below the surface by four recent impact events.

Ice ejecta around Martian crater
Almost pure water ice is seen in the ejecta surrounding this impact crater (8 meters in diameter), which formed in 2008. The only reason we can see ice at the surface here is because this crater is so young. As time passes, the ice will all sublimate away.
Image Credit: High Resolution Imaging Science Experiment camera, NASA/JPL-Caltech/University of Arizona.

So, if ice is unstable at today’s conditions on Mars, how can Dr. Feldman and his team account for the presence of that much ice so close to the surface? Well, the bulk ice could have been deposited some 10-20 million years ago, at a time when ice was stable at the surface. If that happened, then the ice sheet could have been preserved under a layer of cemented dust and sediment. This duricrust would have partially shielded the ice from contemporary surface temperatures and atmospheric conditions, slowing the sublimation of the ice just enough so that some of it was left for us to detect today.

Source Link: Feldman et al., 2011, JGR 116, E11009

A Wrinkled Moon

Wrinkle Ridge South of Plato
Wrinkle ridges, like this one in the northern part of Mare Imbrium, were studied using telescopic observations, as early as the 1880's. Data from the Apollo era refined our understanding of these interesting features. More recently, data from the Lunar Reconnaissance Orbiter Camera is calling that understanding into question. Image credit: NASA/GSFC/Arizona State University and the author Click on the image to explore the LROC data from this area in greater detail

[/caption]

Wrinkle ridges have been seen on the surface of the Moon for over a century. Studies of these interesting features began as early as 1885, with telescopic photographs, and continued beyond the Apollo era, with satellite and lander observations. Scientists thought they understood them, but the latest images from the Lunar Reconnaissance Orbital Camera (LROC) suggest we may not know the whole story.

By definition, wrinkle ridges are narrow, steep-sided ridges that form predominantly in volcanic regions. They are very complex features, which can be either straight or curved, or even be braided and zig-zagged. Their width can be anything from less than 1 km to over 20 km. And their heights range from a few meters (say the height of an average room) to 300 meters (about the height of a 100-story sky scraper). They are also asymmetric, with one side of the ridge being higher than the other. Often, these things sit on top of a gentle swell in the landscape. Features like this have been found on a number of planets throughout the Solar System, including the Moon, Mars, Mercury, and Venus.


Wrinkle Ridge South of Plato
Wrinkle ridges, like this one in the northern part of Mare Imbrium, were studied using telescopic observations, as early as the 1880's. Data from the Apollo era refined our understanding of these interesting features. More recently, data from the Lunar Reconnaissance Orbiter Camera is calling that understanding into question.

Image credit: NASA/GSFC/Arizona State University and the author
 Click on the image to explore the LROC data from this area in greater detail

The earliest researchers of lunar wrinkle ridges saw them through telescopes. When looking at the terminator (the line between the dark side and the lit side of the Moon), the angle of the Sun causes spectacular shadows to highlight the topography, allowing these otherwise subtle features to be seen. Scientists in the late 19th century believed that these wrinkle ridges, which were found predominantly in the volcanic mare regions, formed when the cooling magma shrank. The chilled crust at the very top of this magma body was now too large, and wrinkles had to form to accommodate the difference. This process was often compared to the wrinkled skin of a shriveled apple, or the skin on our hands as we age.

The dawn of the space age introduced orbiting satellites, which circled the Moon collecting images that were more detailed than had been possible ever before. Data from the 1960’s the Lunar Orbiter (LO) program, whose mission was to photograph the Moon in preparation for the Apollo missions, showed many more of these wrinkle ridge features.

Some researchers felt the LO data pointed to a volcanic origin for wrinkle ridges. They saw lava flows emanating from the wrinkle ridges and embaying impact craters. They suggested that lava flowed to the surface along linear fractures that exploited zones of weakness in the lunar crust (presumably, these weaknesses formed when impacts created the basins that lunar mare occupy). Lava that extruded onto the surface formed the wrinkle ridge features, while magma that intruded below the surface formed the regional swell the ridges sit on.

The Apollo missions, however, were able to provide information about what was happening below the surface, with the Apollo Lunar Sounder Experiment (ALSE). Data collected over a wrinkle ridge in the southeastern portion of Mare Serenitatis showed that there was some kind of topographic structure beneath the thin mare layers in this area. This suggested that wrinkle ridges were the surface expressions of thrust faults in the underlying crust. This interpretation was appealing because it explained why some wrinkle ridges are found outside of mare areas.


Bulging Wrinkle Ridge in Tsiolkovskiy Mare
Wrinkle ridges are generally steep-sided, asymmetric structures, displaying complex braiding or zig-zag patterns. This wrinkle ridge, in the northern mare of Tsiolkovskiy crater, is very different. Described as "bulging", it has a gently curved uniform shape. It is also much smaller than the wrinkle ridges seen before. This unusual wrinkle ridge suggests we may not understand the formation of these features as well as we thought.

Image credit: NASA/GSFC/Arizona State University
 Click on the image to learn more about this discovery from NASA's LROC team.

Later, studies of wrinkle-like features on Earth refined our understanding of how these features form. Now the thinking is that wrinkle ridges form by tectonic buckling of the mare areas and their surroundings. When mare lavas are extruded on the surface of the Moon, they fill up the impact basins in a series of basalt layers. The thinned crust left by the basin-forming process can’t support the weight of the mare, so the entire structure sags. The mare layer can become decoupled from the underlying regolith (the “soil” layer that impacts created between the time the basin was formed and when the first mare lavas extruded) and slide towards the sagging centre. As it does so, it bunches up in places where the decoupling is not complete. This creates a series of thrust faults at the base of the mare layer, which show up as wrinkle ridges at the surface. This decoupling process is more pronounced for thinner mare layers, which explains why we often see wrinkle ridges at the edges of a mare.

Recent findings from the Lunar Reconnaissance Orbiter Camera (LROC) may challenge this current understanding of wrinkle ridge formation. LROC images from the mare in Tsiolkovskiy crater have identified wrinkle ridges that are considerably different from the ones seen before. For one, these wrinkle ridges are not asymmetrical in profile, but have a uniformly curved shape. Also, they are much smaller, measuring less than 100 meters in width, as opposed to the 1-20 km widths seen for other wrinkle ridges.

It remains to be seen if these new wrinkle ridges will again change our understanding of how these enigmatic features form. The discovery of these particular ridges is so new that there is nothing yet published about them! Perhaps this image and others like it will help us learn more about these enigmatic features and answer questions such as: does this new wrinkle ridge represent the beginnings of their formation process and that all such ridges started out so small and symmetrical? Or maybe we’ll find that they are extrusions of particularly viscous lava, which have barely protruded above the surface along a linear fault.

Scientists plan to target this area for further data acquisition, because only more data from LRO and further research will help solve the mysteries of the wrinkled Moon.

New Research Casts Doubt on the Late Heavy Bombardment

Map of the Serenitatis basin area of the Moon
Click on the image to download the full map and explore it in more detail.

[/caption]

Was the early solar system bombarded with lots of big impacts? This is a question that has puzzled scientists for over 35 years. And it’s not just an academic one. We know from rocks on Earth that life began to evolve very early on, at least 3.8 billion years ago. If the Earth was being pummeled by large impacts at this time, this would certainly have affected the evolution of life. So, did the solar system go through what is known as the Late Heavy Bombardment (LHB)? Exciting new research, using data from the Lunar Reconnaissance Orbiter Camera (LROC) may cast some doubt on the popular LHB theory.

It’s actually quite a heated debate, one that has polarized the science community for quite some time. In one camp are those that believe the solar system experienced a cataclysm of large impacts about 3.8 billion years ago. In the other camp are those that think such impacts were spread more evenly over the time of the early solar system from approximately 4.3 to 3.8 billion years ago.

The controversy revolves around two large impact basins, which are found fairly close to each other on the Moon. The Imbrium basin is one of the youngest basins on the near side of the Moon, while the Serenetatis basin is thought to be one of the oldest. Both are flooded with volcanic basalts and are big enough to be seen from Earth with the naked eye.


Map of the Serenitatis basin area of the Moon

What if the Apollo 17 samples didn't come from the Serenitatis basin, where the astronauts collected them, but rather from the Imbrium basin, located some 600 km away? Studies from the new Lunar Reconnaissance Orbiter Camera suggest this may be the case. If true, this means Serenitatis is much older than the Imbrium basin and a solar system-wide impact catastrophe is not needed to explain the uncannily close ages of the Imbrium and Serenitatis basins.

Image credit: NASA
 Click on the image to download the full map and explore it in more detail.

Scientists know the relative ages of such lunar basins because of a concept called superposition. Basically, superposition states that what is on top must be younger than what is beneath. Using such relationships, scientists can determine which basins are older and which are younger.

To get an absolute age, though, scientists need actual bits of rock, so they can use radiometric dating techniques. The lunar samples returned by the Apollo program provided exactly that.  But, the Apollo samples suggest that the Imbrium and Serenitatis basins are barely 50 million years apart.

Relative age dating tells us there are over 30 other basins that formed within that time frame.  This means that roughly one major impact occurred every 1.5 million years! Now, 1.5 million years may sound like a long time. But consider the last large impact that happened on Earth, the Chicxulub event 65 million years ago, which is thought to have exterminated the dinosaurs. Imagine another 40 dinosaur-killing impacts occurring since then. It would be surprising if any life survived such a barrage!

This is why a team of researchers, led by Dr. Paul Spudis of the Lunar and Planetary Institute, is looking very carefully at this question. Their research is using the principle of superposition to show that several of the areas visited by the Apollo program were blanketed by material from the Imbrium impact. This could mean that many of the collected Apollo materials may be sampling the same event.

Dr. Spudis’s research focuses on the Montes Taurus area, between the Serenitatis and Crisium basins, not far from the Apollo 17 landing site. This is a region dominated by sculpted hills that have been interpreted to be ejected material from the adjacent Serenitatis basin impact. But, Dr. Spudis and his team have found that, instead, this sculpted material comes from the Imbrium basin some 600 kilometers away.

Previous data of this area, from the Lunar Orbiter IV camera, hadn’t shown this because a fog on the camera lens made the details difficult to see (this fog problem was eventually resolved, and Lunar Orbiter IV provided a lot of useful data on other parts of the Moon).The new LROC data, however, shows that the sculpted terrain seen at Apollo 17 is very widespread, extending far beyond the Montes Taurus region. Furthermore, the grooves and lineated features of this terrain point to the Imbrium basin, not the Serenitatis basin, and line up with similar features in the Alpes and Fra Mauro Formations, which are known to be ejecta from the Imbrium impact. In the north of Serenitatis, these Imbrium formations even seem to transform into the Montes Taurus, confirming that the sculpted hills do, in fact, originate from the Imbrium impact.

LROC Data of Serenitatis basin area on the Moon
Recent high quality data from the Lunar Reconnaissance Orbiter Camera shows that the sculpted terrain, which is present at the Apollo 17 landing site, is related to material that is known to be from the Imbruim impact. This means that Apollo 17 may have sampled Imbrium and not Serenitatis material. This could explain the unusually close ages of these two basins, suggested by the Apollo samples. If so, the Serenitatis impact may have occurred much earlier than previously thought, meaning that a barrage of frequent bombardments did not occur, and life on Earth could have evolved without being molested by too many impact events.

Image credit: NASA/GSFC/Arizona State University
 Click on the image to explore the LROC data in greater detail.

If the sculpted hills are Imbruim ejecta, then it is possible that Apollo 17 sampled Imbrium and not Serenitatis materials.  That casts suspicion on the very close radiometric ages of these two basins. Perhaps these ages are so close because we effectively measured the same material. In that case, the age of Serenitatis could be much older than the 3.87 billion years the Apollo 17 samples suggest.  If true, this would mean that there was no Late Heavy Bombardment at the time life was forming on the early Earth, leaving life to evolve with relatively few impact-related interruptions.

Source:
Spudis et al., 2011, Journal of Geophysical Research, V116, E00H03