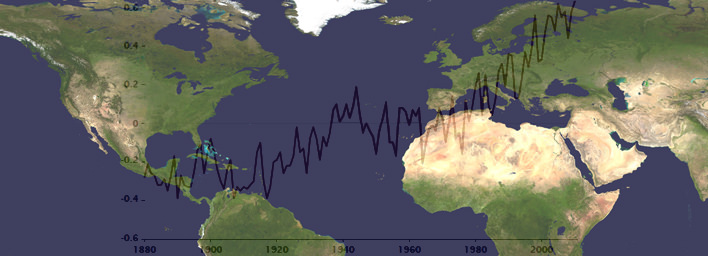
World map with global temperature changes from 1880 to 2010. Credit: NASA GISS
[/caption]
Newly released scientific data shows that 2010 equals 2005 as the Earths warmest year on record over the last 131 years, say researchers from NOAA and NASA. Temperature measurements from instrumented monitoring stations date back to 1880.
The past decade from 2001 to 2010 was the warmest on record and includes 9 of the 10 hottest years. A NOAA ranking of the 15 hottest years globally shows they all occurred in the last 15 years since 1995.
2010 was the 34th consecutive year with global temperatures above the 20th century average of 57.0 F (13.9°C), according to NOAA data. 1976 was the last year with a below average global temperature. Updated.
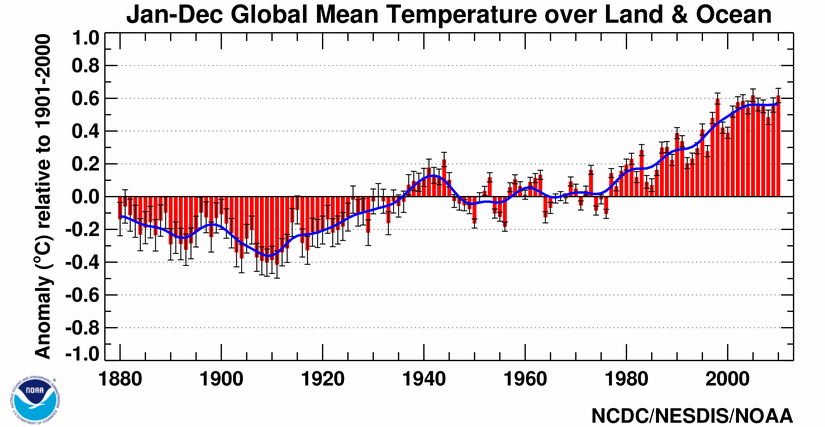
Global surface temperature anomalies for 2010. Credit: NOAA
Overall, the combined global land and ocean surface temperatures for 2010 and 2005 has risen 1.12 F (0.62 C) compared with the 20th century average, according to NOAA. The average global temperature in 2010 was 58.12 degrees compared to 57.0 F (13.9°C) as the average for all of 20th century. 2010 was also the wettest year on record.
The rise in Earths’ global temperature has been accompanied by a decline in arctic sea ice. Specifically, surface air temperatures in the arctic were warmer than normal during the summer of 2010. The sea ice extent measured in September 2010, was the 3rd lowest on record since accurate monitoring began in 1979, states NOAA in the annual Arctic report card. See Video below.
Scientists from NOAA’s National Climatic Data Center (NCDC) in Asheville, N.C. and NASA’s Goddard Institute for Space Studies (GISS) in New York City announced the findings on Jan 12. The temperature data are collected by weather stations that span across the globe.
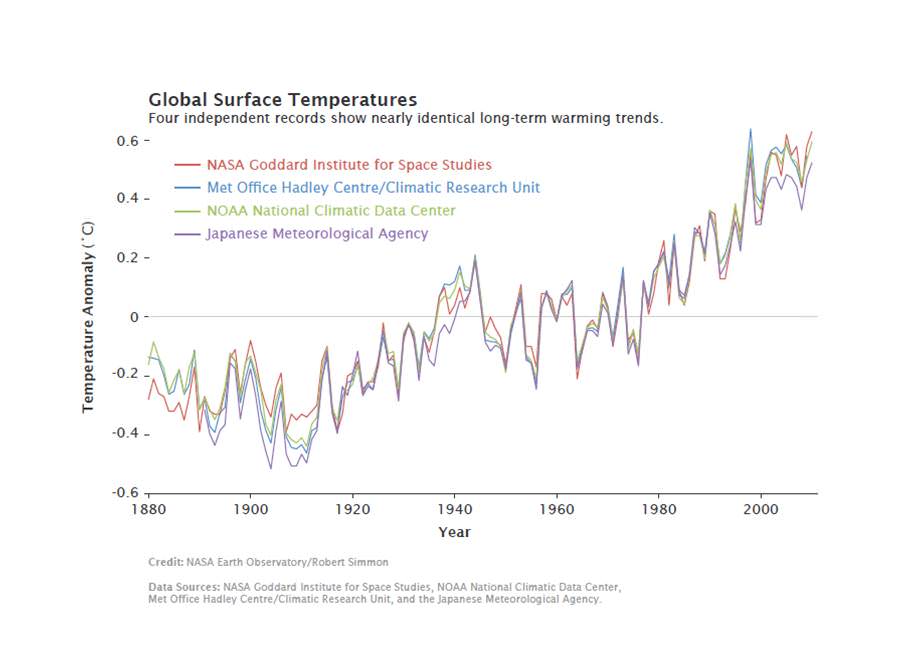
Global measurements by independent researchers in the UK at the Met Office Hadley Centre and at the Japanese Meteorological Agency closely match the trend of warming temperatures gathered by NOAA NCDC and NASA GISS.
The graphic below combines the actual temperature data collected independently by the four research agencies. The temperature trend lines are remarkably consistent.
Multiple institutions monitor global surface temperatures. Despite subtle differences in the ways the scientists perform their analyses, these four widely referenced records show remarkable agreement. Credit: NASA Earth Observatory/Robert Simmon
Much of the rise in global temperatures has taken place since the late 1970’s, says NASA. The rate of increase has been about 0.36 F per decade. The NASA GISS weather data were collected using over 1000 meteorological stations around the world, satellite observations of sea surface temperature and Antarctic research station measurements.
2010 average annual temperature ranks by state in the US. Credit: NOAA
The data are fed into a computer program which then calculates temperature anomalies — the difference between surface temperature in a given month and the average temperature for the same period during 1951 to 1980. NASA GISS uses that three-decade period as the baseline for analysis against which climate change can be tracked. NOAA uses the entire 20th century.
For the contiguous United States, NOAA analysis shows that “2010 was the 14th consecutive year with an annual temperature above the long-term average. Since 1895, the temperature across the US has increased at an average rate of approximately 0.12 F per decade.”
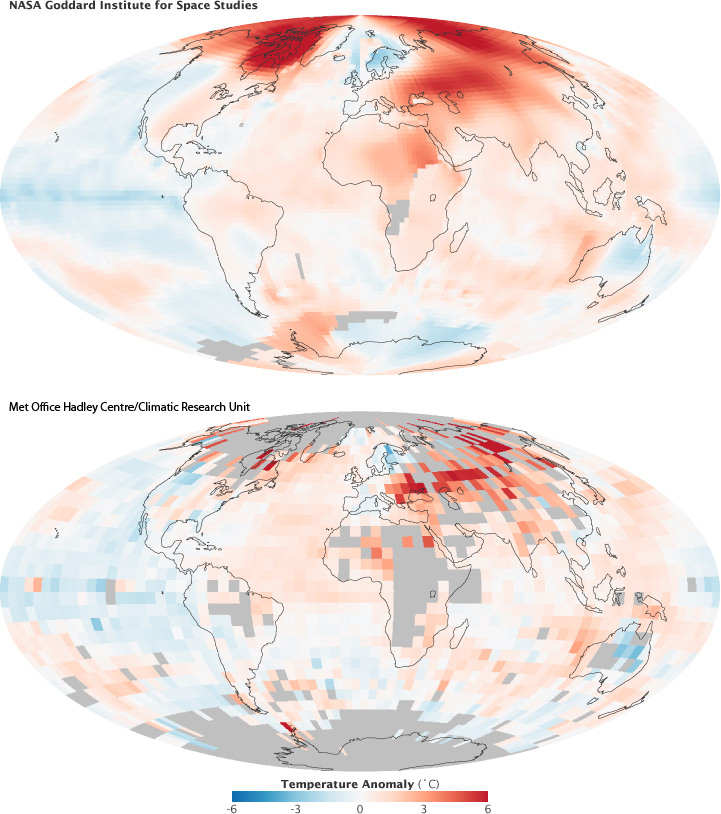
There are large areas in the Arctic without weather stations. NASA GISS approaches the problem by filling in gaps with data from the nearest land stations. The Climatic Research Unit at the University of East Anglia, which works jointly with the Met Office Hadley Centre, leaves much of the region out of its global temperature analysis. Credit: NASA Earth Observatory/Robert Simmon2010 Global Significant Weather and Climate Events. Credit: NOAA Global Temperatures.
The year 2010 tied with 2005 as the warmest year since records began in 1880. The annual global combined land and ocean surface temperature was 0.62°C (1.12°F) above the 20th century average. The range associated with this value is plus or minus 0.07°C (0.13°F). The 2010 combined land and ocean surface temperature in the Northern Hemisphere was also the warmest on record, while the combined land and ocean surface temperature in the Southern Hemisphere was the sixth warmest such period on record. Credit: NOAA
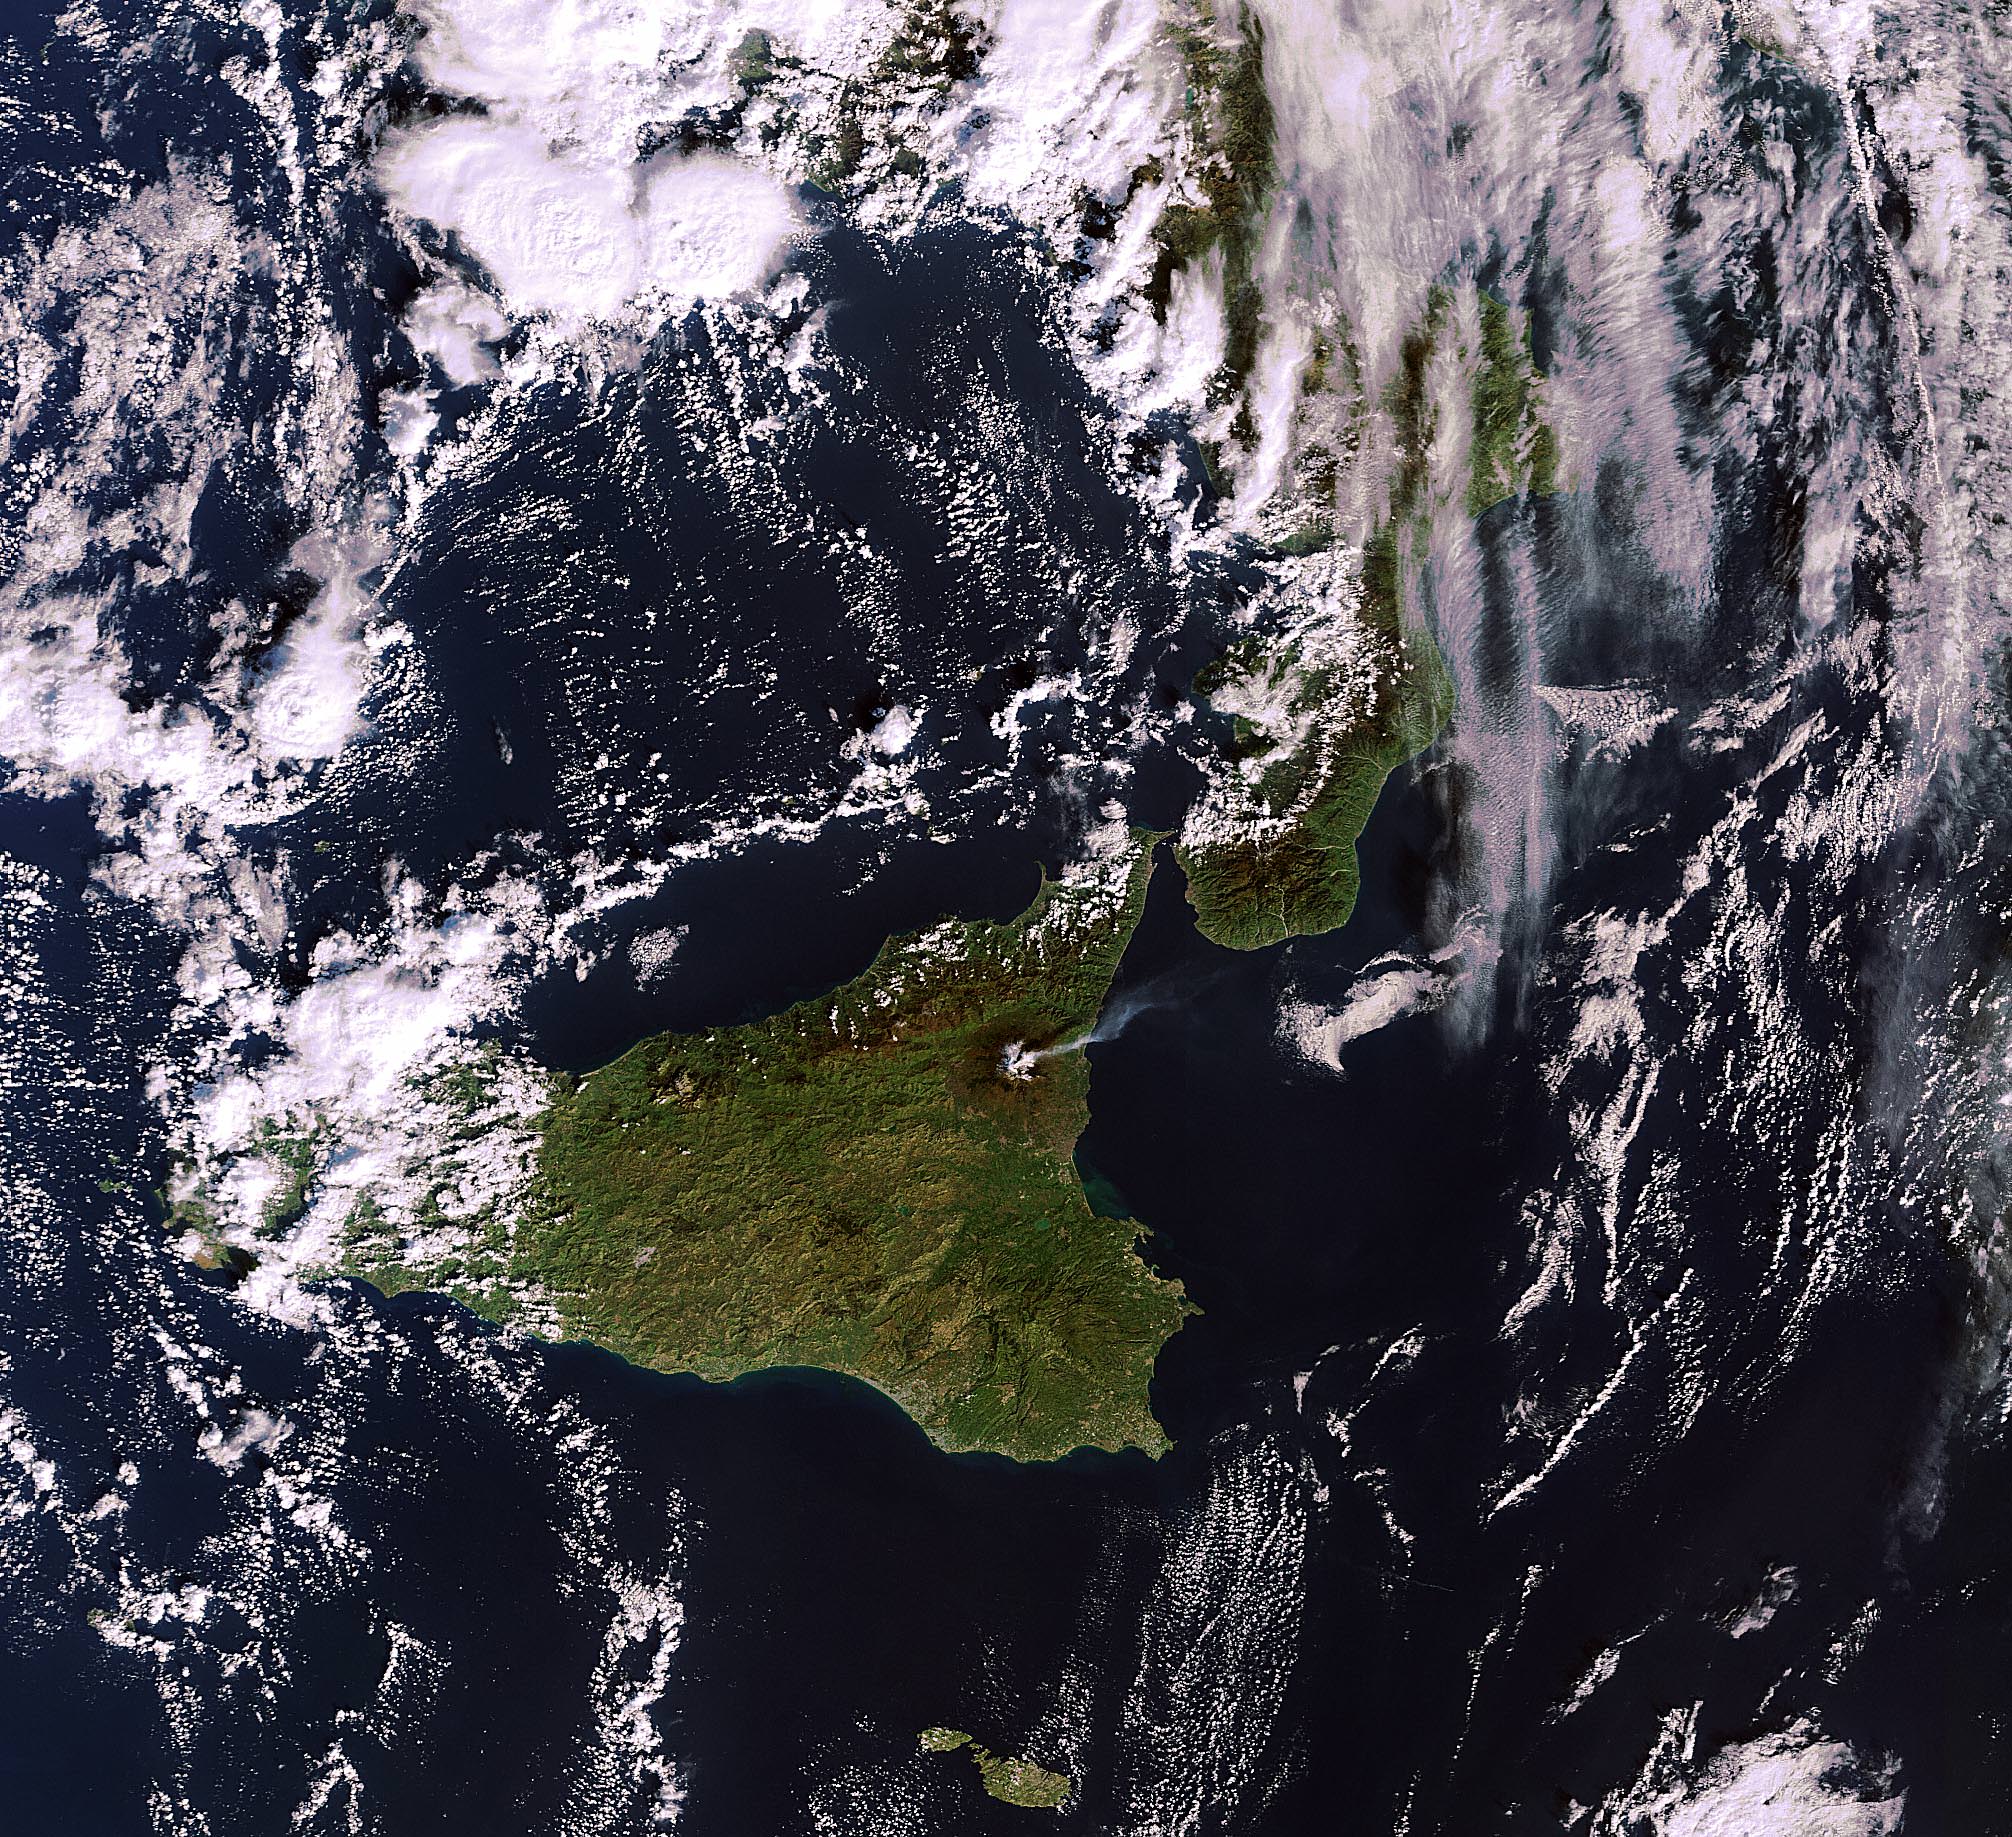
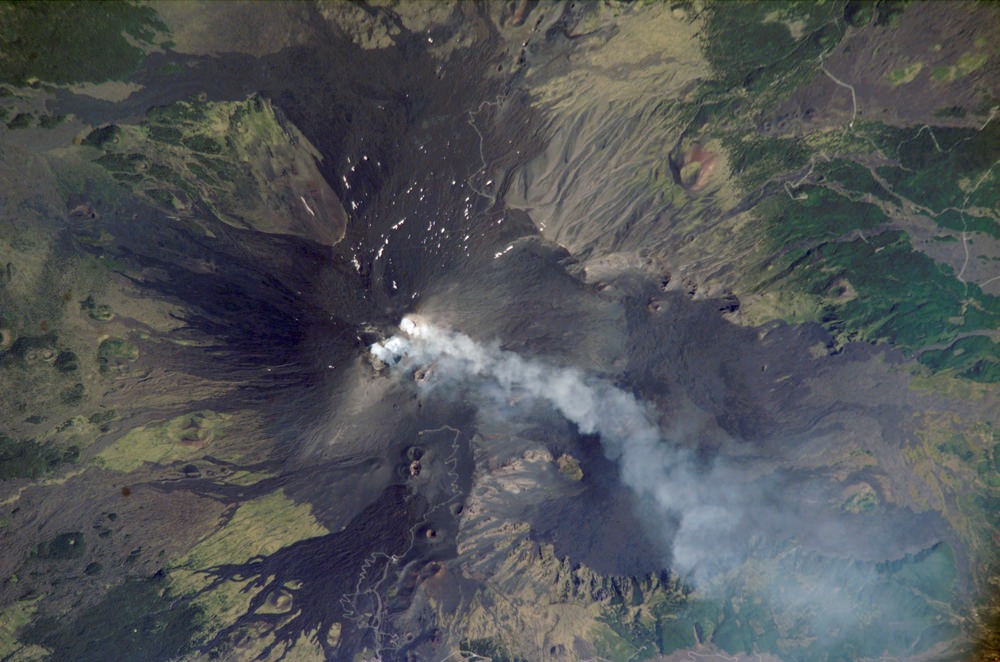
Volcanic eruptions at Mt. Etna from orbiting NASA Terra Satellite. Acquired on January 11, 2011. NASA Earth Observatory Image of the Day on January 15, 2011. Credit: NASA Terra Satellite
[/caption]
Spectacular eruptions from Mt Etna are spewing massive quantities of lava, smoke and ash many hundreds of meters high into the skies above the island of Sicily. Mt Etna is the most active volcano in Europe and one of the most active on all of Earth. The volcano rumbled to life again this week on the evening of January 12, 2011 and lit up the night sky. Mt Etna is 3350 meters high and located on the northeast coast of Sicily near the boot of Italy (see above, below).
Updated: comment or send me your Etna erupting photos/accounts to post below.
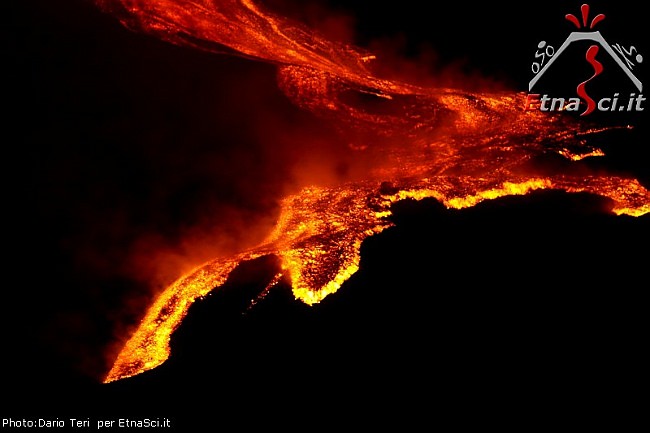
This fearsome natural wonder is providing an awe inspiring show from both Earth and Space. Local residents and lucky tourists nearby took stunning videos and photos (below) showing fountains of brilliant lava eruptions streaming mightily from the volcano.
This Envisat MERIS image, acquired on 11 January 2011, shows the plume of smoke billowing into the atmosphere from Mount Etna, Sicily, Italy. Activity gradually increased the following day, peaking in the evening. Credits: ESA
Click to Enlarge all images
Amazing photos from space were captured by Earth orbiting satellites from NASA and ESA. NASA’s Terra satellite took the above image on Jan. 11 as Mt Etna was spewing forth smoke or ash just prior to the volcanic eruptions on Jan. 12. The photo of Etna is NASA’s Earth Observatory Image of the Day, today, Jan. 15, 2011.
ESA’s Envisat likewise snapped a gorgeous view of the billowing plume of smoke rising to space (photo at left) and the international crew aboard the ISS, which currently includes Italian astronaut Paolo Nespoli. Perhaps he’ll send us a shot !
Local news and eyewitness accounts say that tremors from the volcano began increasing on Jan. 11. Emissions of volcanic gases and water vapor have been ongoing since late September 2010. The sounds of explosive tremors from deep inside were also detected months ago.
This sizzling hot video – “Etna at Maximum Activity” – is set to music and records the magnificent flowing streams of lava and the thunderous sounds of the crackling, explosive eruptions. Be sure to view at full screen, then just sit back and enjoy !
Plumes of volcanic ash from the eruptions spread across Sicily and forced the closure of the local Fontanarossa airport – nearby to the city of Catania, which is 24 kilometers away.
Rumblings of Mt Etna have been recorded in historical documents dating back to about 1500 BC.
Another short, dramatic video with the raw sounds of the eruption from a group of German tourists visiting the beautiful city of Taormina, Sicily
Eyewitness Description:
“Mount Etna erupted in the evening of January 12, 2011 for around four hours, providing an amazing scenery. We shot this unique video from Taormina on January 12, 2011 at 11.45 p.m. and uploaded it on YouTube.
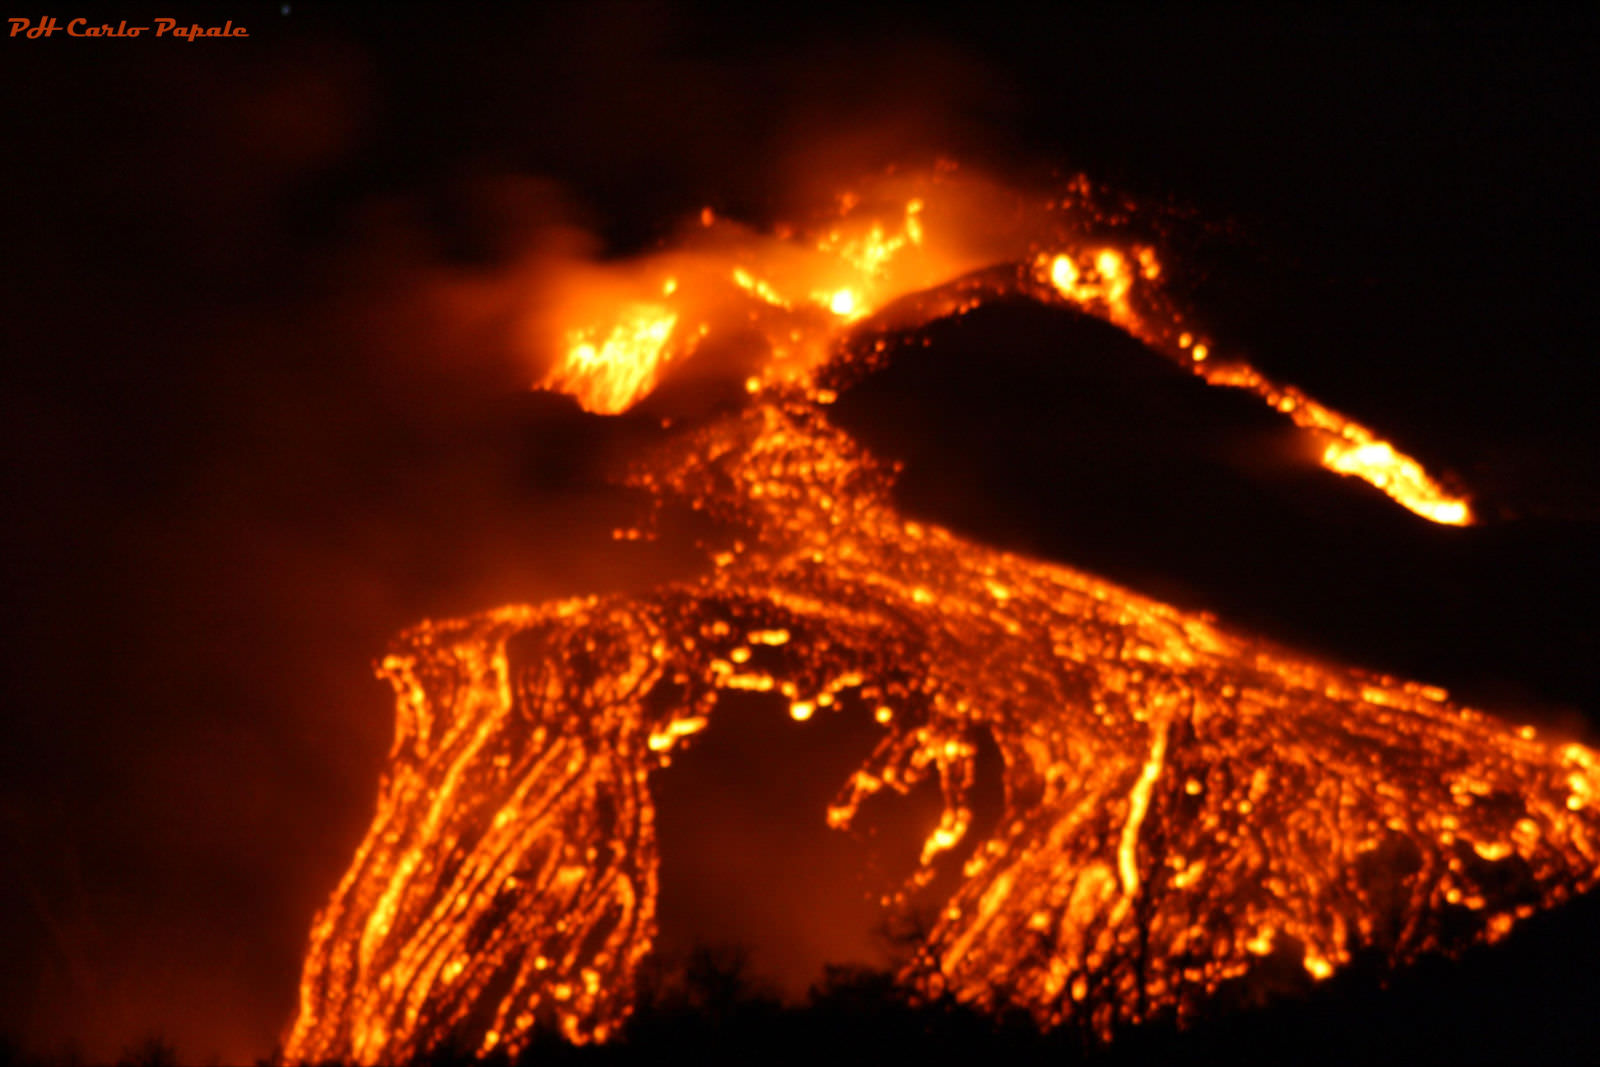
On the evening of 11th January 2011 an increase in volcanic tremor was recorded at the summit of the volcano. The recorded seismic activity reached a peak at 7 a.m. on 12th January when the source moved from north of NE crater to the SE crater. The eruption started with strombolian explosive activity at SE crater at around 9.p.m. Lava overflowed the eastern rim of SE crater and fed a flow that moved toward the western wall of the Valle del Bove (Valley of the oxen), an ancient huge uninhabited depression on the NE side of the volcano.
The Sicilian communities near the volcano were not threatened by this latest fascinating eruption. Best place to watch the fascinating eruptions of Mount Etna is the town of Taormina, nestled on a hill at 220 meters / 722 feet above the sea level and at a safe linear distance of approx. 28 Km / 17,4 miles from the top craters of the Sicilian volcano.” Fearsome lava eruptions spewing from Mt Etna on Jan. 11, 2011
A few years back, I visited Mt Etna and was incredibly lucky to witness this spectacle of nature myself. It was an unforgettable experience to see the glowing red-orange colored lava flowing out from the bowels of the Earth. It was like a living being with circulating blood.
In the excitement, I did something that in retrospect was incredibly stupid. I stood on a ledge, perhaps 50 cm thick, right above the porthole of the scalding hot lava erupting from the earth beneath my feet. Many others did too.
Sicily is a lovely place of manmade and natural wonders. Don’t pass up an opportunity to see Etna aflame
Look at Etnaweb (in Italian, but Universal) for a fantastic collection of local photos and webcams of the eruption.
Volcanic eruptions are breathtaking events to behold. The residual plumes of smoke and ash can stay aloft for many years and can also effect how we see other astronomical events such as our view of solar and lunar eclipses.
For a more tranquil view of Earth and inspiration from Carl Sagan, click here
NASA’s Spirit robot is positioned next to an ancient and extinct volcanic feature on Mars. Learn more here
Can you envision a place hotter than Etna ? … A scorching, molten hellish world where the temperatures are unimaginably hot
Comment or send me your photos and eyewitness accounts of erupting Mt Etna
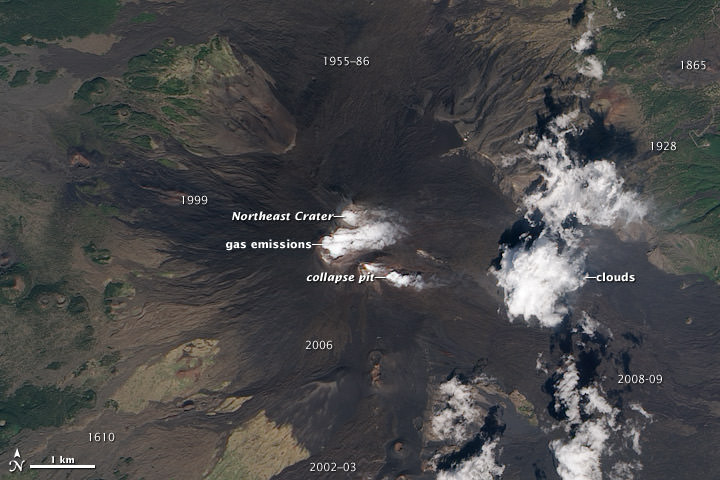
Signs of activity at the summit of Mount Etna, Europe’s most active volcano.
Water vapor and other volcanic gases overflow Etna’s summit craters, spilling out over the volcano’s upper slopes. A steam plume rises from a collapse pit that formed in late 2009, the newest volcanic feature on Etna. Dark lava flows from recent eruptions cover the peak, overlaying lighter, weathered flows from hundreds or thousands of years ago. (Numbers on the image indicate when a flow was erupted.) The oldest lavas are covered by green vegetation. Eruptive cones and fissures also dot the landscape. Frequent explosions deep within the Northeast Crater, which may presage an upcoming eruption, are audible at the summit. These explosions were occurring sporadically every few minutes, as recorded by nearby seismometers. This natural-color satellite image was acquired by the Advanced Land Imager (ALI) aboard (EO-1) on September 26, 2010.Mt Etna photographed by astronauts aboard the International Space Station on August, 2, 2006.
One of the most consistently active volcanoes in the world, Sicily’s Mount Etna has a historical record of eruptions dating back to 1500 BC. This astronaut photograph captures plumes of steam and possibly ash originating from summit craters on the mountain: the Northeast Crater and Central Crater, which includes two secondary craters (Voragine and Bocca Nuova). Locals heard explosions coming from the rim of the Northeast Crater on July 26, 2006, and the plumes shown in this image are likely a continuation of that activity. Credit: NASA.
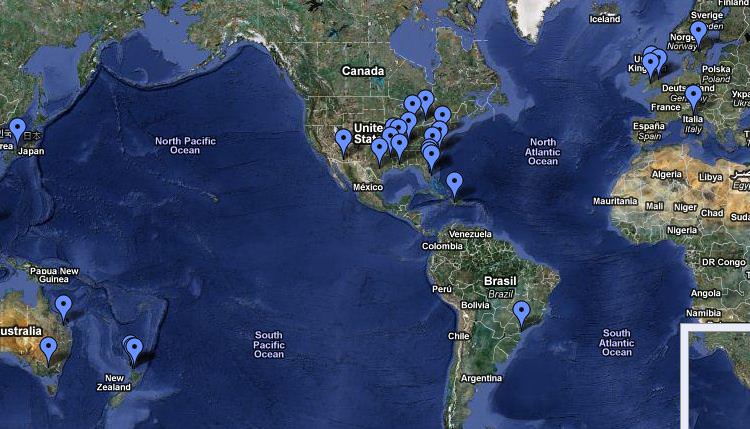
Screenshot of the Google Maps Aflockalypse maps of mass bird deaths.
[/caption]
You have to admit, the news is a little weird: 5,000 blackbirds falling dead from the sky in Arkansas; tens of thousands of dead fish in Chesapeake Bay; 50-100 dead birds found strewn in lawns in Sweden; 40,000 dead crabs washed up on England’s shores; 530 penguins, numerous other seabirds, five dolphins, and three giant sea turtles dead in Brazil; 200 American Coots dead on a Texas bridge; hundreds of snapper fish dead in New Zealand. And the list keeps growing.
Eerie coincidence? Or just a symptom of the digital age where news travels faster than you can say “The End is Nigh?”
You can now keep track of what is being called “Aflockalypse” on Google Maps.
Google Maps links reports of animal deaths, as well as reports of birds that have succumbed to the bird flu. By clicking on the blue balloons on the map you will be given a link that will provide the original news report. You can also click the links in the left side panel of the map.
The map provides a quick look at where the mass, unexplained deaths are taking place. But some say the map could help solve the mystery, as there has been suggestions the map could be overlaid on a current global oil exploration map to test the hypothesis that the deaths could have been caused by ground penetrating tomography.
Or is it? Others have suggested that the internet age allows us to connect the dots where there are none to be connected. The dead birds in Arkansas on New Years Eve — seemingly the first report of mass animal deaths — have been attributed to them flying through a fireworks display, and there could be logical reasons for the others, too.
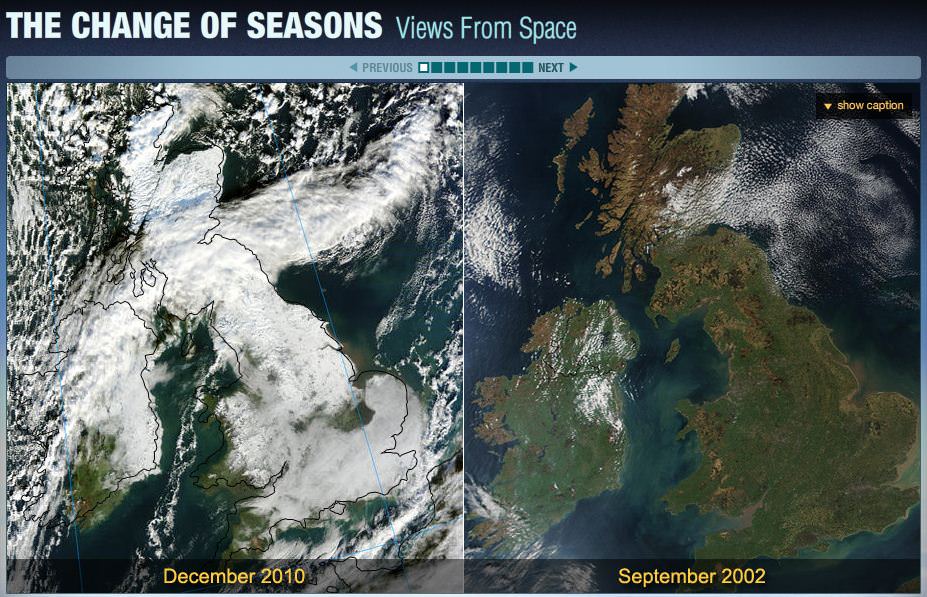
A new NASA webpage allows you to see – as well as share – the changing seasons here on Earth. From space, NASA satellites record the change of seasons, which scientists study regional patterns on Earth. These images also help show bigger changes that may occur over many years, and the slide show, “The Change of Seasons: Views from Space,” shows some of the ways seasonal change affects our planet, and invites you to share your own photos of seasonal change where you live.
Caused by the tilt of Earth’s axis relative to its orbital plane around the sun, seasons have profound changes on our weather and climate. When seasons change, nature reacts differently, depending on location. Temperatures change, rain or snow falls, rivers may flood, to name just a few effects. See the changes in action at the “Change of Seasons” webpage.
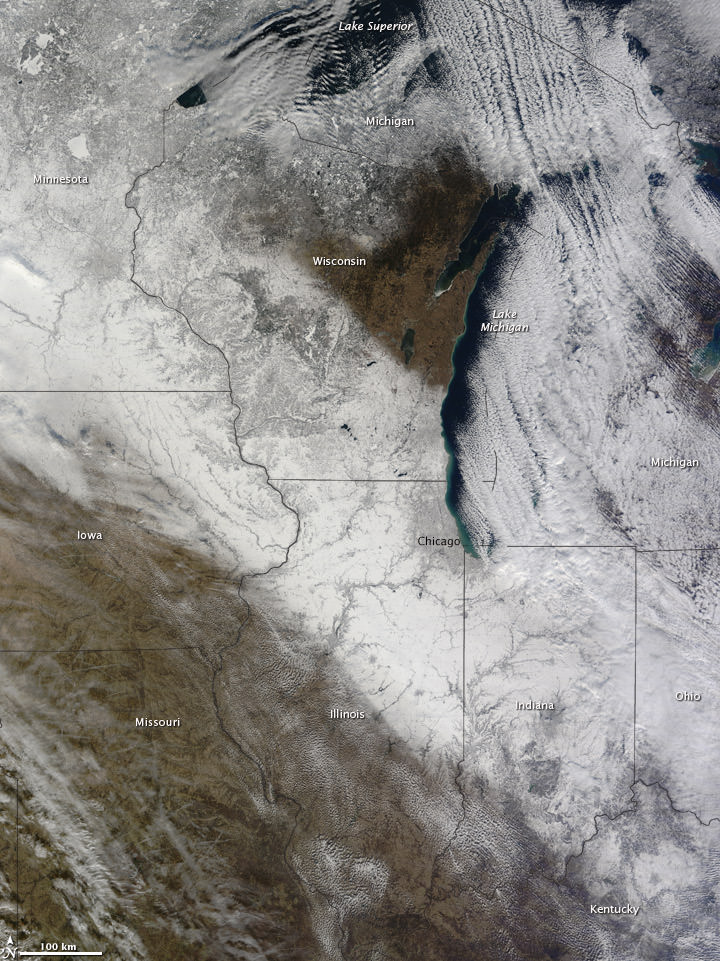
The mid-section of the US got a dose of winter weather, as seen in this satellite image from NASA's Terra spacecraft, taken on Dec. 7, 2010. Credit: NASA
[/caption]
OK, let’s duke it out. Who had it worse this past week as far as wintery weather: the entire United Kingdom, or the middle part of the United States? We’ll the the satellite images tell story.
The Moderate Resolution Imaging Spectroradiometer (MODIS) on NASA’s Terra satellite acquired the image above on December 7, two days after the weekend snow storm. A swath of white defines the path of the storm from Minnesota to Kentucky in the image. Weather predictions look there is more on the way this weekend.
And for the UK:
The UK covered in snow, as seen on Dec. 8, 2010. Credit: NASA's Aqua satellite.
Snow and clouds present an almost uniform white to this satellite image. Snow extends from Northern Ireland southward past Dublin, and from Scotland southward into England. Snow cover stops short of London; the white expanses in that area are clouds. Snow and clouds present an almost uniform white to the satellite sensor, but clouds can be distinguished from the underlying snow by their billowy shapes and indistinct margins.
The United Kingdom Met Office forecast that the cold weather would gradually loosen its grip on the region. For December 9 and 10, 2010, the Met Office forecast rain, but also warned of widespread icy roads.
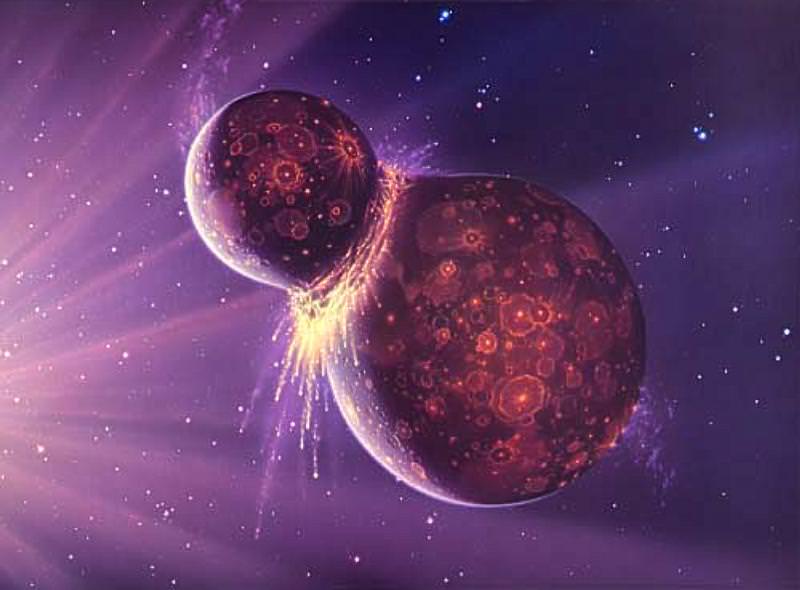
A huge impact may have formed the Moon, but other large impacts could have determined the makeup of Earth and other planetary bodies. Image Credit: Joe Tucciarone
[/caption]
One of the fundamental problems in planetary science is trying to determine how planetary bodies in the inner solar system formed and evolved. A new computer model suggests that huge objects – some as big as large Kuiper Belt Objects like Pluto and Eris — likely pummeled the Earth, Moon and Mars during the late stages of planetary formation, bringing heavy metals to the planetary surfaces. This model – created by various researchers from across the NASA Lunar Science Institute — surprisingly addresses many different puzzles across the Solar System, such as how Earth could retain metal-loving, elements like gold and platinum found in its mantle, how the interior of the Moon could actually be wet, and the strange distribution in the sizes of asteroids.
“Most of the evidence of what happened during the late stages of planetary formation has been erased over time,” said Bill Bottke from the Southwest Research Institute, who led the research team. “The trail we’ve been tracking on these worlds is pretty cold and to be able to dig more information out of what we have and be able answer some long standing problems is pretty exciting.”
Bottke told Universe Today that the story this new model tells “is not as complicated as it looks at first glance,” he said. “It includes a lot of concepts together, and some of the concepts have actually been around for awhile.”
Bottke and his team have published their results in the journal Science.
The researchers started with the widely accepted theory of how our Moon was created by a giant impact between the early Earth and another Mars-sized planetary body. “This was the most traumatic event the Earth probably ever went through, and that was the time when presumably the Earth and Moon both formed their cores,” Bottke said.
The heavy iron fell to the center of the two bodies, and so-called highly siderophile, or metal-loving, elements such as rhenium, osmium platinum, palladium, and gold should have followed the iron and other metals to the core in the aftermath of the Moon-forming event, leaving the rocky crusts and mantles of these bodies void of these elements.
“These elements love to follow the metal,” Bottke said, “so if the metal is draining to the core, these elements would want to drain with them. So if this is right, what we would expect that rocks derived from our mantle should have almost no highly siderophile elements, maybe 10 to the minus 5th level or so. But surprisingly, that is not what we see. They are only less abundant by a factor of less than 200, compared to what we would expect, a factor of 100,000 or so.”
Bottke said this problem has been argued about since the 1970’s, with various suggestions on how to answer the problem.
“The most viable answer is that after the Moon forming impact took place, there were also other things that hit the Earth during the late stages of planet formation, objects that were smaller, and these smaller objects replenished these elements and gave us the abundance we see today. This is what we refer to as late accretion,” he said.
On the Moon, the same thing was happening. But there was a problem with this scenario. The ratio of these elements on the Earth compared with rocks on the Moon is about 1000 to 1.
“The gravitational cross section of the Earth is about 20 times that of the Moon,” Bottke said, “So for every object that hit the Moon, about twenty should have hit the Earth. And if late accretion delivered these elements, you should have about a 20 to 1 ratio. But that is not what we see—we see a 1000 to 1 ratio.”
Bottke – a planetary dynamacist — discussed this with colleague David Nesvorny, also from SWRI, as well as geophysical-geochemical modelers, such as Richard Walker from the University of Maryland, James Day from the University of Maryland, and Linda Elkins-Tanton from the Massachusetts Institute of Technology.
They came up with a computer model that seemed to provide an answer.
“By playing roulette with these objects, I found that very often the Earth was getting hit by huge impactors that the Moon would never see,” Bottke said. “This result suggests that the things hitting the Earth and Moon at the end of the planet formation period was dominated by very large objects.”
The model predicted that the largest of the late impactors on Earth, at 2,400 – 3,200 km (1,500-2,000 miles) in diameter, while those for the Moon, at approximately 240 – 320 km.
Bottke called that a “cute” result – but they needed more supporting evidence. So, they took a look at the last surviving population of the things that built the planets, the inner asteroid belt. “You find large asteroids like Ceres, Vesta and Pallas” Bottke said, so there are the large ones at 500 to 900 km, but then your next largest asteroids are only about 250 km. This matched up with the sizes that our model came up with,” in which no asteroids with “in-between” sizes are observed in this region.
Maps of Mars' global topography. Credit: NASA
Next, they looked at Mars, which has some very large impact basins which are probably left over from the days of when the planet formed, including the Borealis Basin, which is so large it likely accounts for the differences in the northern and southern hemispheres on the Red Planet.
“We looked and projected the size of the impactors that would have created those impact basins and we saw the distribution of sizes was very much like what was predicted for the Earth and Moon, and also what is found in the inner asteroid belt.
So all those things together — the theoretical basis, the observational evidence from elements on the Earth and Moon, and impacts on Mars collectively says something about the distribution of sizes of objects towards the end of planetary formation.
And what are the implications?
“We could make predictions for what was hitting the Earth, Moon and Mars at that time, and they line up with what we see on the surfaces,” Bottke said. “On Mars we can play a game of what is the biggest projectiles that should have hit Mars, and it matches up well with the size that big basin that formed on Mars, and also produced the abundances of elements we see there.”
“For the Moon, the biggest impactors would be 250-300 km, which is about the size of the south pole Aiken basin,” Bottke continued. “For the Earth, these big impactors explain why some of these impacts managed to hit the Earth and not all the elements went to the core of the Earth.”
Bottke said that adding to the complications, some of the biggest impacts actually may have plowed through the Earth and actually came out the other side — in a very fragmented state — and rained back down on Earth. “If this is true, this provides a way to spread fragments all the way across the Earth,” he said, “but how the debris gets redistributed around the planetary body is a really interesting question. That part needs a lot more work and is simply at the edge right now of what we can do numerically.”
When it comes to water on the Moon’s interior – which was once thought to be dry, but recent sample measurements, however, suggest that the water content in the lunar mantle is between 200 and several thousand parts per billion — Bottke’s model could also address this issue.
“If true,” the team writes in their paper, “it is possible that the same projectile that delivered most of the Moon’s HSEs may have also have provided it with water….Late accretion provides an alternative explanation in case lunar mantle water cannot migrate from the post–giant impact Earth to a growing Moon through a hot and largely vaporized protolunar disk.”
As to why smaller projectiles hit the Moon as compared to Earth, Bottke said it is just a numbers game. “We start with a population which has a certain number of big things, middle sized things and small things,” he said. “And we randomly choose projectiles from that population and for every one big guy that hits the Moon, 20 hit the Earth. And we play that game, and if the number of projectiles is limited, if the Moon only gets hit once or twice from this population, that means the Earth gets hit 20-30 times, that is enough to give us – on most occasions – what we see.”
Bottke said this research gave him a chance to work with geochemists, “who have all sorts of interesting things to say which help constrain the processes that brought about planet formation. The problem is that sometimes they have great information but they don’t have a dynamical process that can work. So by working together I think we were able to come up with some interesting results.”
“The most exciting thing for me is that we should be able to use these abundances that we have on the Earth, Moon and Mars to really tell the story about planet formation,” Bottke said.
NASA’s Cassini Spacecraft is doing some awesome stuff. Stay tuned to NASA’s twitter feed Space Cadets, today should be interesting. I’m Benjamin Higginbotham and this is your SpacePod for November 30th, 2010. Continue reading “Cassini visits Enceladus – SpacePod 2010.11.30”
Trackable objects in Low Earth Orbit. Image Credit: ESA
[/caption]
Russia is looking to build a $2 billion orbital “pod” that would sweep up satellite debris from space around the Earth. According to a post on the Russian Federal Space Agency, Roscosmos’ Facebook site, (which seems to confirm an earlier article by the Interfax news agency) the cleaning satellite would work on nuclear power and be operational for about 15 years. The Russian rocket company, Energia proposes that they would complete the cleaning satellite assembly by 2020 and test the device no later than in 2023.
“The corporation promises to clean up the space in 10 years by collecting about 600 defunct satellites on the same geosynchronous orbit and sinking them into the oceans subsequently,” Victor Sinyavsky from the company was quoted as saying.
Sinyavsky said Energia was also in the process of designing a space interceptor that would to destroy dangerous space objects heading towards the Earth.
No word on exactly how the space debris cleaner would work, of how it would push dead satellites and other debris into a decaying orbit so that objects would burn up in the atmosphere, or if it might somehow gather up or “vacuum” debris. But at least someone is thinking about space debris and asteroid deflection and putting more than just a few rubles (60 billion of ’em) towards these concepts.
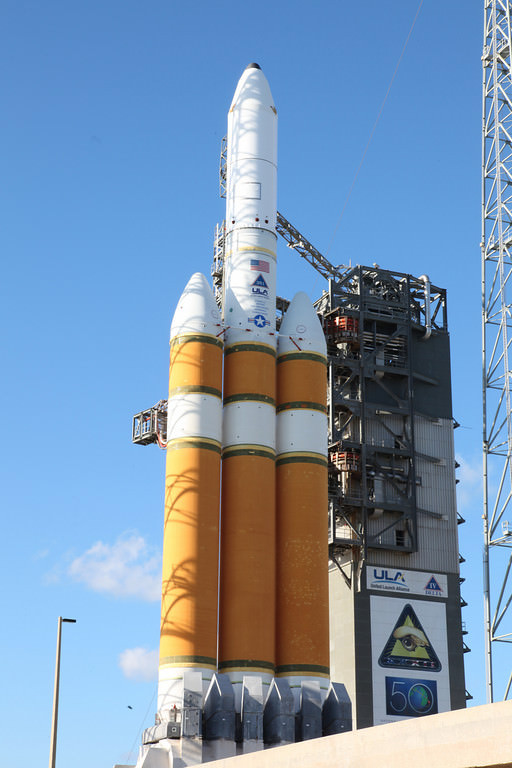
The Delta IV rocket now scheduled for launch on Nov. 21, 2010. Credit: Alan Walters (awaltersphoto.com) for Universe Today
[/caption]
Those waiting for a launch from Florida’s Space Coast will have to wait a little more. The liftoff of a United Launch Alliance (ULA) Delta IV Heavy rocket has been pushed back yet again, and is now scheduled for Sunday, Nov. 21 at 5:58 p.m. EST (2258 GMT) from Space Launch Complex 37 (SLC 37) at Cape Canaveral Air Force Station. The rocket will carry a National Reconnaissance Office payload.
Launch Complex 37 at Cape Canaveral Air Force Station. Credit: Alan Walters (awaltersphoto.com) for Universe Today.
Delayed from the 18th, the next countdown started on Friday, but this too was not to be. As technicians started to fuel up the rocket’s twin strap on boosters encountered temperature anomalies. Engineers did not want to give an estimate as to when the rocket will be ready for launch – until they had a chance to unload the fuel and give the vehicle a closer look.
The Delta IV with a NRO payload. Photo Credit: Universe Today/Alan Walters - awaltersphoto.com
The payload for this mission is a classified spy satellite. In media advisories released by the 45th Space Wing it is described only as a ‘Galaxy 3.’ The 45th is stationed out of Patrick Air Force Base. The Delta IV Heavy is the largest rocket in the Delta 4 family, with three booster cores combined to form what is essentially a triple-bodied rocket.
As far as space shuttle Discovery, NASA managers are still keeping all their options open. Inspectors this week found a fourth crack in support beams on the external fuel tanks of the space shuttle. The work to repair the cracks is ongoing, but the teams will need to complete an engineering review and develop the necessary flight rationale in order to launch with a damaged tank. On Thursday, NASA announced that the flight will launch no earlier than Dec. 3, four days after the opening of a short end-of-year launch window.
The window closes Dec. 6. If NASA cannot get Discovery off the ground in the next available launch window, there is only one other planned launch at KSC/CCAFS for this year. This is the Dec. 7 launch of SpaceX’s Falcon-9 with its Dragon spacecraft payload. If this launch happens before the end of this year, it will mark the first demonstration flight of the $1.6 billion Commercial Orbital Transportation Services contract that the private space firm has with the space agency.


 for Universe Today.")

