[/caption]
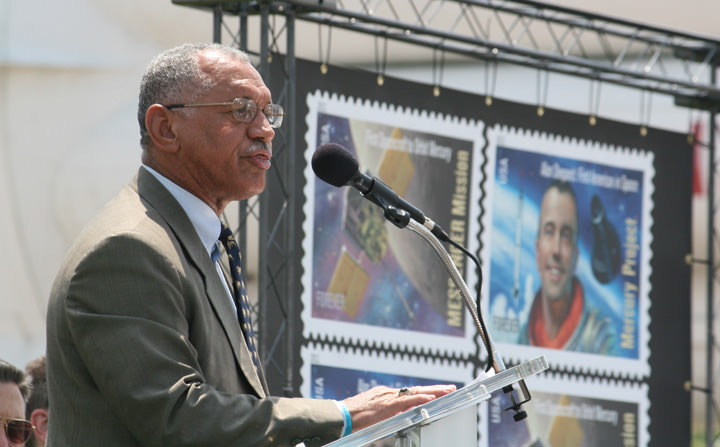
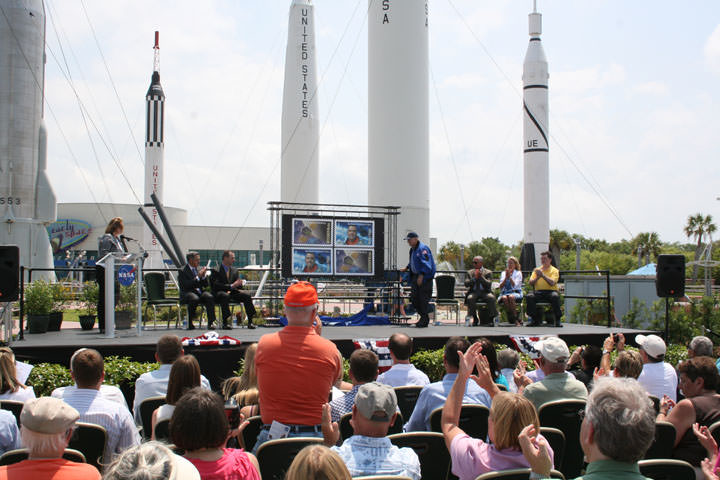
KENNEDY SPACE CENTER – 50 Years ago this week, Alan B. Shepard became the first American to be launched into space. Shepard blasted off on May 5, 1961 from Cape Canaveral, Florida. NASA and the US Postal Service honored Shepard’s historic achievement today (May 4) at an Official First-Day-of-Issue dedication ceremony at NASA’s Kennedy Space Center in Florida.
Alan Shepard was one of the seven Project Mercury astronauts – who will be collectively known for all eternity as – “The Original 7”.
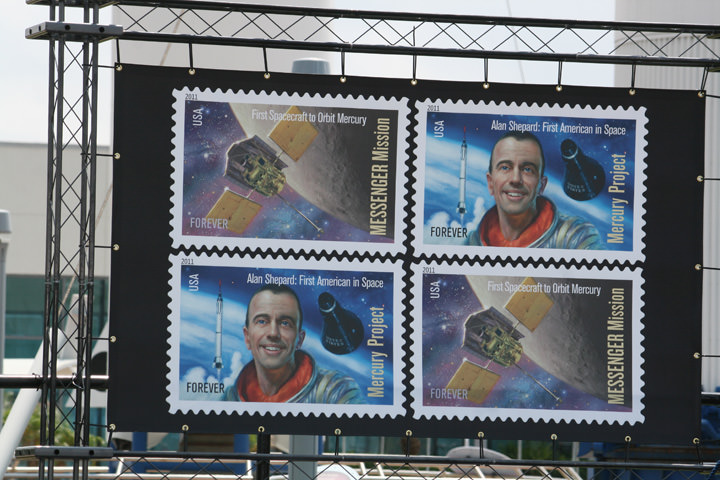
The US Postal Service simultaneously released two new 44 cent Forever Stamps at today’s commemoration, which bookend two historic space achievements – Shepard’s inaugural manned spaceflight aboard the Mercury capsule and NASA’s unmanned MESSENGER mission which recently became the first probe from Earth to achieve orbit about the Planet Mercury.
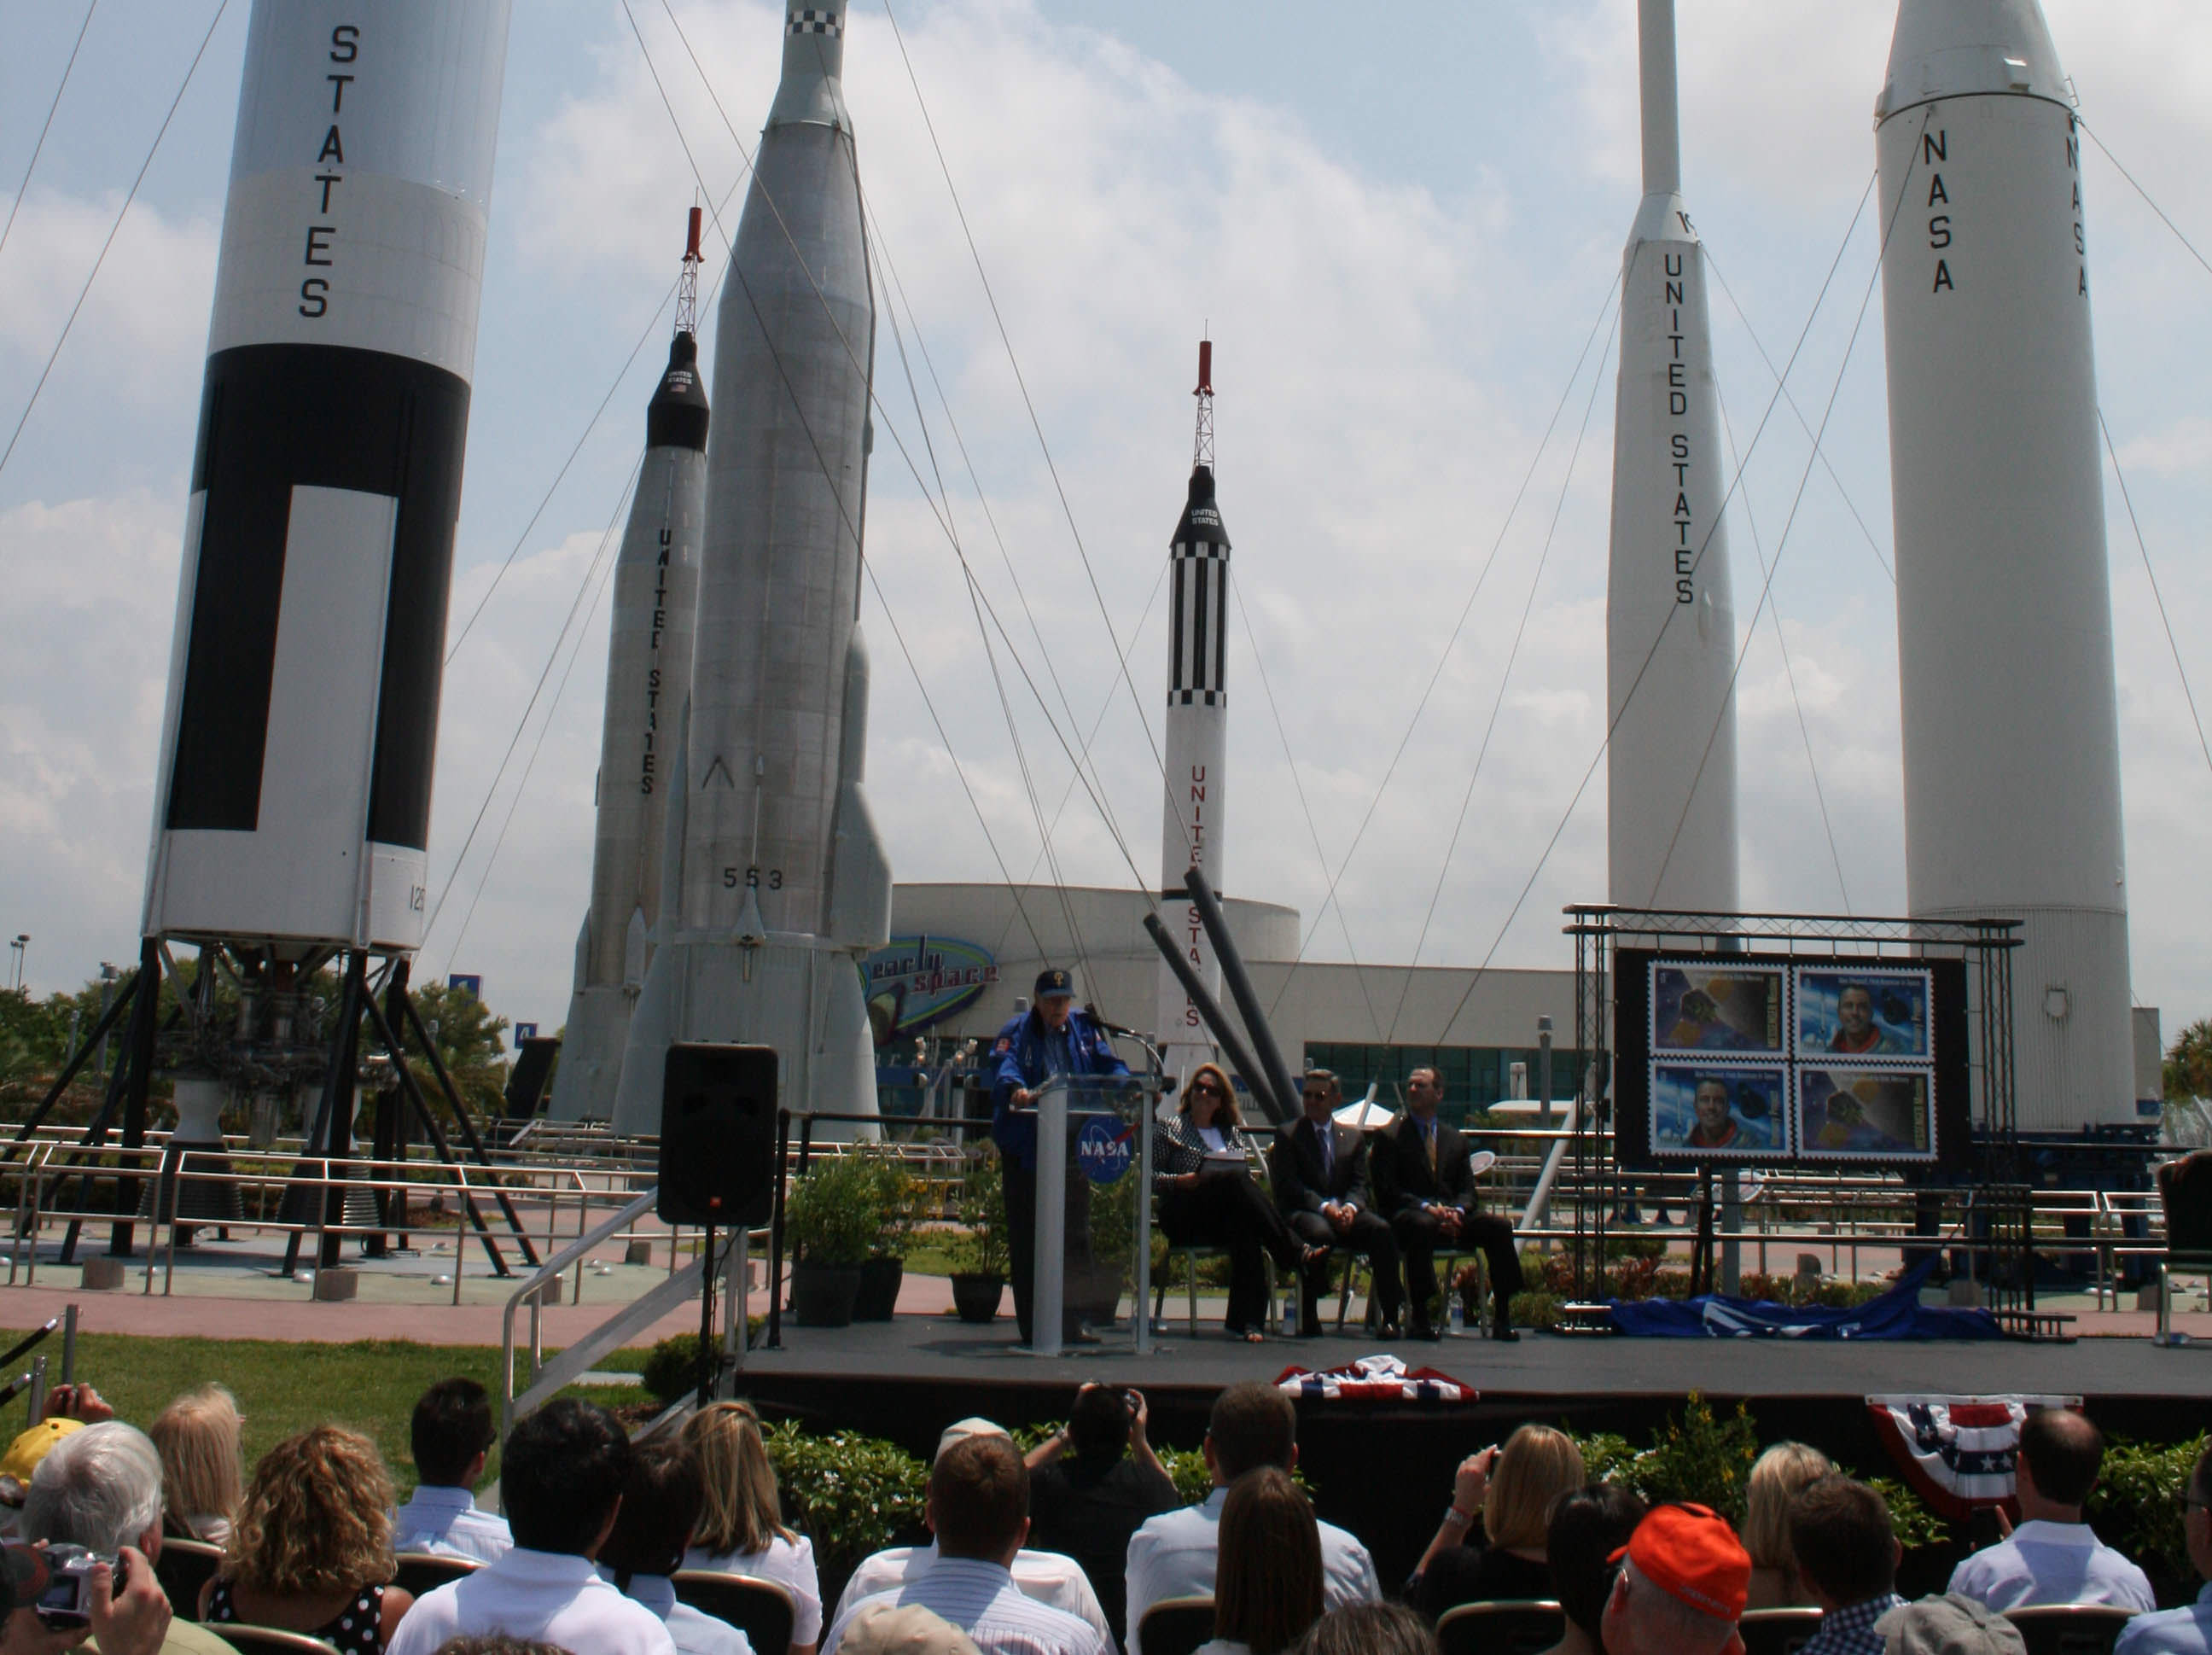
Fellow Mercury Astronaut Scott Carpenter attended the ceremony and unveiled the stamps along with Steve Masse, United States Postal Service Vice President of Finance at the Rocket Garden at the KSC Visitor Complex.
“Today we celebrate the 50th anniversary of many, many important issues, among them is the first steps from the home planet that were taken by the family of man,” said Carpenter.
Although Shepards suborbital flight aboard the one man “Freedom 7” Mercury capsule lasted barely 15½ minutes, the flight ignited America’s Moon landing effort and propelled American Astronaut Neil Armstrong to become the first human to set foot on the moon on July 20, 1969 during the Apollo 11 mission – one of the crowning technological achievements of the 20th Century.
The success of “Freedom 7” emboldened President John F. Kennedy to declare that America “should commit itself to achieving the goal, before this decade is out, of landing a man on the moon and returning him safely to the Earth,” just three weeks later on May 20.
“That was largely a response to Alan’s success,” Carpenter told the crowd of assembled officials, journalists and visitors. Also on hand for the stamp dedication was Shepard’s daughter Laura Shepard Churchly; Charles Bolden, NASA Administrator and former shuttle astronaut; Bob Cabana, KSC Director and former shuttle astronaut; and Jim Adams, NASA deputy director, Planetary Science.
“A decision was made not to put 44 cents on the stamp, but it is forever,” Carpenter emphasized. “It is appropriate to the time we should honor and remember Alan B Shepard and Freedom 7.”

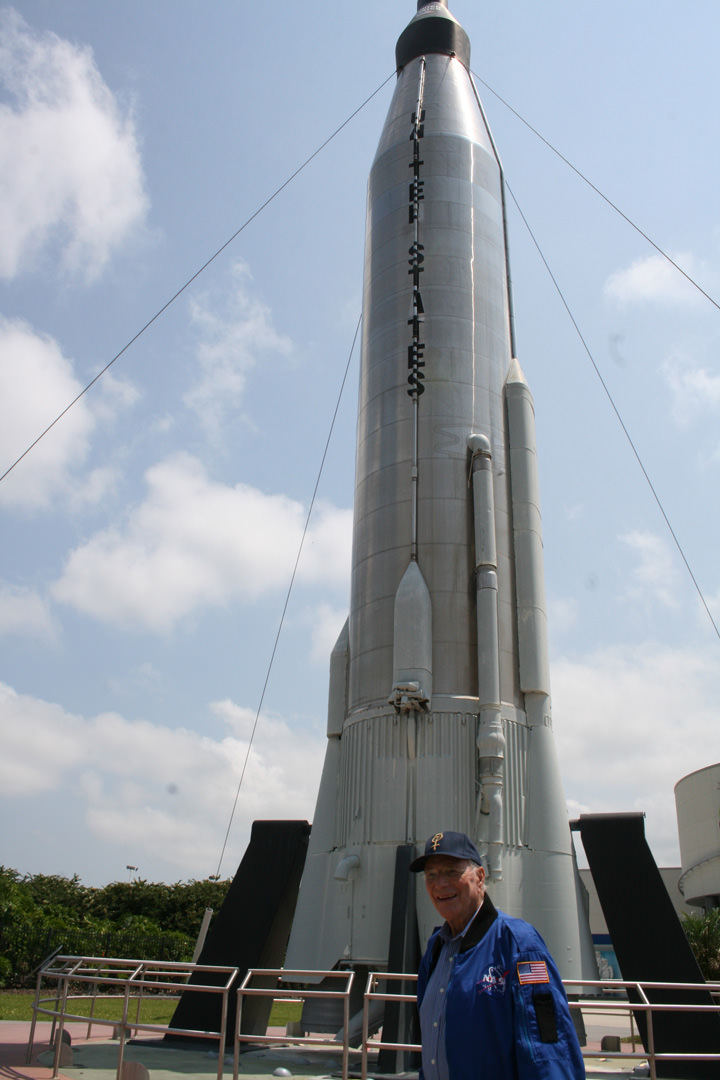
Shepard’s tiny capsule measured just six feet by six feet, reached a maximum speed of 5,100 MPH, roughly eight times the speed of sound, and a zenith of 116 miles above the Earth. Freedom 7 was bolted atop a Redstone rocket that generated only 78,000 pounds of thrust, followed a ballistic arc and landed 300 miles down range in the ocean.
“These stamps, which will go out by the millions across this country, are a testament to the thousands of NASA men and women who shared dreams of human spaceflight and enlarging our knowledge of the universe,” said Bolden.
Shepard’s flight and MESSENGER both blasted off from launch pads quite close to one another at Cape Canaveral Air Force Station which is adjacent to the Kennedy Space Center.
On Thursday May 5, watch for my on site coverage of NASA’s special ceremony marking the 50th Anniversary of Shepard’s milestone “Freedom 7” mission – and an interview with Scott Carpenter.
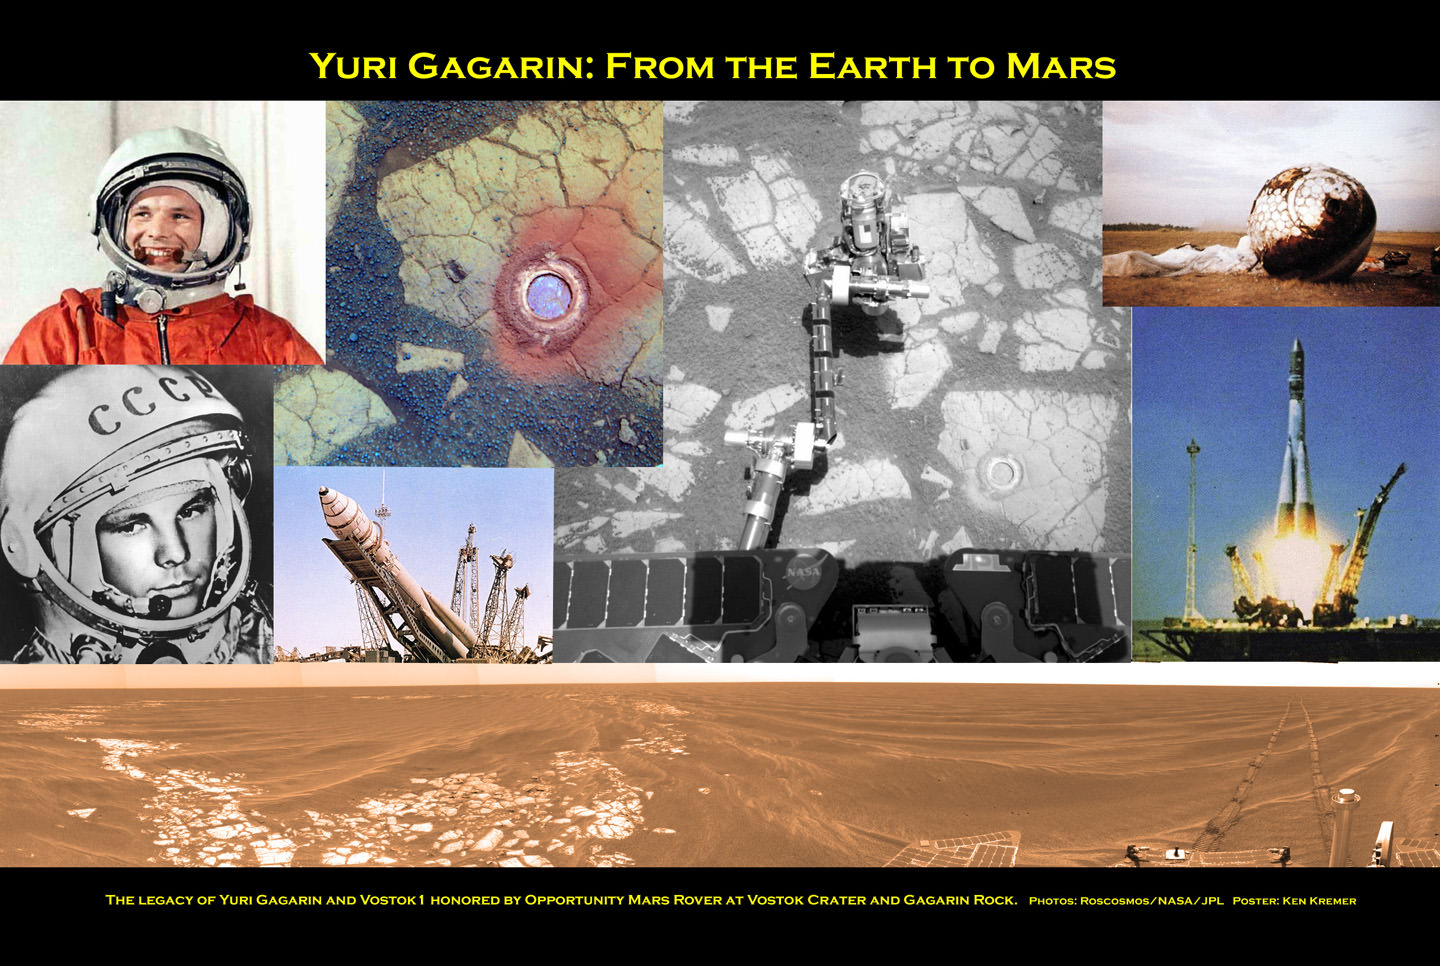
Shepard’s mission came barely three weeks after Cosmonaut Yuri Gagarin became the first human to orbit the Earth. The bold flights of these brave Cosmonauts and Astronauts – backed by a few insightful political leaders – began the Era of Human Spaceflight. As the shuttle program winds to a close, the future of US Human Spaceflight is very uncertain.
Read my related articles about Yuri Gagarin and the 50th Anniversary of Human Spaceflight:
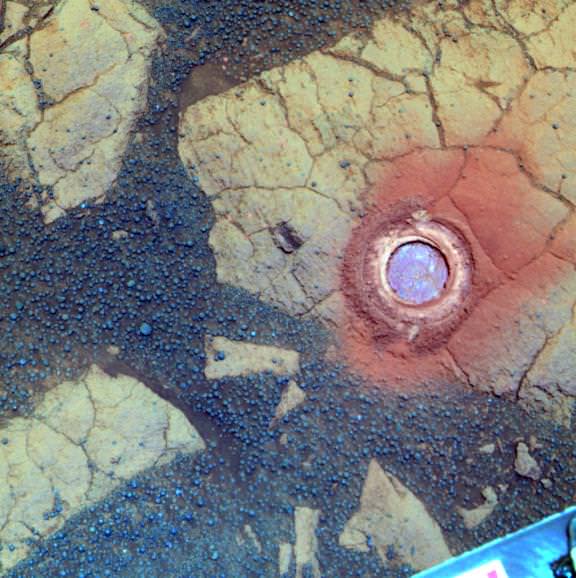
Yuri Gagarin and Vostok 1 Photo Album – 50th Anniversary of Human Spaceflight
Countdown to Yuri’s Night and the 50th Anniversary of Human Spaceflight !
Stirring Video Tributes to Yuri Gagarin
Yuri Gagarin From the Earth to Mars Tribute