Deadly and Destructive Path of Hurricane Irene seen in NASA Videos and Images

Irene Makes Landfall Over New York. This GOES-13 satellite image is of Hurricane Irene just 28 minutes before the storm made landfall in New York City. The image shows Irene's huge cloud cover blanketing New England, New York and over Toronto, Canada. Shadows in Irene's clouds indicate the bands of thunderstorms that surrounded the storm. Credit: NASA/NOAA GOES Project

NASA Video Caption: The Life of Hurricane Irene from the Caribbean to Canada from August 21 through August 29 seen by NASA/NOAA satellites. Credit: NASA/NOAA/GOES/MODIS

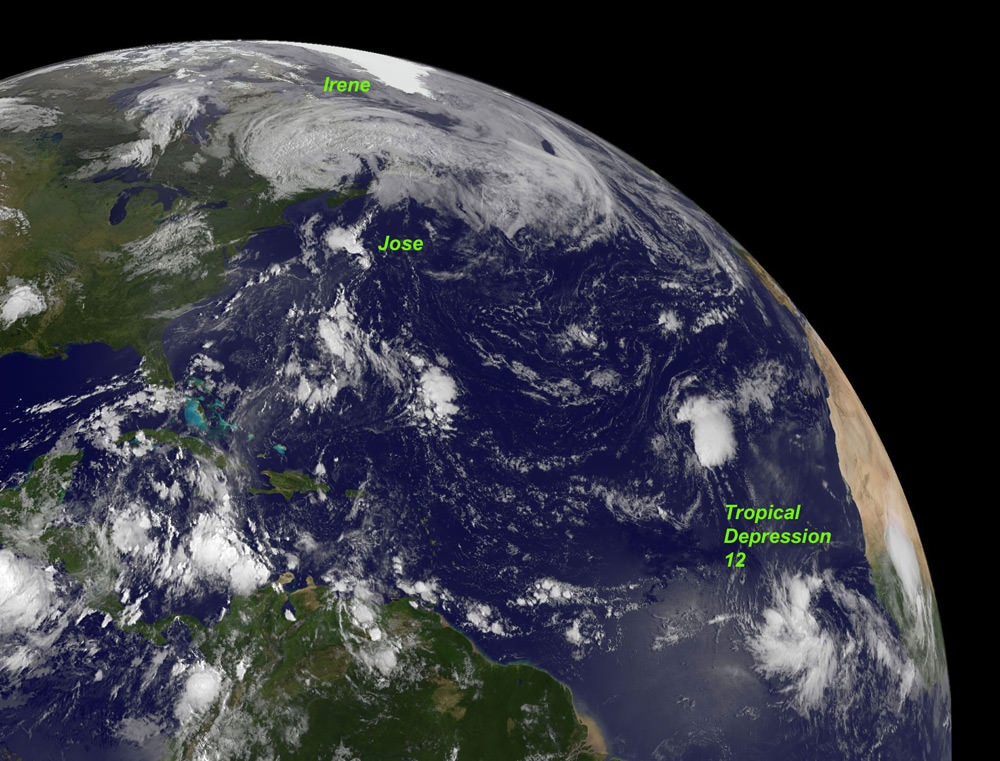
The new NASA animation above shows the birth and subsequent destructive and deadly path followed by Hurricane Irene from August 21 through August 29, 2011 starting in the Caribbean, and then tracking along the US East Cost and up into Canada. The observations combine images taken by NASA and NOAA Earth orbiting satellites.

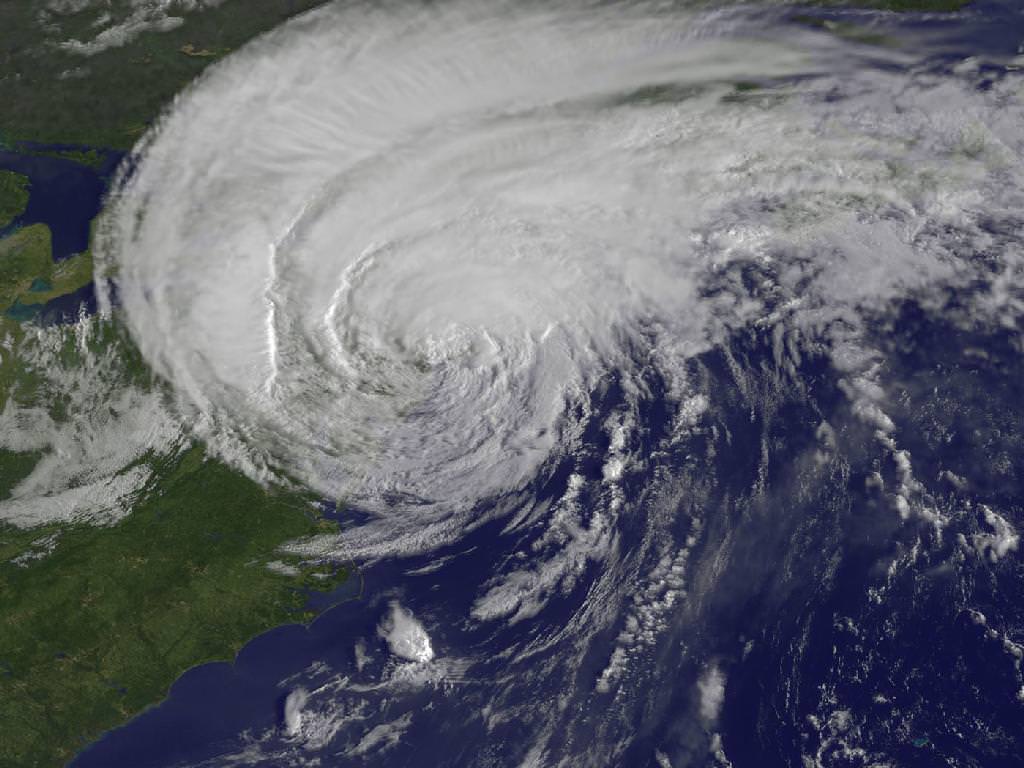
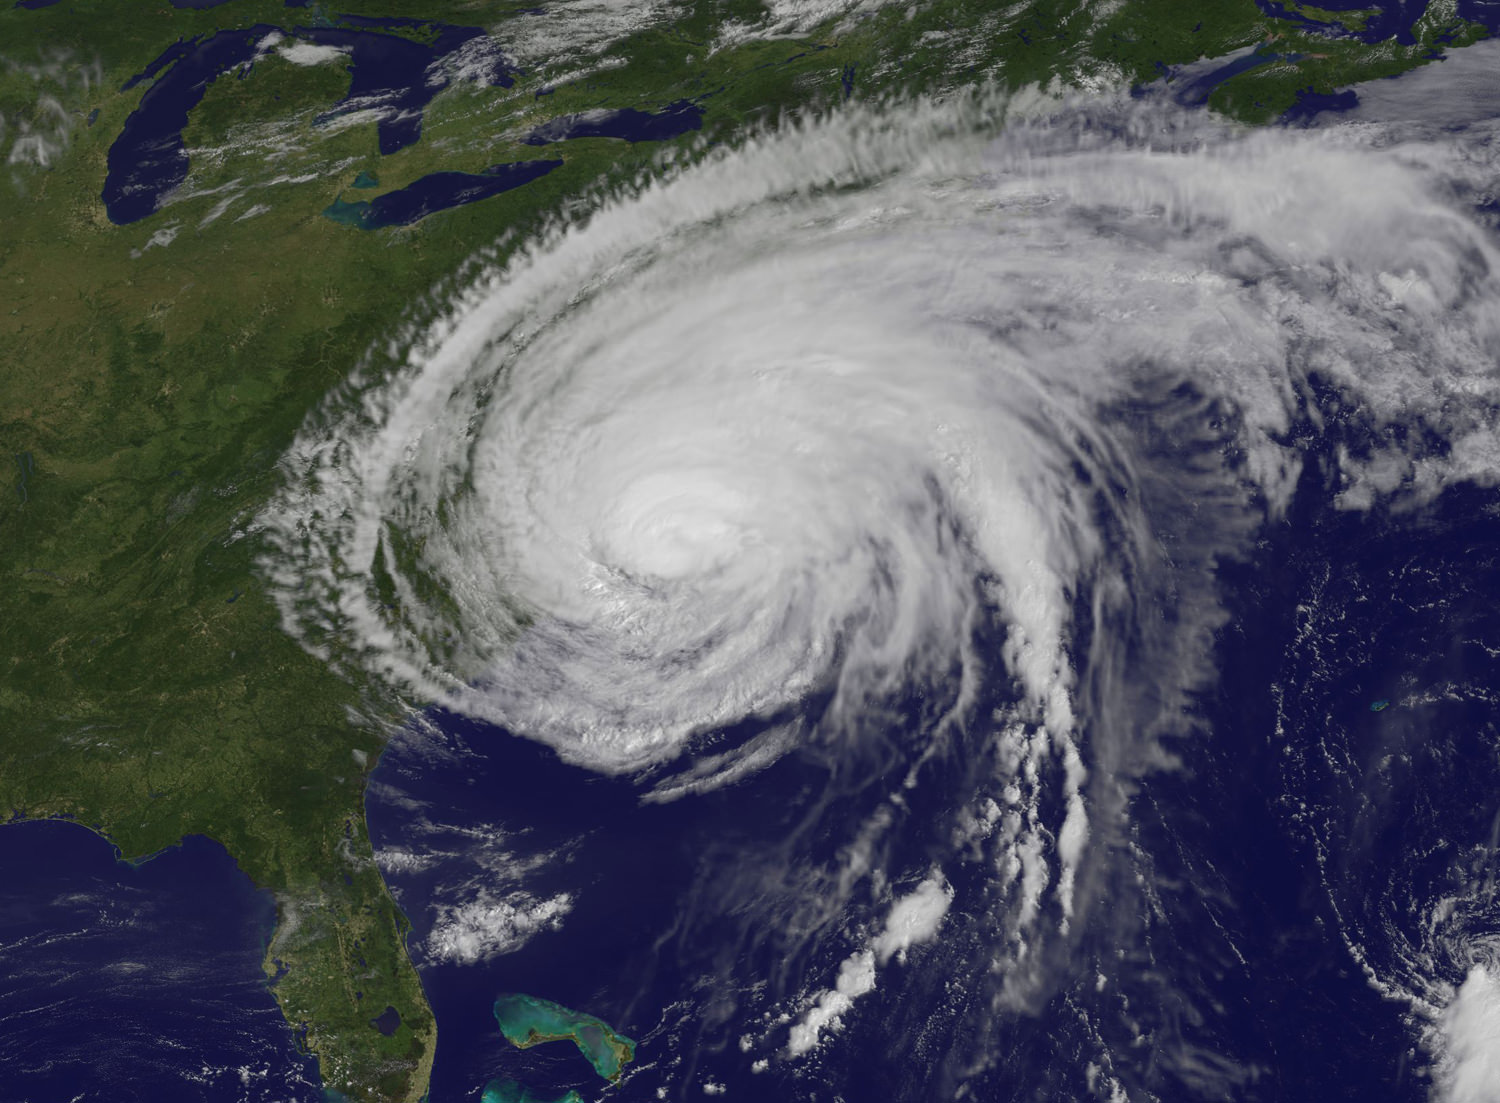
The cloud images were captured by the NASA/NOAA GOES-13 satellite and overlaid on a true-color NASA MODIS map. Irene followed a lengthy course over Puerto Rico, Hispaniola, the Bahamas, and then along the entire US East with landfalls over North Carolina, New Jersey and New York.

NASA ISS astronaut Ron Garan and cameras flying overhead aboard the International Space Station (ISS) also photographed vivid images showing the magnitude of Irene slamming into the US East coast.

Irene caused widespread property damage. Massive and raging flooding in several US states destroyed houses, crushed businesses and washed away bridges and roads and more. The worst flooding is yet to come to some inland portions of Vermont, New Jersey, New York, Pennsylvania and elsewhere as uncontrollable waters continue to rise at numerous rivers, lakes and even ponds, threatening even more misery in their wake.

[/caption]

So far 41 fatalities in 12 states have been attributed to Irene and more may be expected as searches continue. Some communities have been entirely cut off due to washed out access. Airlifts of food and water have begun. More people are being evacuated from New Jersey towns today, Aug 30.

Brave emergency rescue workers have put their own lives at peril and saved the lives of countless others of all ages from babies to the elderly. Some 8 million customers, including my area, lost power due to extensive flooding, downed trees and electrical wires, and devastated infrastructure.

Hurricane Irene twitpic from the International Space Station on 8/27/11 by NASA Astronaut Ron Garan
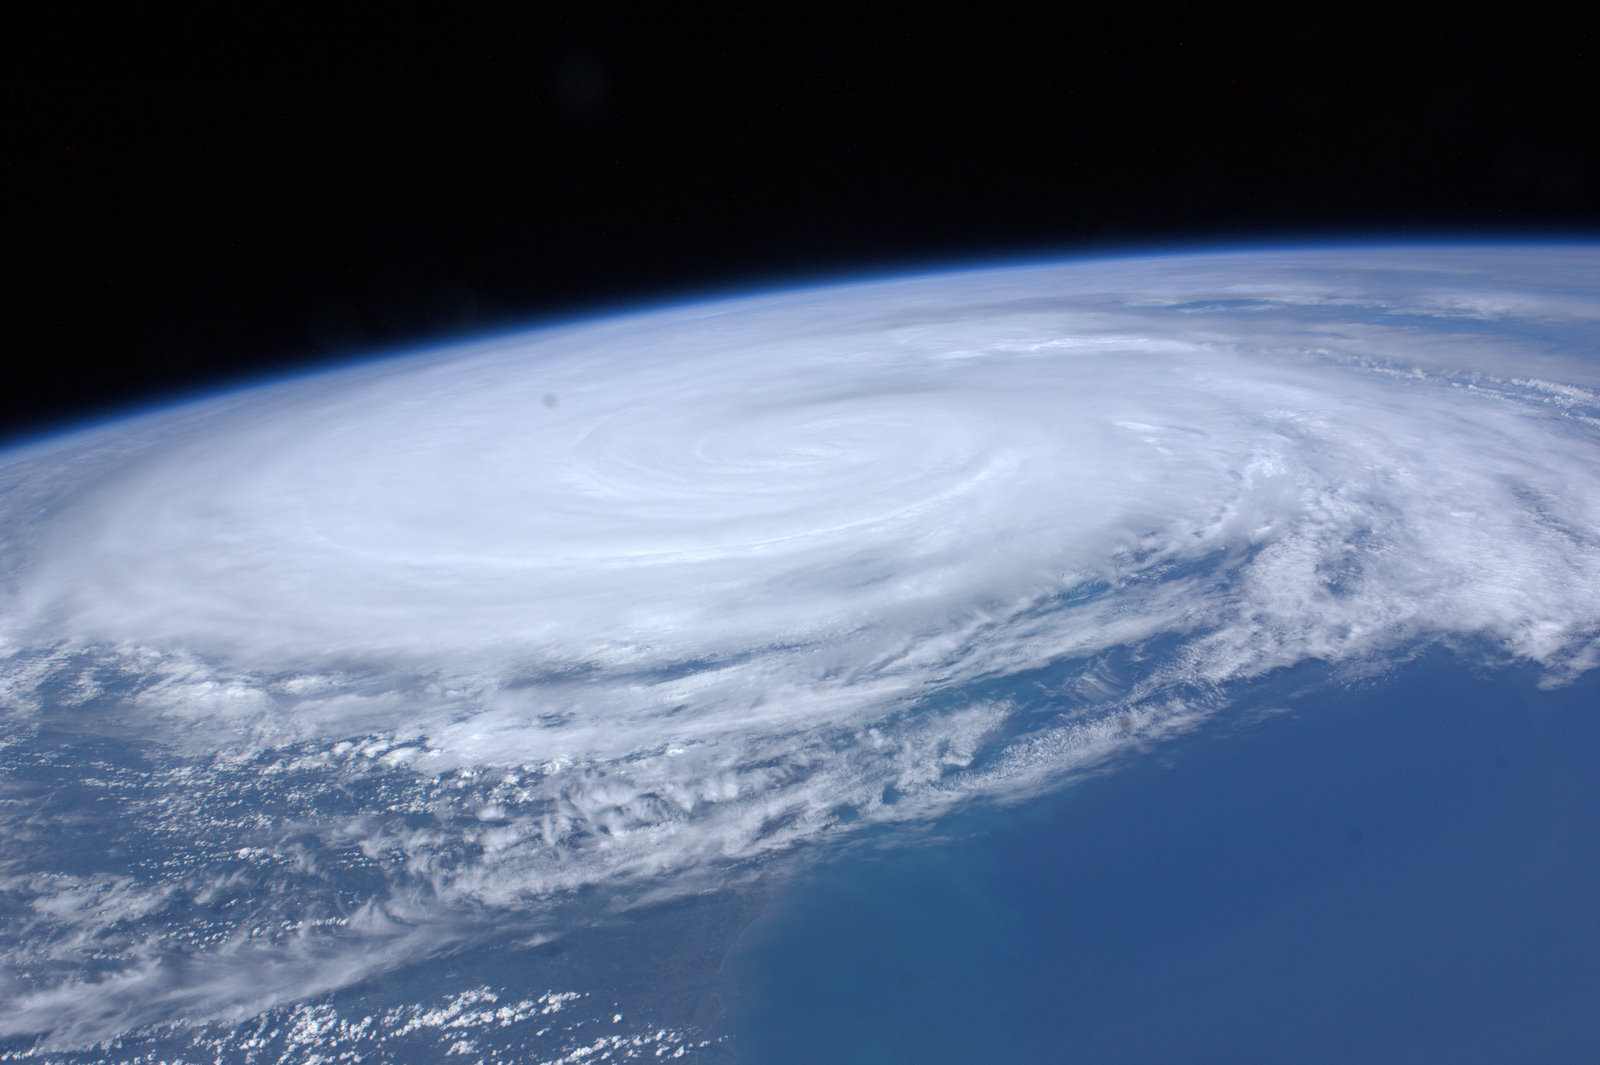
Irene From Space and the ISS as it crossed the coast on August 27, 2011 at 3:32pm EST. Hope everyone is OK wrote NASA Astronaut Ron Garan with his twitpic from the ISS. Credit: NASA/Ron Garan aboard the ISS

Emergency crews are hard at work to restore power as quickly as possible, but many thousands of homes and businesses could be without power for up to a week or more. About 3.3 million customers are still without power today.

NASA’s GOES-13 satellite captured a dramatic view of Hurricane Irene just 28 minutes prior to making landfall over New York City. Today’s NASA Image of the day shows the humongous cloud cover spanning the US East coast from the Mid-Atlantic States up to New Jersey, New York, Pennsylvania, and New England and into Toronto, Canada.

This GOES-13 image from Monday, August 29 at 7:45 a.m. EDT shows an active Atlantic Ocean with the remnants of Hurricane Irene moving into Quebec and Newfoundland (left), Tropical Storm Jose (center) and newly formed Tropical Depression 12 (right). Credit: NASA/NOAA GOES Project
Irene slams into North Carolina. The GOES-13 satellite saw Hurricane Irene on August 27, 2011 at 10:10 a.m. EDT after it made landfall at 8 a.m. in Cape Lookout, North Carolina. Irene's outer bands had already extended into New England. Credit: NASA/NOAA GOES Project

Many transit systems and airports in Irene’s path were shutdown ahead of the storm.

Send me your photos of Irene’s destruction to post at Universe Today.

Explosive Phytoplankton Bloom Seen From Space

Phytoplankton bloom in the Barents Sea. Credit: NASA/Moderate Resolution Imaging Spectroradiometer (MODIS) on the Aqua satellite

[/caption]

Phytoplankton are tiny, microscopic plant-like organisms, but when they get together and start growing they can cover hundreds of square kilometers and be easily visible in satellite images. This image of the Barents Sea was taken on August 14, 2011 by the Moderate Resolution Imaging Spectroradiometer (MODIS) on the Aqua satellite. When conditions are right, phytoplankton populations can grow explosively, a phenomenon known as a bloom. A bloom may last several weeks, but the life span of any individual phytoplankton is rarely more than a few days. The area in this image is immediately north of the Scandinavian peninsula. Blooms spanning hundreds or even thousands of kilometers occur across the North Atlantic and Arctic Oceans every year. But, said Jeff Schmaltz from NASA’s Earth Observatory website, seeing such a wide area without clouds during the bloom is a rare treat.

Phytoplankton thrive in cold ocean waters, which tend to be rich in nutrients. Schmaltz said the milky blue color is an indicator that the bloom probably contains coccolithophores, which are plated with white calcium carbonate. Seen through ocean water, a coccolithophore bloom is bright blue. Other shades may be from other species of phytoplankton.

Source: NASA’s Earth Observatory website

Geodesy Is Alive And Well… And Splitting Hairs On Planet Earth

This view of Earth comes from NASA's Moderate Resolution Imaging Spectroradiometer aboard the Terra satellite. Image credit: NASA

[/caption]

When it comes to planet Earth, it’s very important to know if we’re growing or shrinking. While plate tectonics are responsible for major changes in our planet’s outer crust, we need to have accurate measurements of our atmosphere and magnetic fields, too. To make these appraisals accurate, the global science community established the International Terrestrial Reference Frame.

At one time scientists theorized that Earth might be expanding or contracting. After all, major events like volcanoes, landslides and ice sheets were at the root of significant elevation changes. Even sizable climate events like El Nino and La Nina are responsible for redistributing large amounts of water. Now a new NASA study, published recently in Geophysical Research Letter, has pointed towards the utilization of space measurement tools and a new data calculation techniques which show no vital changes in the size of our planet.

Why is monitoring our size so important? The International Terrestrial Reference Frame is not only important for ground navigation, but satellite tracking as well. NASA says to think of it this way: “If all of Earth’s GPS stations were located in Norway, their data would indicate that Earth is growing, because high-latitude countries like Norway are still rising in elevation in response to the removal of the weight of Ice Age ice sheets.” So for all intents and purposes, the ITRF uses the average center of mass of the total Earth, a computation of a quarter of a century of satellite data. High-precision space geodesy includes:

  • Satellite Laser Ranging — a global observation station network that measures, with millimeter-level precision, the time it takes for ultrashort pulses of light to travel from the ground stations to satellites specially equipped with retroreflectors and back again.
  • Very-Long Baseline Interferometry — a radio astronomy technology that combines observations of an object made simultaneously by many telescopes to simulate a telescope as big as the maximum distance between the telescopes.
  • Global Positioning System — the U.S.-built space-based global navigation system that provides users around the world with precise location and time information.
  • Doppler Orbitography and Radiopositioning Integrated by Satellite — a French satellite system used to determine satellite orbits and positioning. Beacons on the ground emit radio signals that are received by satellites. The movement of the satellites causes a frequency shift of the signal that can be observed to determine ground positions and other information.

A team of scientists led by Xiaoping Wu of NASA’s Jet Propulsion Laboratory, Pasadena, Calif., and including participants from the Institut Geographique National, Champs-sur-Marne in France, and Delft University of Technology in The Netherlands are currently busy assessing the accuracy of the International Terrestrial Reference Frame. Through the use of the new data and calculation techniques combined with measurements of Earth’s gravity from NASA’s Gravity Recovery and Climate Experiment (GRACE) spacecraft and models of ocean bottom pressure, they are even able to account for minute changes in Earth’s gravity. The resultant changes have shown Earth’s radius to vary about 0.004 inches (0.1 millimeters) – or less than the thickness of a human hair.

“Our study provides an independent confirmation that the solid Earth is not getting larger at present, within current measurement uncertainties,” said Wu.

Original Story Source: JPL News.

Ring Of Anti-Protons Found Encircling Earth

PAMELA team and detector in Rome before launch. Photo courtesy of the PAMELA Experiment

[/caption]

When it comes to planets with rings, we know the answer: Jupiter, Saturn, Uranus, and Neptune. But new findings from the PAMELA experiment show that Earth has a ring system, too… One made up of geomagnetically trapped cosmic ray antiprotons.

“The existence of a significant flux of antiprotons confined to Earth’s magnetosphere has been considered in several theoretical works.” says team leader, O. Adriani of the University of Florence Department of Physics. “These antiparticles are produced in nuclear interactions of energetic cosmic rays with the terrestrial atmosphere and accumulate in the geomagnetic field at altitudes of several hundred kilometers.”

The PAMELA experiment – short for Payload for Antimatter Exploration and Light-nuclei Astrophysics – is based on an international collaboration involving about 100 physicists. Its state-of-the-art equipment was designed to investigate the nature of dark matter, the apparent absence of cosmological antimatter and the origin and evolution of matter in the galaxy. Utilizing a permanent magnet spectrometer with a variety of specialized detectors, PAMELA whips around Earth on a highly inclined orbit.

“The satellite orbit (70 degree inclination and 350–610 km altitude) allows PAMELA to perform a very detailed measurement of the cosmic radiation in different regions of Earth’s magnetosphere, providing information about the nature and energy spectra of sub-cutoff particles.” says Adriani. “The satellite orbit passes through the South Atlantic Anomaly (SAA), allowing the study of geomagnetically trapped particles in the inner radiation belt.”

From its subdetectors, PAMELA dished up a serving of antiprotons, but it wasn’t an easy job. “Antiprotons in the selected energy range are likely to annihilate inside the calorimeter, thus leaving a clear signature.” says the team. “The longitudinal and transverse segmentation of the calorimeter is exploited to allow the shower development to be characterized. These selections are combined with dE/dx measurements from individual strips in the silicon detector planes to allow electromagnetic showers to be identified with very high accuracy.”

For 850 days, the detectors collected data and compared it against simulations. The trapped antiprotons were highly dependent on angular collection, directional response function on the satellite orbital position and on its orientation relative to the geomagnetic field. “All the identified antiprotons, characterized by a pitch angle near 90 deg, were found to spiral around field lines, bounce between mirror points, and also perform a slow longitudinal drift around the Earth, for a total path length amounting to several Earth radii.” said the team. “PAMELA results allow CR transport models to be tested in the terrestrial atmosphere and significantly constrain predictions from trapped antiproton models, reducing uncertainties concerning the antiproton production spectrum in Earth’s magnetosphere.”

Original Story Source: Astrophysical Journal Newsletters.

Got Drought? Just Tow in an Iceberg

The Sydney iceberg, an April Fools' joke.

[/caption]

As an April Fool’s joke in 1978, Australian businessman Dick Smith claimed he was towing an iceberg from Antarctica to Sydney Harbour. He used a barge covered with white plastic and fire extinguisher foam in effort to convince those who gathered at the harbor to see it. Apparently, however, the idea is not such a joke after all. A team of engineers from France have studied the concept, did a simulation and found that icebergs floating around in the ocean could be tethered and towed to places that are experiencing a severe drought and water shortages.

The idea originally was conceived in the 1970’s by an graduate student named Georges Mougin, who even received some funds from a Saudi prince to test the idea, but not much came of it.

According to an article on PhysOrg, the French engineers looked into the idea and concluded that towing an iceberg from, for example, the waters around Newfoundland to the Canary Islands off the northwest coast of Africa, could be done, and would take just under five months when towed by a tugboat outfitted with a kite sail, traveling at about one knot.

The cost would be almost ten million dollars, however.

According to a simulated test, the iceberg would lose only 38 percent of its seven ton mass during the trip, if it was fitted with an insulated skirt.

Apparently Mougin is encouraged by the results and now at age 86 is trying to raise money for an actual iceberg-tow.

Read more details on PhysOrg.

Manhattan-Sized Ice Island Seen From Space

An iceberg the size of Manhattan drifts off the coast of Labrador

[/caption]

Taken by NASA astronaut and Expedition 27 flight  engineer Ron Garan, this image shows the Petermann Ice Island (PII-A) currently adrift off the coast of Labrador. The island is a chunk of ice that broke off the Petermann Glacier in Greenland in August of 2010 and has been moving slowly southward ever since. It is currently about 21 square miles (55 square km) in size – nearly the same area as Manhattan!

Garan’s original photo was posted to his Twitter feed earlier today… I cropped the full-size version, rotated it so that south is down and edited it to bring out surface details in the island. Ridges in its surface can be seen as well as many bright blue meltwater ponds.

"Another look at that lonely iceberg from space... can you find it?" @Astro_Ron

Overlaid on the left side is an approximate scale size of Manhattan. This thing is BIG!

PII-A is currently drifting toward Newfoundland but is unlikely to reach land… its base will run against the sea floor long before that. But it has been reported to be posing a problem for ships and offshore oil rigs. (Read more about PII-A on NASA’s Earth Observatory site here.)

When he’s not performing other duties aboard the Space Station, Ron Garan posts photos of Earth from orbit on his Twitter feed (@Astro_Ron) and also on his website FragileOasis.org, thereby sharing his unique and privileged perspective on our world. Founded by Garan, Fragile Oasis is a site that supports and publicizes many global projects supporting humanitarian and environmental missions. Visit, become a member, and you too can “learn, act, and make a difference.” After all, who better than an astronaut would know how much our world is connected, and how fragile it really is!

Image credit: NASA / Ron Garan. Edited by Jason Major.

PS: If you want an idea of how something like this would look like up close, check out this video below taken from a ship near one of the smaller pieces of the ice island!

_______________________

Jason Major is a graphic designer, photo enthusiast and space blogger. Visit his website Lights in the Dark and follow him on Twitter @JPMajor or on Facebook for the most up-to-date astronomy awesomeness!

June 21 ATV Re-Entry: A Man-Made Fireball In The Sky

ATV re-entry. Credit: ESA

[/caption]

The Johannes Kepler ATV (Automated Transfer Vehicle) has undocked from the International Space station and will re- enter Earth’s atmosphere on June 21st ending its mission in fiery destruction.

The ATV has been docked with the ISS since February, where it delivered supplies, acted as a giant waste disposal and boosted the orbit of the International Space Station with its engines.

The X-wing ATV delivered approximately 7 tonnes of supplies to the station and will be leaving with 1,200kg of waste bags, including unwanted hardware.

The Johannes Kepler ATV-2 approaches the International Space Station. Docking of the two spacecraft occurred on Feb. 24, 2011. Credit: NASA

On June 21st at 17:07 GMT the craft will fire its engines and begin its suicide mission, tumbling and burning up as a bright manmade fireball over the Pacific Ocean. Any leftover debris will strike the surface of the Pacific ocean at 20:50 GMT.

During the ATV’s re-entry and destruction there will be a prototype onboard flight recorder (Black Box) transmitting data to Iridium satellites, as some aspects of a controlled destructive entry are still not well known.

ESA says that this area is used for controlled reentries of spacecraft because it is uninhabited and outside shipping lanes and airplane routes. Extensive analysis by ESA specialists will ensure that the trajectory stays within safe limits.

There still are some chances to see the ISS and Johannes Kepler ATV passing over tonight, but if you in a location where you can see the south Pacific skies starting at about 20:00 GMT, keep an eye out for a glorious manmade fireball.

A shower of debris results as the ATV continues its plunge through the atmosphere. Credit: ESA

Read more about the re-entry at ESA.

The longest day – Summer Solstice 21st June 2011

Solstice Sunset Credit:Adrian West

[/caption]

June 21st, 2011 is Summer Solstice – the longest day of the year.

This is the time when the Sun is at its highest or most northerly point in the sky in the Northern Hemisphere and when we receive the most hours of daylight. If you live in the Southern Hemisphere it is the reverse, so you will be having “Winter Solstice.”

Also known as “Midsummer” the Summer Solstice gets its name from the Latin for sol (sun) and sistere (to stand still). The Sun reaches its most Northerly point and momentarily stands still before starting its journey South in the sky again until it reaches its most Southerly point “Winter Solstice”, before repeating the cycle. This is basically how we get our seasons.

It’s not actually the Sun that moves North or South over the seasons although it may appear so. It’s the Earths axial tilt that causes the Sun to change position in the sky as the Earth orbits the Sun throughout the year.

Why Are There Seasons
The angle of the Sun and the Earth's seasons. Image credit: NASA

Summer Solstice/ Midsummer is steeped in ancient folklore especially in Northern Europe with the most famous place directly related to it being Stonehenge, where the sun has been worshiped for thousands of years.

Stonehenge Credit: bistrochic.net

The Sun reaches its most Northerly point in the sky at 17:16 UTC momentarily and from that point forward starts to make its way South. This means the days will get shorter and shorter until Winter Solstice in December.

Coming Soon – Night Shining Noctilucent Clouds

Noctilucent Cloud Display Credit: Adrian West

[/caption]

Soon you may see an eerie spectacle on clear summer nights if you are located at latitudes between 50° and 70° north and south of the equator: Noctilucent Clouds.

These ghostly apparitions are a delight to see and are quite rare. It is incredibly difficult to predict exactly when they will appear, but we do know they should begin to appear soon.

The season for Noctilucent Clouds (Noctilucent = Latin for “Night Shining”) starts early June and continues into late July. They are seen just after dusk, or before dawn and an apparition can last around an hour.

These mysterious clouds, with their bizarre tenuous wispy shapes reminiscent of ripples in sand or the changing surface of a pool of water, spread like a glowing web across the northern sky. Colours can range from brilliant whites, with tinges of blue, pink and orange.

Formed by tiny ice crystals, they are the highest clouds in the Earth’s atmosphere, located in the mesosphere at altitudes of around 76 to 85 kilometers (47 to 53 miles) almost at the edge of space.

They are normally too faint to be seen, and are visible only when illuminated by sunlight from below the horizon, while the lower layers of the atmosphere are in the Earth’s shadow. Noctilucent clouds are not fully understood and are a recently discovered meteorological phenomenon, only being recorded for about 120 years.

Noctilucent clouds can only form under very restrictive conditions, and their occurrence can be used as a guide to changes in the upper atmosphere. Since their relatively recent classification, the occurrence of noctilucent clouds appears to be increasing in frequency, brightness and extent.

There is evidence that the relatively recent appearance of noctilucent clouds and their gradual increase, may be linked to climate change. Another recent theory is that some of these bright displays come from particulates and water vapour in the atmosphere left over from Space Shuttle launches.

How can you see them? Over the next couple of months look north during dusk and dawn and try and spot this mysterious and elusive phenomenon. They are best seen when the sun is between 6 and 16 degrees below the horizon, and seem to occur more frequently in the Northern hemisphere than the Southern.

Good luck!

Noctilucent clouds over Blair, Nebraska, USA. Credit: Mike Hollingshead