New Studies: Planetary Rings Harbor Records of Past Smash-Ups

Saturn, imaged by Cassini on approach. Credit: CICLOPS

[/caption]

Planetary rings are more than just astronomical marvels — they’re also a sort of archive, chronicling histories of impacts for decades.

A pair of studies were published online in Science today by two different teams that noticed odd characteristics in the rings of Saturn and Jupiter — and followed them to this promising conclusion. In the first, lead author Mark Showalter of the SETI Institute in Mountain View, Calif. and his team analyzed images of Jupiter’s rings observed in 1996 and 2000 by Galileo, and again in 2007 by Horizon, zeroing in on a pattern they labeled “corrugated,” like a tin roof. Around the same time, Matthew Hedman, from Cornell University in Ithaca, NY and his colleagues discovered similar ripple patterns in the rings of Saturn, from images taken by the Cassini spacecraft.

Image courtesy of Science/AAAS

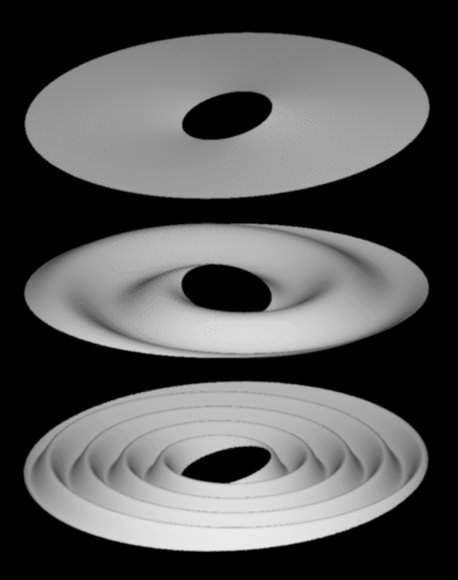
The images above show how a vertical corrugation can be produced from an initially inclined ring. The top image shows a simple inclined ring (the central planet is omitted for clarity), while the lower two images show the same ring at two later times, where the ring particles’ wobbling orbits have sheared this inclined sheet into an increasingly tightly-wound spiral corrugation.

Carolyn Porco, a co-author on the Hedman-led study and director of the Cassini Imaging Central Laboratory for Operatons (CICLOPS), wrote in an email accompanying the release of the studies that “it has been known for some time that the solar system is filled with debris:  small rocky bits in the inner solar system and icy bits in the
outer solar system that routinely rain down on the planets and their rings and moons.  A couple hundred tons of such debris hits the Earth alone every day. Well, the origins of the spiral ripples in both ring systems have now been pinpointed to very recent impacts between clouds of cometary fragments and the rings.”

Showalter’s team describes a pair of superimposed ripple patterns that showed up in Galileo images in 1996 and again in 2000.

“These patterns behave as two independent spirals, each winding up at a rate defined by Jupiter’s gravity field,” they write. “The dominant pattern originated between July and October 1994, when the entire ring was tilted by ~2 km. We associate this with the ShoemakerLevy 9 impacts of July 1994. New Horizons images still show this pattern 13 years later and suggest that subsequent events may also have tilted the ring.”

Corrugation in Saturn's D-ring. Credit: NASA

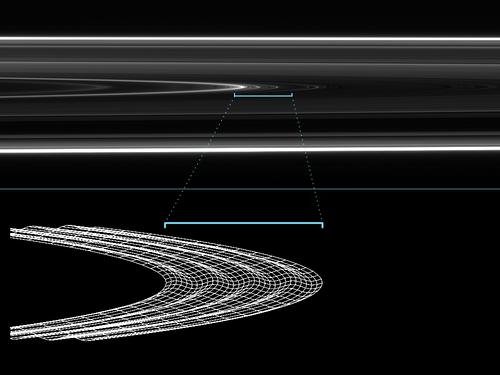
Hedman and his team note that rippling had previously been observed in Saturn’s D ring; NASA released the above graphic to explain the phenomenon in 2006. “The C-ring corrugation seems to have been similarly generated, and indeed it was probably created by the same ring-tilting event that produced the D-ring’s corrugation,” they write.

That paper also compares the rate of impacts likely to visit each planet: “… Saturn should encounter debris clouds derived from comets disrupted by previous planetary encounters at a rate that is roughly 0.2 percent of Jupiter’s impact rate.”

They reason that if Jupiter sees impacts from 1-km-wide objects as often as once a decade, “the clouds of orbiting debris created by the disruption of a 1-km-wide comet should rain down on Saturn’s rings once every 5,000-10,000 years. The probability that debris from a previously disrupted comet would hit Saturn’s rings in the last 30 years would then be between roughly 1 percent and 0.1 percent, which is not very small. Such scenarios therefore provide a reasonable explanation for the origin of the observed corrugation in Saturn’s C ring.”

Taken together, the papers show that Saturn’s ring ripples were likely generated by a comet collision in 1983, while Jupiter’s ring ripples occurred after the impact of a comet the summer of 1994 — specifically, the impact of Comet Shoemaker-Levy 9 that left scars on Jupiter still visible today.

Showalter and his coauthors point out that impacts by comets and/or their dust clouds are common occurrences in planetary rings.

“On at least three occasions over the last few decades, these collisions have carried sufficient momentum to tilt a ring of Jupiter or Saturn off its axis by an observable distance. Once such a tilt is established, it can persist for decades, with the passage of time recorded in its ever-tightening spiral,” they write. “Within these subtle patterns, planetary rings chronicle their own battered histories.”

Both papers appear today at the Science Express website. See also the CICLOPS site.

New Technique Separates the Modest Red Giants From the … Giant Red Giants

Based on results from the first year of the Kepler mission, researchers have learned a way to distinguish two different groups of red giant stars: the giants, and the truly giant giants. The findings appear this week in Nature.

Red giants, having exhausted the supply of hydrogen in their cores, burn hydrogen in a surrounding shell. Once a red giant is sufficiently evolved, the helium in the core also undergoes fusion. Until now, the very different stages looked roughly the same.

Lead author Timothy Bedding, from the University of Sydney in Australia, and his colleagues used high-precision photometry obtained by the Kepler spacecraft over
more than a year to measure oscillations in several hundred red giants.

Using a technique called asteroseismology, the researchers were able to place the stars into two clear groups, “allowing us to distinguish unambiguously between hydrogen-shell-burning stars (period spacing mostly 50 seconds) and those that are also burning helium (period spacing 100 to 300 seconds),” they write. The latter population lend to the star an oscillation pattern dominated by gravity-mode period spacings.

In a related News and Views article, Travis Metcalfe of the Boulder, Colo.-based National Center for Atmospheric Research explains that like the sun, “the surface of a red giant seems to boil as convection brings heat up from the interior and radiates it into the coldness of outer space. These turbulent motions act like continuous starquakes, creating sound waves that travel down through the interior and back to the surface.” Some of the sounds, he writes, have just the right tone — a million times lower than what people can hear — to set up standing waves known as oscillations that cause the entire star to change its brightness regularly over hours and days, depending on its size. Asteroseismology is a method to measure those oscillations.

Metcalfe goes on to explain that a red giant’s life story depends not only on its age but also on its mass, with stars smaller than about twice the mass of the sun undergoing a sudden ignition called a helium flash.

“In more massive stars, the transition to helium core burning is gradual, so the stars exhibit a wider range of core sizes and never experience a helium flash. Bedding and colleagues show how these two populations can be distinguished observationally using their oscillation modes, providing new data to validate a previously untested prediction of stellar evolution theory,” he writes.

The study authors conclude that their new measurement of gravity-mode period spacings “is an extremely reliable parameter for distinguishing between stars in these two evolutionary stages, which are known to have very different core densities but are otherwise very similar in their fundamental properties (mass, luminosity and radius). We note that other asteroseismic observables, such as the small p-mode separations, are not able to do this.”

Source: Nature

New Image: Rosy Glow of Starbirth, Just in Time for Spring

Star cluster and surrounding nebula NGC 371. Credit: ESO/Manu Mejias

[/caption]

Just in time for the start of spring, the ESO’s Very Large Telescope has captured this stunning new image of a region of glowing hydrogen surrounding the star cluster NGC 371.

Regions of ionized hydrogen like this one — known as HII regions — are exploding with the births of new stars. NGC 371 lies in our neighboring galaxy, the Small Magellanic Cloud. It’s an example of an open cluster; its stars all originate from the same diffuse HII region, and over time the majority of the hydrogen is used up by star formation — leaving behind a shell of hydrogen such as the one in this image, along with a cluster of hot young stars.

NGC 371 in the constellation of Tucana (The Toucan). Through a moderate-sized amateur telescope this cluster appears quite large, but dim, and the gas cloud is difficult to see. Credit: ESO, IAU and Sky & Telescope

The Small Magellanic Cloud is a dwarf galaxy just 200,000 light-years away, which makes it one of the closest galaxies to the Milky Way. It contains stars at all stages of their evolution, from the highly luminous young stars found in NGC 371 to supernova remnants of dead stars. These energetic youngsters emit copious amounts of ultraviolet radiation causing surrounding gas, such as leftover hydrogen from their parent nebula, to light up with a colorful glow that extends for hundreds of light-years in every direction.

Open clusters are common; there are numerous examples in our own Milky Way. However, NGC 371 is of particular interest due to the unexpectedly large population of variable stars — stars that change in brightness over time. A particularly interesting type of variable star, known as slowly pulsating B stars, can also be used to study the interior of stars through asteroseismology, and several of these have been confirmed in this cluster. Asteroseismology is the study of the internal structure of pulsating stars by looking at the different frequencies at which they oscillate.

Variable stars play a pivotal role in astronomy: some types are invaluable for determining distances to far-off galaxies and the age of the Universe.

The data for this image were selected from the ESO archive by Manu Mejias as part of the Hidden Treasures competition, which invited amateur astronomer to search through ESO’s archives in hopes of finding a well-hidden gem. Three of Mejias’s images made the top 20. His picture of NGC 371 was ranked sixth in the competition.

Source: ESO press release.

Perseus Cluster Thicker Around the Middle Than Thought

Credits: NASA/ISAS/DSS/A. Simionescu et al.; inset: NASA/CXC/A. Fabian et al.

[/caption]

The Japanese Suzaku X-ray telescope has just taken a close look at the Perseus galaxy cluster, and revealed it’s got a bit of a spare tire.

Suzaku explored faint X-ray emission of hot gas across two swaths of the Perseus Galaxy Cluster. The resulting images, which record X-rays with energies between 700 and 7,000 electron volts in a combined exposure of three days, are shown in the two false-color strips above. Bluer colors indicate less intense X-ray emission. The dashed circle is 11.6 million light-years across and marks the so-called virial radius, where cold gas is now entering the cluster. Red circles indicate X-ray sources not associated with the cluster.

The results appear in today’s issue of Science.

The Perseus cluster (03hh 18m +41° 30) is the brightest extragalactic source of extended X-rays.

Lead author Aurora Simionescu, an astrophysicist at Stanford, and her colleagues note that until now, most observations of galaxy clusters have focused on their bright interiors. The Suzaku telescope was able to peer more closely at the outskirts of the Perseus cluster. The resulting census of baryonic matter (protons and neutrons of gas and metals) compared to dark matter offers some surprising observations.

It turns out the fraction of baryonic matter to dark matter at Perseus’s center was consistent with measurements for the universe as a whole, but the baryonic fraction unexpectedly exceeds the universal average on the cluster’s outskirts.

“The apparent baryon fraction exceeds the cosmic mean at larger radii, suggesting a clumpy distribution of the gas, which is important for understanding the ongoing growth of clusters from the surrounding cosmic web,” the authors write in the new paper.

Source: Science. See also JAXA’s Suzaku site

Famous Binary Cygnus-X1 Displays First-Ever Polarized Emissions

Artist's impression of the Cygnus-X1 binary. Credit: NASA / Honeywell Max-Q Digital Group / Dana Berry

[/caption]

Using the IBIS telescope onboard the European Space Agency’s INTEGRAL satellite, researchers have reported the first measurements of polarization from a black hole binary system, which comprises a black hole and a normal star orbiting around a common center of mass.

The new observations reveal that the chaotic region is threaded by magnetic fields, and represent the first time magnetic fields have been identified so close to a black hole. Most importantly, Integral shows they are highly structured magnetic fields that are forming an escape tunnel for hot matter that would otherwise plunge into the black hole within milliseconds.

Credit: ESA, courtesy of Philippe Laurent

Philippe Laurent is a researcher with the Institute for Research into the Fundamental Laws of the Universe (IRFU), of the CEA in France. He is lead author on the paper, which appears today in Science Express.

Laurent and his colleagues detected polarized gamma-ray photons coming from Cygnus X-1 (19h 58m 21.6756s +35° 12′ 05.775″), a well-known black hole X-ray binary system in the constellation Cygnus. They suggest the polarized emission is originating from a jet of relativistic particles in close proximity to the black hole.

The graph above refers to the team’s results: “whereas the low energy photons seem not to be polarized (the inset line at the left is merely flat), the higher energy ones are strongly polarized (the inset line in the right seems to be sinusoidal), and thus should related to the jet,” Laurent wrote in an email.

The authors reveal more detail through the paper: “Spectral modeling of the data reveals two emission mechanisms: The 250-400 keV data are consistent with emission dominated by Compton scattering on thermal electrons and are weakly polarized,” they write. “The second spectral component seen in the 400keV-2MeV band is by contrast strongly polarized, revealing that the MeV emission is probably related to the jet first detected in the radio band.”

Their evidence points to the black hole’s magnetic field being strong enough to tear away particles from the black hole’s gravitational clutches and funnel them outwards, creating jets of matter that shoot into space, according to an ESA press release. The particles in the jets are being drawn into spiral trajectories as they climb the magnetic field to freedom and this is affecting a property of their gamma-ray light known as polarization.

A gamma ray, like ordinary light, is a kind of wave, and the orientation of the wave is known as its polarization. When a fast particle spirals in a magnetic field it produces a kind of light, known as synchrotron emission, which displays a characteristic pattern of polarization. It is this polarization that the team have found in the gamma rays. It was a difficult observation to make.

“We had to use almost every observation Integral has ever made of Cygnus X-1 to make this detection,” says Laurent.

Amassed over seven years, these repeated observations of the black hole now total over five million seconds of observing time, the equivalent of taking a single image with an exposure time of more than two months. Laurent’s team added them all together to create just such an exposure.

“We still do not know exactly how the infalling matter is turned into the jets. There is a big debate among theoreticians; these observations will help them decide,” says Laurent.

Jets around black holes have been seen before by radio telescopes but such observations cannot see the black hole in sufficient detail to know exactly how close to the black hole the jets originate. That makes these new observations invaluable. Such polarization measurements can provide direct insights into the nature of many astrophysical processes and the researchers say that, in the future, their discovery could further our understanding of the emission mechanisms of Cygnus X-1, a model for other black-hole binaries in the universe.

Source: Science. The paper appears today, at the Science Express website.

Probing the Moho Boundary – Earth’s Own Unexplored Frontier

Chikyu. Credit: JAMSTEC-CDEX

[/caption]

JOIDES Resolution. Credit: IODP

The boundary where Earth’s crust gives way to the unexplored mantle was first detected in 1909, because of a change in the travel of seismic waves. Named the Moho boundary for Andrija Mohorovicic, who listened to those seismic waves, the crust-mantle boundary is a frontier that remains elusive and compelling — harboring tantalizing clues as to the story of Earth’s formation — even as our technologies push into the outer reaches of the solar system and beyond.

The first serious attempts to probe the Moho boundary ran aground in the late 1950s. Now, technology already in use on a Japanese ship, combined with a United States digging program already under way, could finally yield success. Damon Teagle and Benoît Ildefonse have written about the ongoing efforts for an article in the journal Nature, released today.

Teagle is at the University of Southampton’s National Oceanography Centre in the UK, and Ildefonse is at Université Montpellier in France. They are co-chief scientists on an expedition called the IODP Expedition 335, “to obtain for the first time a section of the lower oceanic crust — the material lying just above the mantle,” they write.

The IODP is using the U.S. ship JOIDES Resolution, pictured above, which will drill from April to June this year off the coast of Costa Rica.

“This site is in ocean crust that formed superfast — at more than 20 centimetres a year, much faster than any present day crust formation,” the co-authors write. “That makes the upper crust there much thinner than elsewhere, so it is possible to reach the lower portions without having to drill very deep. Three previous expeditions to Hole 1256D have drilled down to more than 1.5 kilometres below the sea floor, into the transition zone between dikes and gabbros.”

This spring they hope to push it another 400 meters, and recover gabbros from the lower crust, “which will be the deepest types of rock ever extracted from beneath the sea floor,” even though the deepest hole reached 2,111 meters under the eastern Pacific off of Colombia, they write.

Microphotograph of a mantle xenolith, sampled on Rapa Island in French Polynesia. The colourful minerals (seen here under the microscope in cross-polarized light, each grain is about 1 to 5mm large) are olivine, the main constituent of the upper mantle. Credit : Andréa Tommasi (CNRS, Géosciences Montpellier)

Teagle and Ildefonse note that some pieces of the mantle have been thrust up to Earth’s surface during tectonic mountain building, and ejected from volcanoes and sea floor dikes. Those samples have provided clues to the mantle’s composition, but they don’t reveal the variability of the mantle — and all of the samples have been altered by the processes that revealed them.

They say the IODP mission should help to settle many debates, including how crust is formed at mid-ocean ridges, how magma from the mantle is intruded into the lower crust, the geometry and vigor of how sea water can pull heat from the lower oceanic crust and the contribution of the lower crust to marine magnetic anomalies. The project will also provide “further impetus for, and confidence in, deep ocean crust drilling,” write Teagle and Ildefonse — but it will reach a depth far less than what will be needed to actually get at the Moho boundary. It occurs at least 30 kilometers (18 miles) under the continents but just 6 kilometers (3.7 miles) under the seas.

That’s where Chikyu comes in. Launched in 2002, “Chikyu is a giant ship, capable of carrying 10 kilometres of drilling pipes, and is equipped for riser drilling in 2.5 kilometres of water,” the authors write. Although Chikyu wouldn’t yet be able to go the full distance, its design is advanced enough to be the launching pad for such efforts:

“The vessel has a riser system: an outer pipe surrounds the drill string — the steel pipe through which cores are recovered,” the co-authors write. “The drilling mud and cuttings are returned up to the vessel in the space between the two pipes. This helps to recycle the drilling mud, control its physical properties and the pressure within the drill hole and helps to stabilize the borehole walls.”

Teagle and Ildefonse say the ideal drilling program to reach the mantle boundary will happen in one of three places — off the coasts of Hawaii, Baja California and Costa Rica — where the water is the most shallow, over the coldest possible crust. Wherever and however it happens, they write, it will be worth doing:

“Drilling to the mantle is the most challenging endeavour in the history of Earth science. It will provide a legacy of fundamental scientific knowledge, and inspiration and training for the next generation of geoscientists, engineers and technologists.”

Source: Nature. See also the websites for Chikyu and JOIDES.

Coolest Brown Dwarf Spotted by Earth-bound Telescopes

Artist's impression of the binary brown dwarf system CFBDSIR 1458+10. Credit: ESO/L. Calçada

[/caption]

Astronomers have found the coldest known star — a brown dwarf in a double system about as hot as a cup of tea. The discovery blurs the line between small cold stars and large hot planets. The star, CFBDSIR 1458+10B, is the dimmer member of the binary system, about 75 light-years from Earth.

Lead study author Michael Liu, from the University of Hawaii’s Institute for Astronomy, said finding ever-cooler stars “has been one of the big themes of this field since it’s existed in the last 15 years.” Brown dwarfs are essentially failed stars; they lack enough mass for gravity to trigger the nuclear reactions that make stars shine. Liu said while the idea of a brown dwarf is many decades old, they were first confirmed in 1995, the same year the first gas giants were detected around other stars.

“Residing at the extremes of low mass, luminosity and temperature, brown dwarfs serve as laboratories for understanding gas-giant extrasolar planets as well as the faint end of the star formation process,” write the authors in the new paper, in the Astrophysical Journal. “The coolest known brown dwarfs, the T dwarfs, have temperatures (~600–1400 K) … that are more akin to Jupiter than any star.”

Liu said cool brown dwarfs are exciting to find partly because they make great proxies for studying the mysteries of water cloud formation in the atmospheres of gas giants. Such clouds are believed to form when temperatures dip below 400 to 450 K.

“We probably will never get as detailed spectra from gas giants around other stars,” he said, “because the planets are gravitationally bound to their stars. It’s very  hard to isolate the light from gas giant.” But brown dwarfs more often occur in isolation.

Three different telescopes were used to study the system: the ESO’s Very Large Telescope (VLT) in Chile, the Keck II Telescope in Hawaii and the Canada–France–Hawaii Telescope, also in Hawaii. The VLT was used to show that the composite object was very cool by brown dwarf standards.

“We were very excited to see that this object had such a low temperature, but we couldn’t have guessed that it would turn out to be a double system and have an even more interesting, even colder component,” said Philippe Delorme of the Institut de planétologie et d’astrophysique de Grenoble, a co-author of the paper.

CFBDSIR 1458+10 is the name of the binary system. The two components are known as CFBDSIR 1458+10A and CFBDSIR 1458+10B, with the latter the fainter and cooler of the two. They seem to be orbiting each other at a separation of about three times the distance between the Earth and the Sun in a period of about 30 years.

The dimmer of the two dwarfs has now been found to have a temperature of about 100 degrees Celsius, or about 370 K — the boiling point of water, and not much different from the temperature inside a sauna. By comparison the temperature of the surface of the Sun is about 5500 degrees Celsius.

The hunt for cool objects is a very active astronomical hot topic. The Spitzer Space Telescope has recently identified two other very faint objects as other possible contenders for the coolest known brown dwarfs, although their temperatures have not been measured so precisely. Future observations will better determine how these objects compare to CFBDSIR 1458+10B. Liu and his colleagues are planning to observe CFBDSIR 1458+10B again to better determine its properties and to begin mapping the binary’s orbit, which, after about a decade of monitoring, should allow astronomers to determine the binary’s mass.

Source: ESO press release and a brief interview with lead author Michael Liu. See also the paper by Liu et al., “CFBDSIR J1458+1013B: A Very Cold (>T10) Brown Dwarf in a Binary System.

Success! MESSENGER First Spacecraft to Orbit Mercury

Artist's concept of MESSENGER in orbit around Mercury. Courtesy of NASA

[/caption]

After more than a dozen laps through the inner solar system, NASA’s MESSENGER spacecraft appears to have moved into orbit around Mercury tonight. Although Mariner in the 1970s and MESSENGER in the past several years have done flybys, MESSENGER is the first spacecraft to orbit the innermost planet in our solar system. NASA is stopping short of saying the spacecraft has achieved its planned orbit, but the clapping and hand-shaking in the control room looked highly optimistic.

“Preliminary results show that the burn went just as expected,” said a jubilant Ken Hibbard, an engineer at John Hopkins University’s Applied Physics Lab (APL), in a live report on NASA TV.

UPDATE, 9:50 p.m. EDT: NASA has abandoned all its cautionary language. MESSENGER is confirmed in orbit!

MESSENGER — which stands for MErcury Surface, Space ENvironment, GEochemistry and Ranging — launched Aug. 3, 2004 from Cape Canaveral. The orbit insertion places the spacecraft into a 12-hour orbit about Mercury with a 200 kilometer (124 mile) minimum altitude. The durable spacecraft is carrying seven science instruments and is fortified against the blistering environs near the sun.

The mission is an effort to study the geologic history, magnetic field, surface composition and other mysteries of the planet. The findings are expected to broaden our understanding of rocky planets, more and more of which are being discovered in other solar systems. One of the most compelling enigmas surrounds Mercury’s magnetic field. At a diameter only slightly larger than that of the moon (about 4,800 kilometers or 2,983 miles), Mercury should have solidified to the core. However, the presence of a magnetic field suggests to some researchers that the planet’s insides could be partially molten.

During its journey toward Mercury, MESSENGER passed the planet several times, filling in the imaging gaps left by Mariner 10. Now, the entire planet with the exception of about five percent has been observed. MESSENGER will focus its cameras on getting the best possible images of the remaining portions, mostly in the polar regions.

The MESSENGER mission is led by NASA, APL and the Carnegie Institution and includes a highly dedicated team of engineers, and many scientists.

“I’ve waited 36 years for this, and I’m about as excited as a person could get right now,” said Robert Strom, a MESSENGER team member from the University of Arizona’s Lunar and Planetary Lab.

Source: NASA’s MESSENGER mission website and NASA TV.

Titan’s Spring Showers Bring Torrents of Methane, Maintain ‘Dry’ Gullies

NASA’s Cassini spacecraft chronicles the change of seasons as it captures clouds concentrated near the equator of Saturn’s largest moon, Titan, on 18 October 2010. Credit: NASA/JPL/Space Science Institute

[/caption]

Titan’s skies dump methane rain on the bizarre moon a quarter of the year, which collects in northern methane lakes and maintains gullies and washes once presumed to have been sculpted in a wetter age.

Elizabeth Turtle from the Johns Hopkins University Applied Physics Laboratory (APL) is lead author on the new Science paper reporting that Cassini seems to have caught a storm in action last year: “We report the detection by Cassini’s Imaging Science Subsystem of a large low-latitude cloud system early in Titan’s northern spring and extensive surface changes,” write Turtle and her co-authors in the new paper, which appears today. “The changes are most consistent with widespread methane rainfall reaching the surface, which suggests that the dry channels observed at Titan’s low latitudes are carved by seasonal precipitation.”

While Saturn’s largest moon has methane lakes at high latitudes, its equatorial regions are mostly arid, with vast expanses of dunes. Researchers first observed dry, riverbed-like channels in these regions in Huygens probe images, but generally believed them to be remnants of a past wetter climate.

Turtle and her colleagues observed sudden decreases in the brightness of the surface near Titan’s equator after a cloud outburst. The authors consider several possible explanations for these changes, including wind storms and volcanism, but they conclude that rainfall from a large methane storm over the region is most likely responsible for the darkening they observed. The surface changes they noted after the storm spanned more than 500,000 square kilometers, about the size of California.

Simplified global atmospheric circulation and precipitation pattern on Titan and Earth. Most precipitation occurs at the intertropical convergence zone, or ITCZ, where air ascends as a result of convergence of surface winds from the northern and southern directions. Titan’s ITCZ was previously near the south pole (A) but is currently on its way to the north pole (B). The seasonal migration of the ITCZ on Earth is much smaller (C and D). Credit: P. Huey/Science © 2011 AAAS

In a related Perspectives piece, Tetsuya Tokan from the Universität zu Köln in Köln, Germany wrote that Titan’s precipitation climatology “is clearly different from that of Earth, and exotic climate zones unknown in Köppen’s classification may exist.” He was referring to a widely-used climate classification system coined by Wladimir Köppen in 1884.

Tokan writes that while Earth’s global circulation patterns concentrate precipitation in rainy belts along the equatorial regions, Titan’s “convergence zone” appears migrate north and south over time, distributing precipitation more equitably across the moon.

Source: “Rapid and Extensive Surface Changes Near Titan’s Equator: Evidence of April Showers,” by Elizabeth Turtle et al. and the related Perspectives piece, “Precipitation Climatology on Titan,” by Tetsuya Tokan. Both articles appear today in the journal Science.

NASA: Happy St. Paddy’s Day!

Collection of Ireland images, captured from the AIRS instrument onboard NASA's Aqua satellite on March 3. Credit: NASA JPL, Ed Olsen/ Henry Kline

[/caption]

With the luck o’ the Irish, NASA’s Aqua satellite was fortunate to capture mostly clear views of the Emerald Isle in these near-infrared/visible, infrared and microwave light views acquired by Aqua’s Atmospheric Infrared Sounder (AIRS) instrument. And with holiday flair, the agency has arranged the images into a clover and released them as a St. Paddy’s Day treat.

From the press release:

Ireland, located in the Atlantic Ocean, is the third-largest island in Europe, and originated the St. Patrick’s Day holiday. Located west of Great Britain and separated from it by the Irish Sea, it is surrounded by hundreds of islands and islets. In March, Ireland’s average daytime high temperature is near 9.4 degrees Celsius (49 degrees Fahrenheit) and its average nighttime low temperature is near 3.3 degrees Celsius (38 degrees Fahrenheit).

The AIRS instrument measures temperatures of land, sea and air to provide a better understanding of what is happening in those environments. The March 3 images reveal temperatures near the surface that were near normal for this time of year.

NASA’s Aqua satellite circles Earth pole-to-pole 15 times a day in a sun-synchronous orbit to provide data and images to researchers in Earth, ocean and atmospheric sciences. When Aqua passed over Ireland on March 3, it captured visible, infrared and microwave images: a clover of images from one instrument.

The false-color near-infrared/visible image revealed a mostly cloud-free country, except for the northernmost area, as a cold front approached from the west. Also visible were some of the navigable rivers that extend inland.

The visible image also showed areas over the North Sea, Spain and the French-Italian border region where the clouds were heavy enough to confine AIRS infrared data to the higher regions of the atmosphere above the cloud tops. Over the Pyrenees at the Spanish-French border and the Alps at the French-Italian border, the clouds were heavy enough (and contained some precipitation) so that the surface is not visible even using the microwave wavelength.

The infrared image showed that the clouds approaching Ireland from the west were low clouds associated with the cold front moving east. There were no areas of high, cold clouds that would indicate convection and the possibility of thunderstorms. “The brightness temperature of the island is approximately 283 Kelvin, which amounts to 10 degrees Celsius or 50 degrees Fahrenheit,” said Ed Olsen of NASA’s Jet Propulsion Laboratory in Pasadena, Calif. Olsen provides images for the AIRS instrument. “This brightness temperature is a combination of the temperature of the near-surface air temperature and the (land) surface temperature. This is close to the ambient temperature that the population there experienced outdoors.”

The microwave brightness temperature is a bit colder than the infrared temperature data, approximately 273 Kelvin, which is just at the freezing point for water (0 degrees Celsius/32 degrees Fahrenheit). Olsen noted, “The major component of the 89 gigahertz radiances is due to emissions from the surface to about a centimeter below the surface.” He said the temperature of the ground just below the (land surface) that is warmed by the sun is colder–after all, it is still winter in Ireland.

AIRS infrared data can measure cold, high cloud tops in thunderstorms and tropical cyclones, warm or cold ocean waters and land surfaces. Cloud top temperatures, for example, provide clues to scientists about the power of the thunderstorms. The colder the clouds are, the higher they are, and the more powerful the thunderstorms. When AIRS measures cloud temperatures as cold as or colder than minus 52 degrees Celsius (minus 63 degrees Fahrenheit), that indicates high cloud tops, strong convection and the likelihood of powerful thunderstorms.

Data from the Advanced Microwave Sounding Unit (AMSU), another of the AIRS suite of instruments on Aqua, are used to create microwave images. Cold areas in AMSU images can indicate where there is precipitation or ice in cloud tops.

Every day, NASA’s Aqua satellite looks at conditions around the globe, just like looking over a clover (in this case, a three-leafed or imaged one) that it looked at before.

Source: NASA release, via Eurekalert