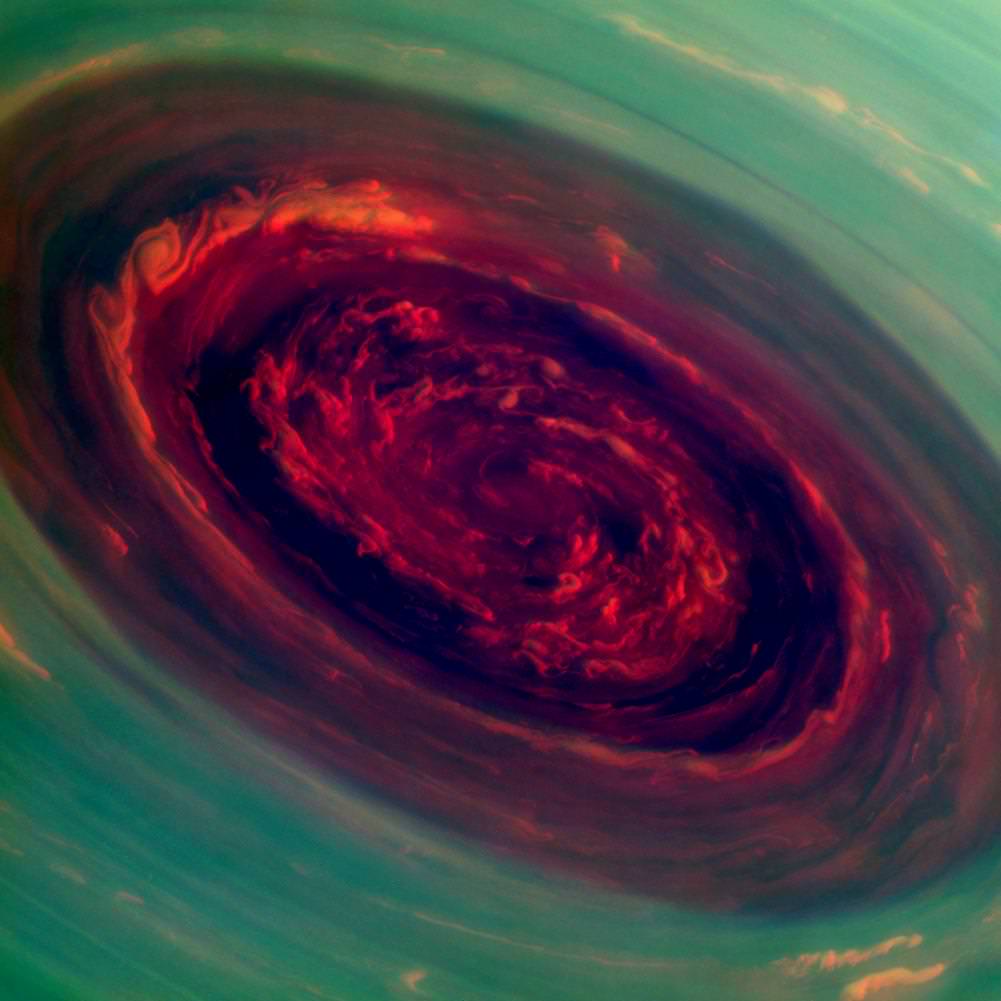
A false-color image, taken by the Cassini spacecraft, of a huge hurricane at Saturn's north pole. Credit: NASA/JPL-Caltech/SSI
Checking out the above pictures of a Saturn hurricane, one can’t help but wonder: how close was the Cassini spacecraft to spiralling down into gassy nothingness?
These dizzying images of a hurricane on Saturn, of course, came as the spacecraft zoomed overhead at a safe distance. NASA’s goal in examining this huge hurricane is to figure out its mechanisms and to compare it to what happens on our home planet.
Hurricanes on Earth munch on water vapor to keep spinning. On Saturn, there’s no vast pool of water to draw from, but there’s still enough water vapor in the clouds to help scientists understand more about how hurricanes on Earth begin, and continue.
“We did a double take when we saw this vortex because it looks so much like a hurricane on Earth,” stated Andrew Ingersoll, a Cassini imaging team member at the California Institute of Technology in Pasadena. “But there it is at Saturn, on a much larger scale, and it is somehow getting by on the small amounts of water vapor in Saturn’s hydrogen atmosphere.”
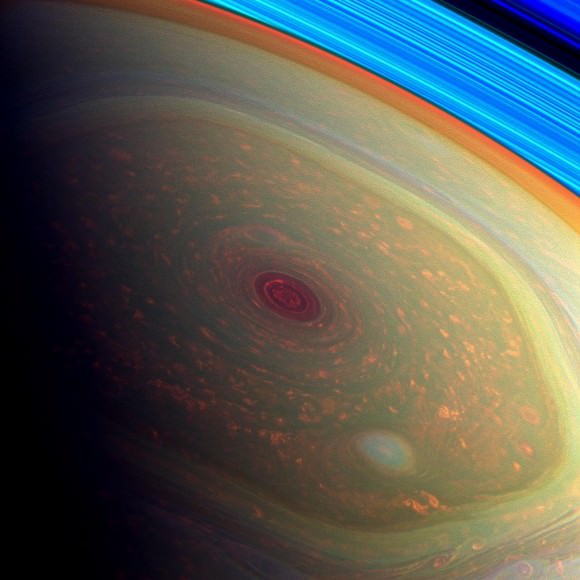
A false-color view of Saturn’s storm, as seen through Cassini’s wide-angle camera. You can see the eye in dark red, the jet stream in yellowish-green, and low-lying clouds in orange. The blue bands at the edge are Saturn’s rings. Credit: NASA/JPL-Caltech/SSI
There’s one big change in hurricane activity you’d observe if suddenly shifted from Earth to Saturn: this behemoth — 1,250 miles (2,000 kilometers) wide, about 20 times its Earthly counterparts — spins a heckuva lot faster.
In the eye, winds in the wall speed more than four times faster than what you’d find on Earth. The hurricane also sticks around at the north pole. On Earth, hurricanes head north (and eventually dissipate) due to wind forces generated by the planet’s rotation.
“The polar hurricane has nowhere else to go, and that’s likely why it’s stuck at the pole,” stated Kunio Sayanagi, a Cassini imaging team associate at Hampton University in Hampton, Va.
Cassini initially spotted the storm in 2004 through its heat-seeking infrared camera, when the north pole was shrouded in darkness during winter.
The spacecraft first caught the storm in visible light in 2009, when NASA controllers altered Cassini’s orbit so that it could view the poles.
Saturn, of course, is not the only gas giant in the solar system with massive hurricanes. Jupiter’s Great Red Spot has been raging since before humans first spotted it in the 1600s. It appears to be shrinking, and could become circular by 2040.
Neptune also has hurricanes that can reach speeds of 1,300 miles (2,100 kilometers) an hour despite its cold nature; it even had a Great Dark Spot spotted during Voyager’s flypast in 1989 that later faded from view. Uranus, which scientists previously believed was quiet, is a pretty stormy place as well.
Check out this YouTube video for more details on how Saturn’s storm works.
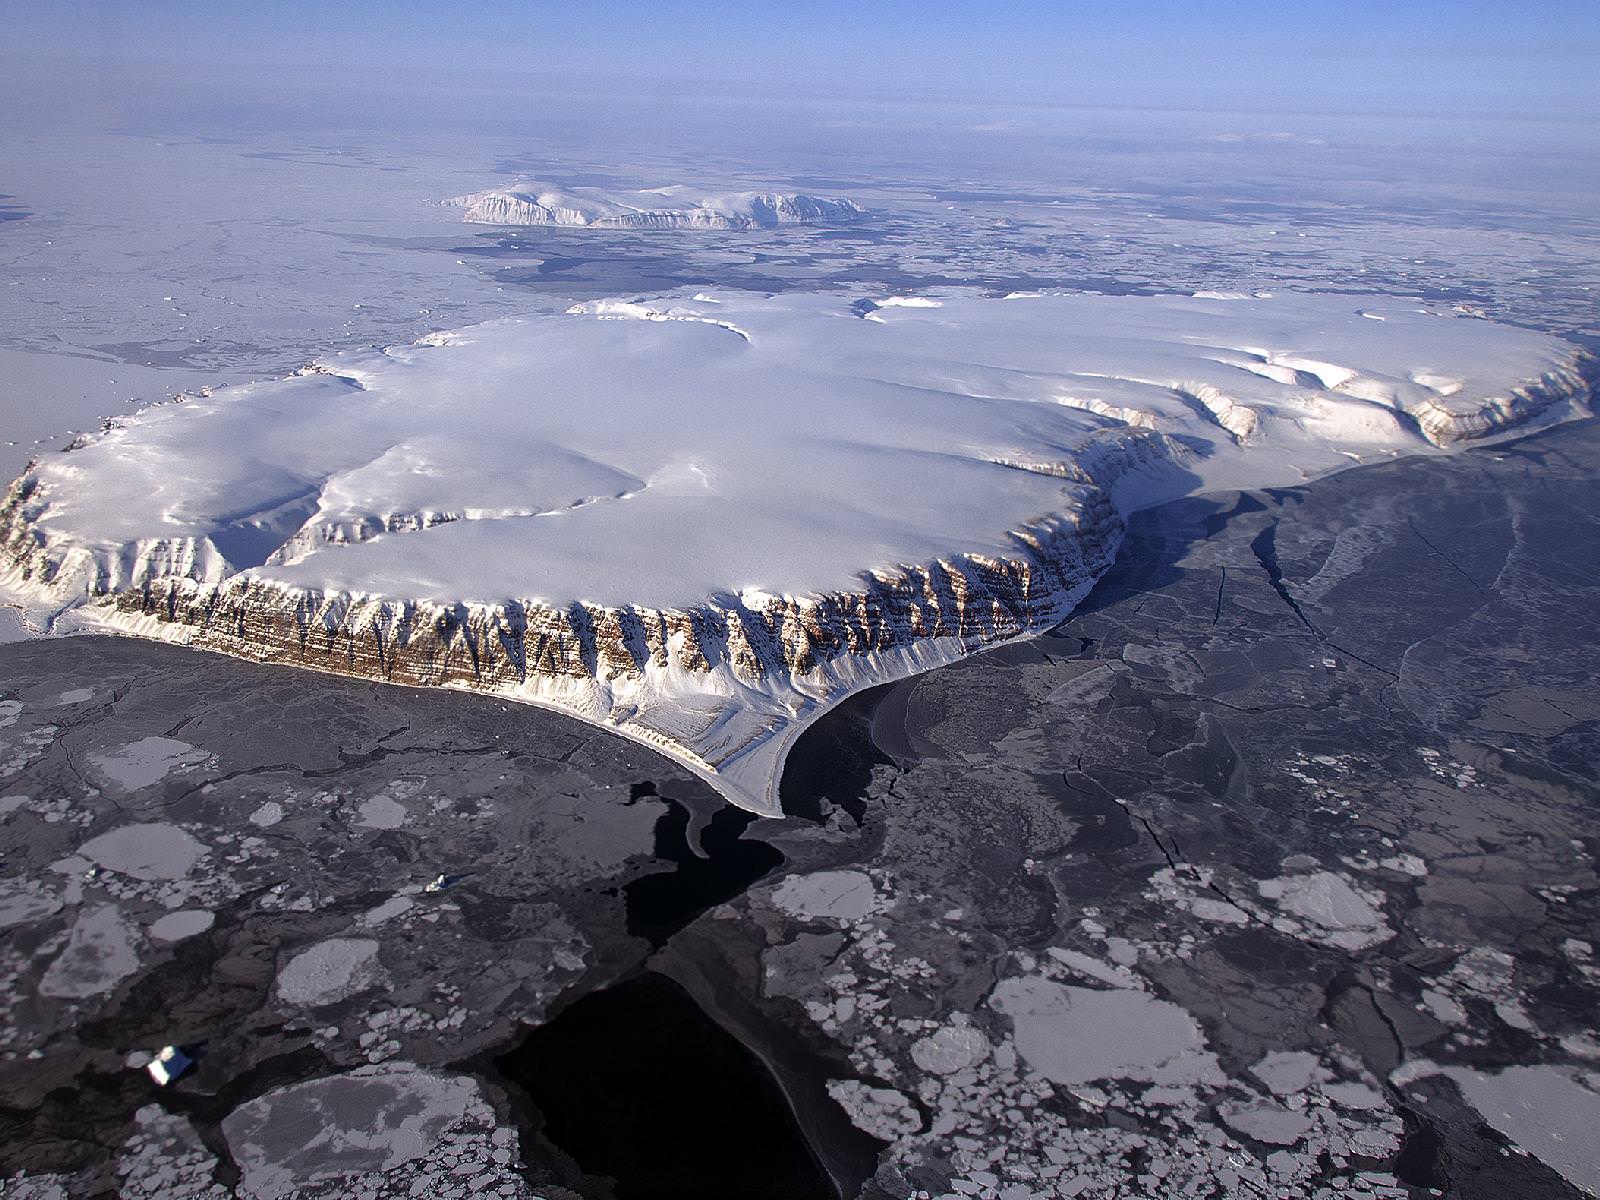
Saunders Island and Wolstenholme Fjord with Kap Atholl in the background photographed during a NASA IceBridge flight. (NASA/Michael Studinger)
It’s quite a long way from Mars, but I can’t help but be reminded of the Red Planet’s ice-covered north pole when looking at this photo taken by Michael Studinger earlier this month, during a recent IceBridge survey flight over Greenland.
Called Saunders Island (also Appat Island) the 82-square-mile frozen slab of rock rises from the sea off the coast of northwestern Greenland, one of many islands within the Wolstenholme (Uummannaq) Fjord on the shore of Baffin Bay. Operation IceBridge, a six-year aerial survey of the changing ice coverage at our planet’s poles, is run by NASA to provide valuable ground-level information to supplement satellite data.
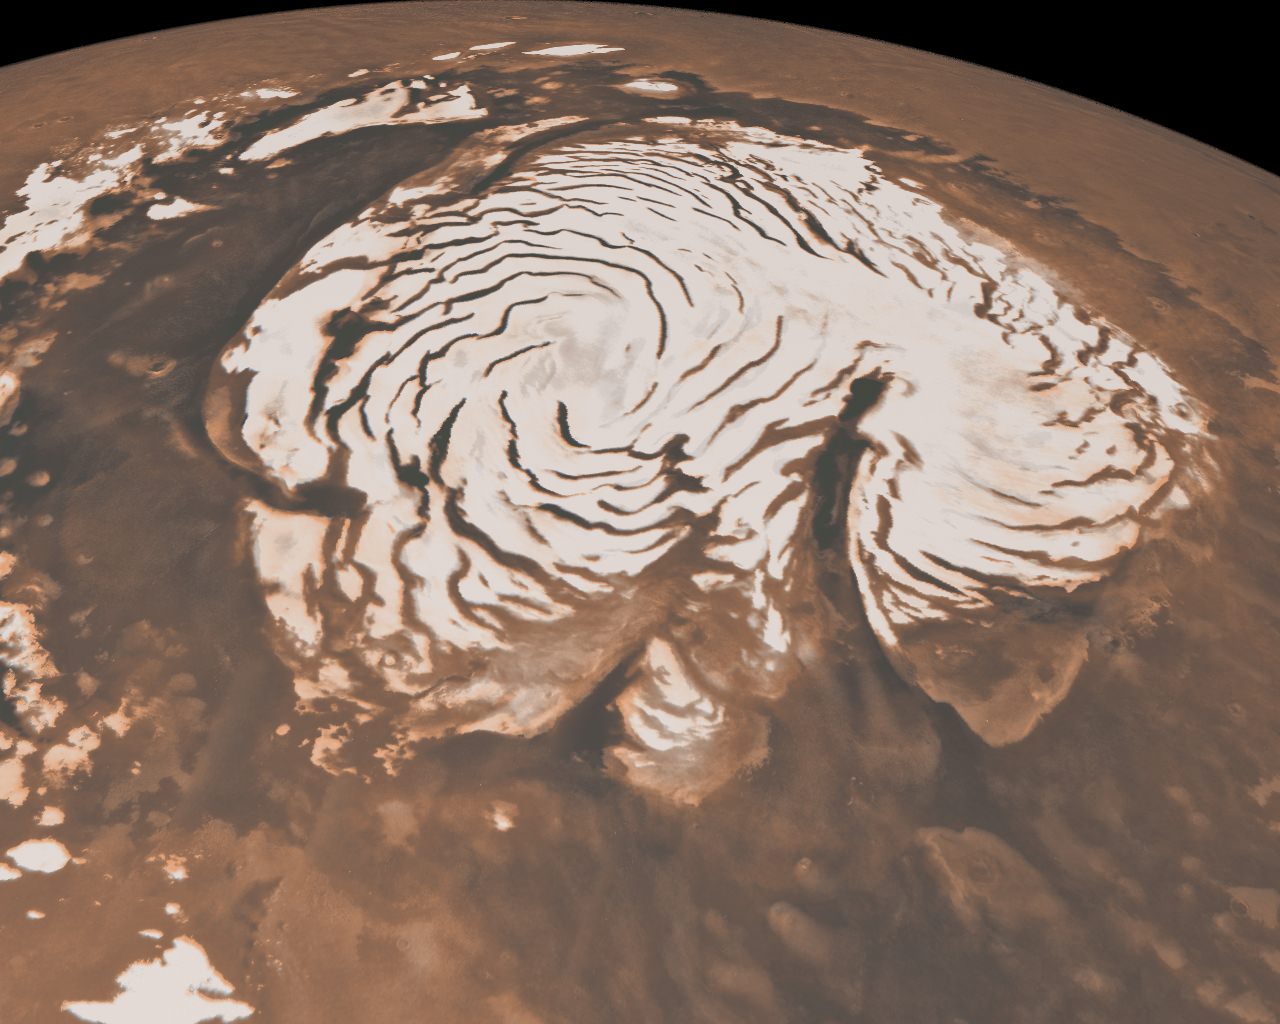
To me, the shape of the island’s steep rock faces and rugged inlets slice into its interior bear a striking resemblance to Mars’ ice cap.
Mars’ north polar ice cap
While Mars’ ice cap is shaped by very different processes — and obviously much bigger — you might see the connection too!
But rather than dark Martian dunes, sea ice can be seen surrounding the islands in varying thicknesses in the IceBridge photo above. Sea ice coverage in the fjord ranges from thicker, white ice in the background to thinner “grease” ice and leads with dark, open ocean water in the foreground.
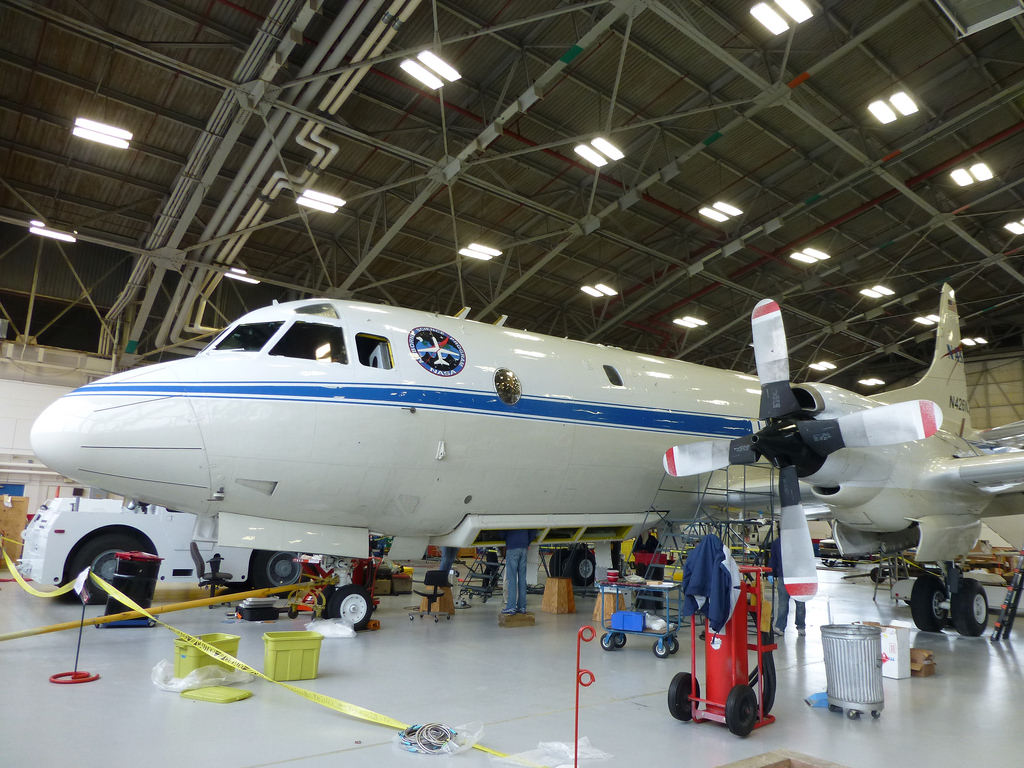
The IceBridge P-3B airborne laboratory in a hangar at Wallops Flight Facility (NASA/George Hale)
As the amount of darker, ice-free water surfaces increase over the course of the year due to rising global temperatures, the more heat from solar radiation is collected in the ocean — thus speeding up the process of seasonal sea ice loss and overall Arctic warming.
Read more about the IceBridge mission here, and see a collection of more photos from this season’s flights here.
NASA’s Operation IceBridge images Earth’s polar ice in unprecedented detail to better understand processes that connect the polar regions with the global climate system. IceBridge utilizes a highly specialized fleet of research aircraft and the most sophisticated suite of innovative science instruments ever assembled to characterize annual changes in thickness of sea ice, glaciers, and ice sheets. In addition, IceBridge collects critical data used to predict the response of earth’s polar ice to climate change and resulting sea-level rise.
'A glance out the Space Station window is worth taking,' said ISS commander Chris Hadfield, of this image taken on Earth Day, April 22, 2013. Credit: NASA/CSA.
After Canadian astronaut Chris Hadfield arrived at the International Space Station in December 2012, he quickly became an internet sensation with all the tweets, Facebook and G+ posts he shared providing in inside look at living and working in space. But the biggest draw is all the incredible images he has shared throughout his ISS mission. In this video, Hadfield takes you to the best seat in the house – the Cupola on the ISS — to gaze at the visual splendor of the Earth. He shares his techniques and his passion for capturing the fleeting glimpses of our changing world.
UPDATE: NASA also chimed in for Earth Day with this video from astronaut Don Pettit sharing his images and tips for photography of Earth from space:
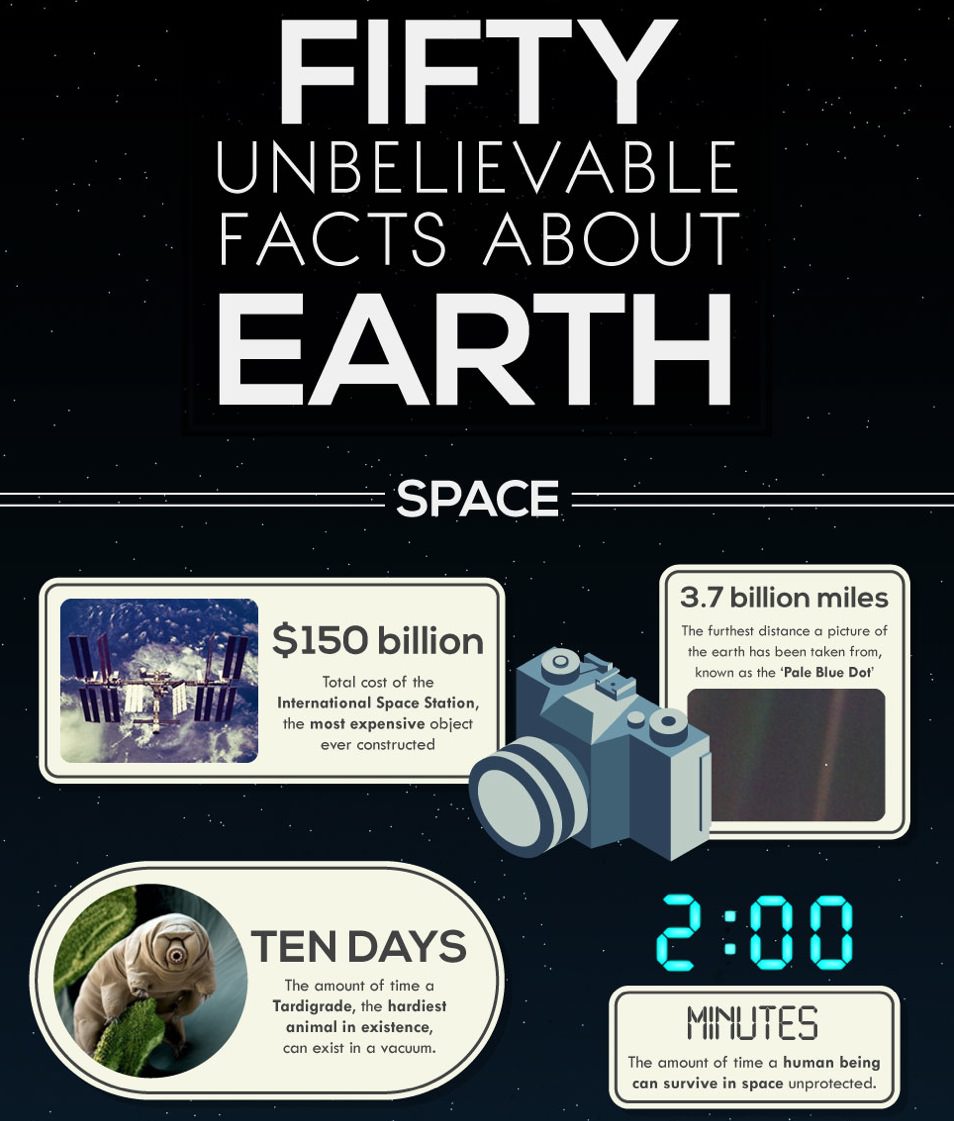
Do you know how much material falls onto Earth from space every day? How many different species there are in the ocean? How far the continents move every year? In honor of Earth Day here’s a very cool infographic that answers those questions about our planet — and 47 more!
Check out the full version below:
And for more interesting information about our planet, click here and here.
While no elements have been found in space that aren't also present on Earth, there are chemical compounds that are unique to other planets, meteorites and found in the space between the stars. Credit: NASA
I’m often asked by students in my community education astronomy classes whether any new elements have been found in outer space unknown on Earth. The answer to the question is no – nature uses the same 98 natural elements to fashion everything from the familiar stars and planets to those in the farthest galaxies we can see. Outside of an occasional compound or mineral, Earth is the place where you’ll find more exotic elements than anywhere else in the universe.
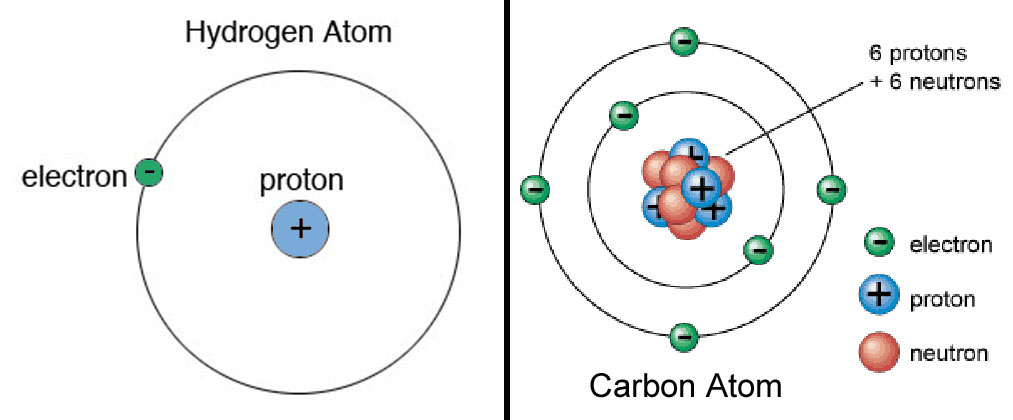
An element is a pure substance made of just one type of atom. What sets one element apart from another is the number of protons in the nuclei of its atoms. Any atom with six protons will always be carbon, 79 protons gold, 94 protons plutonium and 1 proton hydrogen. The proton number is also the element’s atomic number on the periodic table of elements. Elements in the table are arranged according to their atomic number.
Atoms are made of protons, neutrons and orbiting electrons. The number of protons in atom’s nucleus makes it unique from all the others. Hydrogen, the simplest element, has one; carbon has six.
The two most common elements are hydrogen and helium, numbers 1 and 2 in the periodic table; together they make up 98% of all the visible matter in the universe. The remaining 2% includes everything else from lightweight lithium (number 3) all the way up to californium (98), the heaviest natural element found on Earth and in the stars. Californium is unstable and “decays” into simpler elements. Although scientists make it in the lab by bombarding berkelium (97) with neutrons, trace amounts of this very rare element are found naturally in rich uranium deposits.
When I was in high school studying chemistry, the periodic table of elements ended at Lawrencium (103). At present there are 118 elements, the most recent one created in the lab being ununoctium (you-nah-NOC-tee-um). Matter of fact, all the elements beyond 98 are artificial, brought to life in nuclear reactors or in particle accelerator experiments. They live very short lives. With so many positively-charged protons pushing against one another in their nuclei, these elements quickly break apart into simpler ones in a process called radioactive decay.
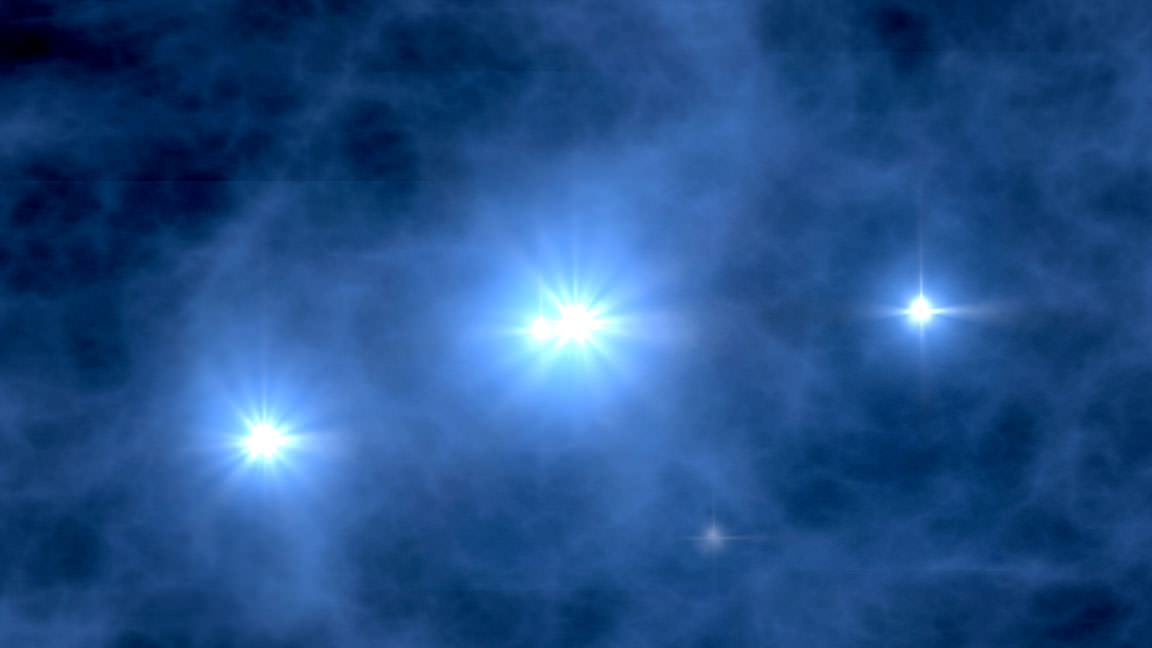
Artist’s concept of the first stars in the Universe turning on some 200 million years after the Big Bang. These first suns were made of almost pure hydrogen and helium. They and later generations cooked up heavier elements that were later incorporated into the sun and us. Credit: NASA/WMAP Science Team
Back at the time of the Big Bang, when the universe sprang into existence, only the simplest elements – hydrogen, helium and trace amounts of lithium – were cooked up. You can’t build a planet from such fluffy stuff. It took the first generation of stars, which formed from these basic building blocks, to synthesize more complicated elements like carbon, oxygen, sulfur and the like via nuclear fusion in their cores.
When the stars exploded as supernovae, not only were these brand new elements blasted into space, but the enormous heat and pressure during the blast built even heavier elements like gold, copper, mercury and lead. All became incorporated in a second generation of stars. And a third.
The 2% of star-made elements, which include carbon, oxygen, nitrogen and silicon among others, went to build the planets and later became essential for life. We’re made of highly processed material you and I. The atoms of our beings have been in and out of the cores of several generations of stars. Think about this good and hard and you might just get in touch with your own “inner star”.
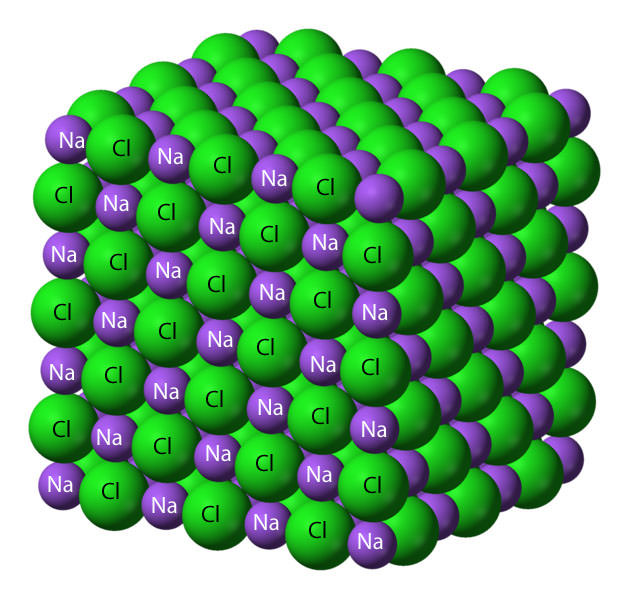
Common table salt is formed of tight-fitting atoms of sodium and chlorine. Each elements has its own individual character – one’s a flammable metal (sodium), the other a dangerous gas. Put them together and out comes a safe, tasty seasoning. Credit: Wikipedia
Let’s reframe the question about exotic materials in space not present on Earth. Instead of elements, if we look at compounds, we hit paydirt. A compound is also a pure substance but consists of two or more chemical elements joined together. Familiar compounds include water (two hydrogens joined to one oxygen) and salt (one sodium and one chlorine).
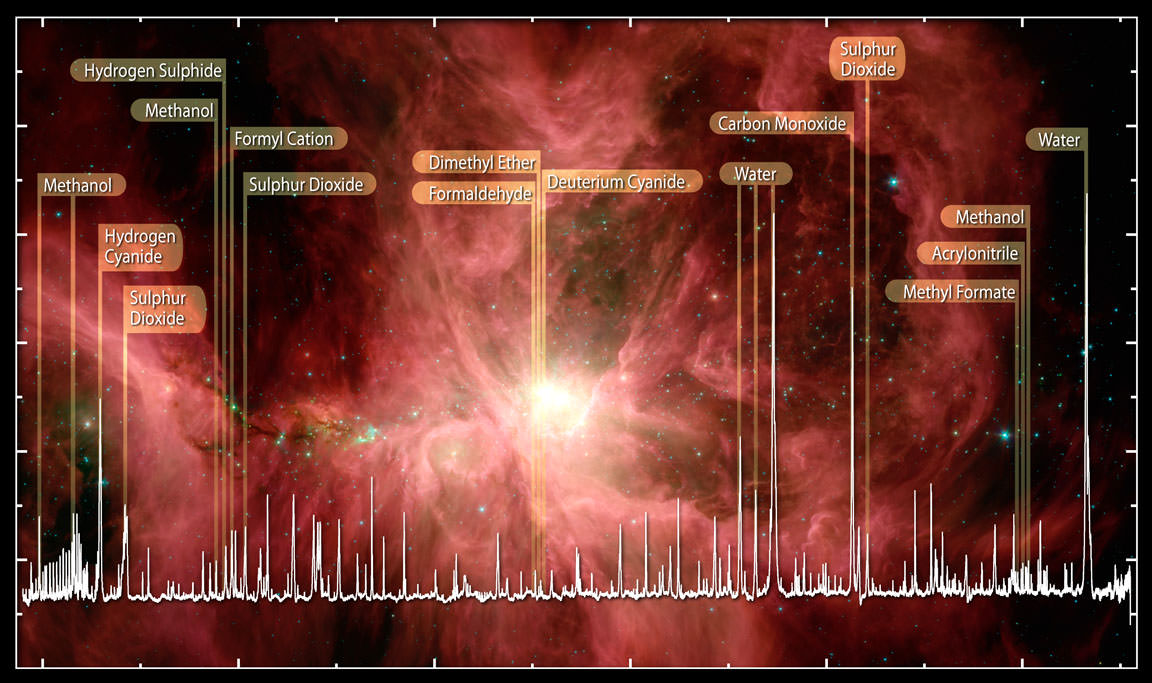
A selection of molecules (chemical compounds) including water found in the Orion Nebula detected by the Herschel Space Telescope. Credit: ESA, HEXOS and the HIFI Consortium E. Bergin
Astronomers have found about 220 compounds or molecules in outer space many of them with siblings on Earth but some alien. We don’t have to look far to find them since a few have been delivered right to our doorstep as rocky packages called meteorites. Here’s a short list of new minerals that formed within asteroids (where meteorites originate) under conditions very different from those found on Earth:
* Barringerite – a metallic compound made of iron, nickel and phosphorus
* Oldhamite – brown mineral made of calcium, magnesium and sulfur
* Kosmochlor – green mineral containing calcium, chromium, silicon and oxygen
How about new stuff on planets and comets? Astronomers have discovered compounds in the atmospheres of the giant planets Jupiter, Saturn, Uranus and Neptune like silane (silicon-hydrogen), arsine (arsenic-hydrogen) and phosphine (phosphorus-hydrogen) that don’t exist naturally on Earth. Humans have created all three in the lab and put them to good use in various industries including the manufacture of semi-conductors.
Helium, the gas that floats our balloons, was first discovered in the spectrum of the sun by French astronomer Pierre Janssen in during a solar eclipse in 1868. Scientists finally found it on Earth in 1895. Click to learn the helium story. Credit: Bob King
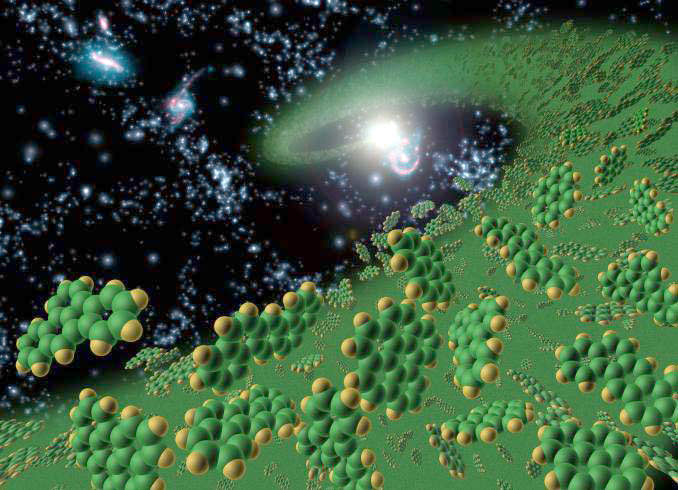
And then there’s Brownleeite, a manganese silicide found in 2003 in a dust particle shed by comet 26P/Grigg-Skjellerup. Moving beyond the solar system, astronomers see unusual long-chained carbon molecules in space that couldn’t form on Earth because oxygen would tear them apart. Space is their safe haven.
So, Earth is the location in the Universe where you’ll find more exotic elements than anywhere else. Thanks to human activity and the complicated molecules that wound together to form life, Earth’s the most exotic place in the universe.
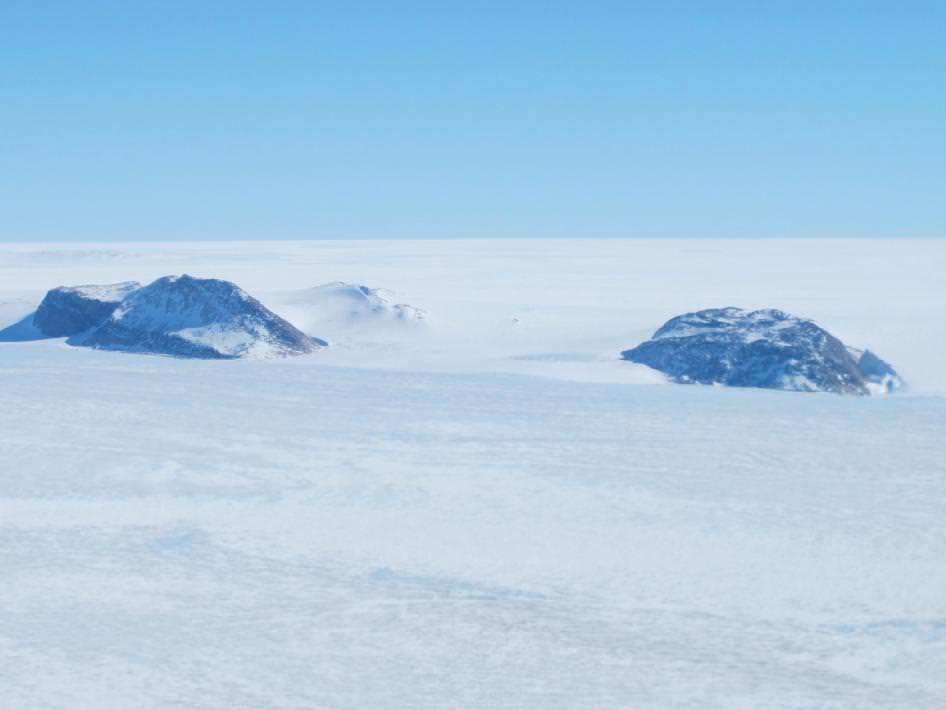
Nunataks in the western portion of the Greenland ice sheet seen from the NASA P-3B during an IceBridge survey of southwestern Greenland on Apr. 8, 2013. Nunataks are areas of exposed rock in an ice sheet such as ridges or mountain peaks. These jagged rock formations are sometimes used as landmarks on an ice sheet. Credit: NASA / Jim Yungel.
Here’s a view you don’t often see: Greenland’s glaciers from 500 meters above the ice. But this new video from NASA’s Operation IceBridge — recorded on April 9, 2013 — shows areas of southeast Greenland using a cockpit camera, revealing what the pilots see as they fly NASA’s P-3B airborne laboratory low over the Arctic. Following a glacier’s sometimes winding flow line gives IceBridge researchers a perspective on the ice not possible from satellites which pass in straight lines overhead. By gathering such data, IceBridge is helping to build a continuous record of change in the polar regions.
The plane allows researchers to images Earth’s polar ice in unprecedented detail to better understand processes that connect the polar regions with the global climate system. IceBridge utilizes a highly specialized fleet of research aircraft and the most sophisticated suite of innovative science instruments ever assembled to characterize annual changes in thickness of sea ice, glaciers, and ice sheets. In addition, IceBridge collects critical data used to predict the response of earth’s polar ice to climate change and resulting sea-level rise. IceBridge also helps bridge the gap in polar observations between NASA’s ICESat satellite missions.
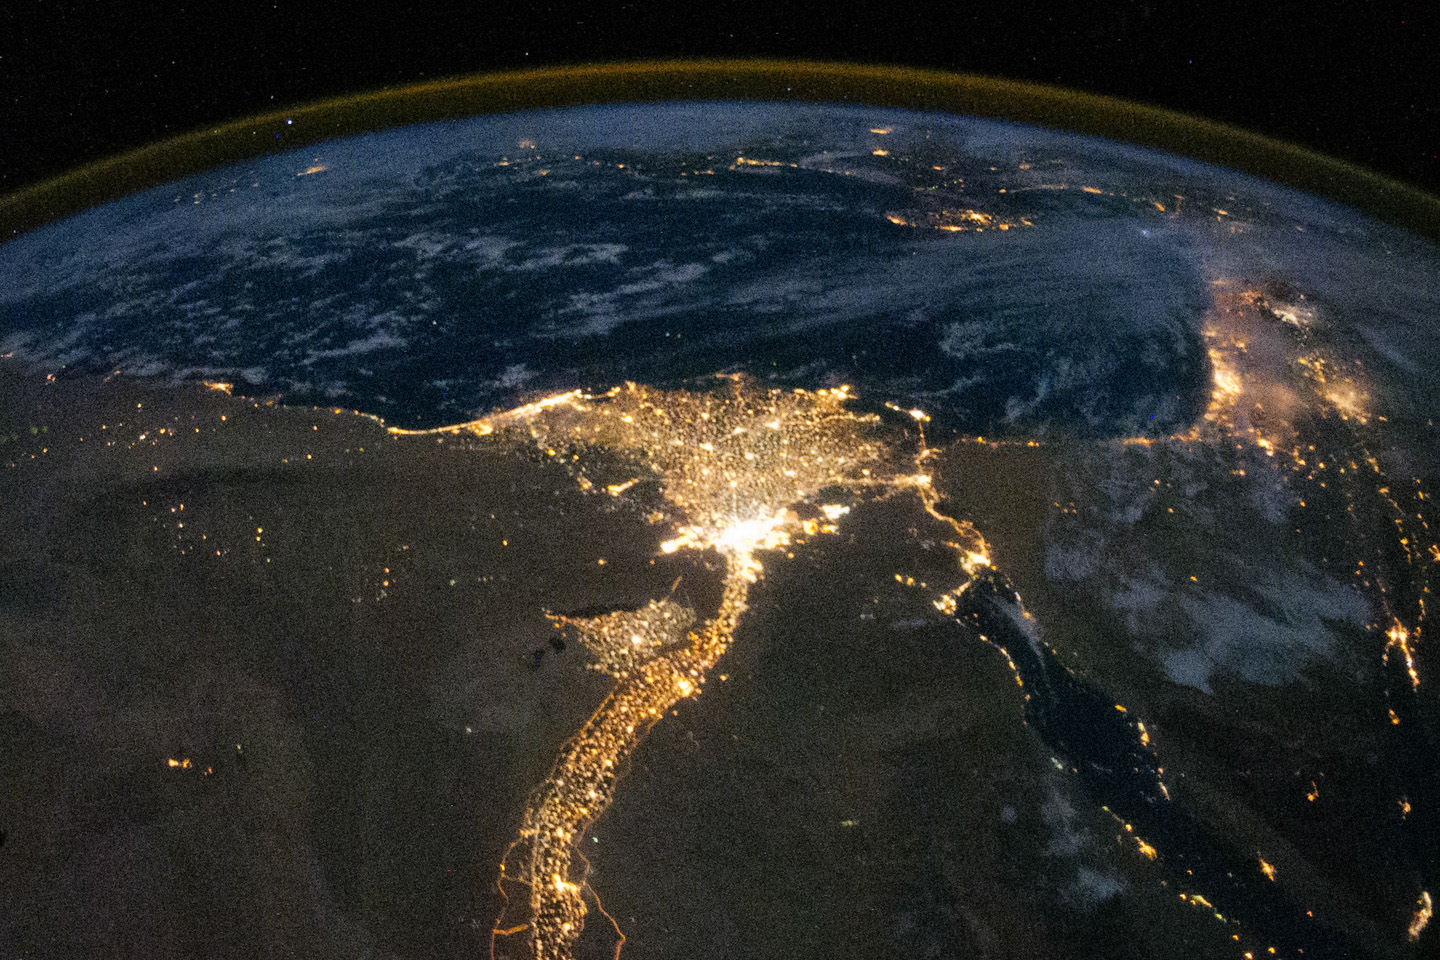
Nighttime photo of the Nile delta region taken from the ISS (NASA)
Enjoy some great views of our home planet from images taken from the orbiting Earth-observing satellites and taken by astronauts on the International Space Station. The satellites and scientists are cranking out data 24/7 to help us all better understand and sustain our home planet.
Above is a video created for Earth Month, and specifically Earth Day (April 22) from ISS imagery, and below is another video from satellite imagery. These are unique looks at the beauty and wonder of our home planet.
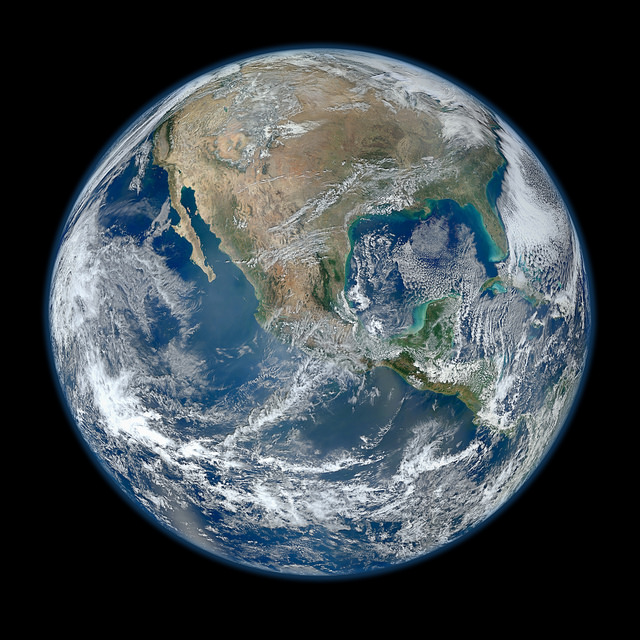
A 'Blue Marble' image of the Earth taken from the VIIRS instrument aboard NASA's most recently launched Earth-observing satellite - Suomi NPP. This composite image uses a number of swaths of the Earth's surface taken on January 4, 2012. Credit: NASA/NOAA/GSFC/Suomi NPP/VIIRS/Norman Kuring.
This video compilation from the Goddard Space Flight Center takes a look back at the best views of our planet from space in the last year, including true color satellite images, Earth science data visualizations, time lapses from the International Space Station, and computer models.
Ice sheet loss increasing at both poles. Image credit: Ian Joughin, University of Washington.
In honor of Earth month, NASA has launched a beautiful new interactive image gallery that explores and highlights our latest understanding of Earth science and our changing planet. Included are spectacular images and visualizations to help understand the latest findings.
Included is information on the decline of sea ice in the Arctic, a visualization of global aerosols, images of the latest storms, and much more.
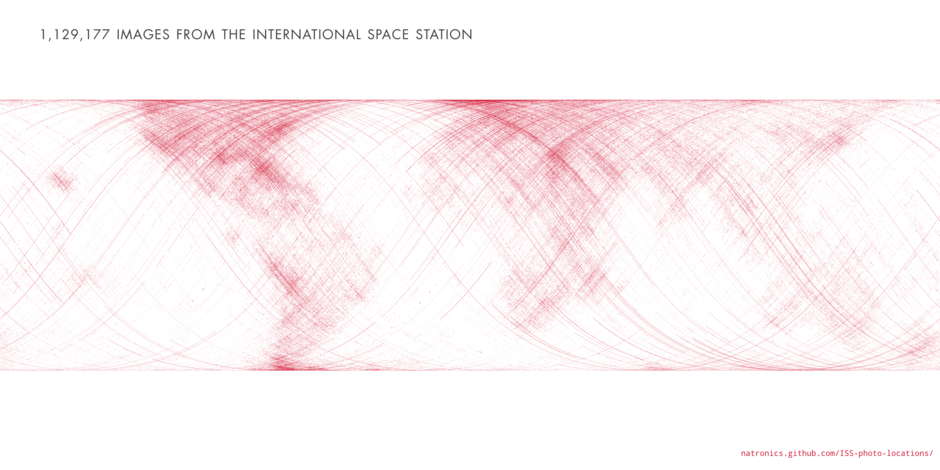
A map of the world made up of the locations of ISS astronaut photos (Nathan Bergey/open.nasa.gov)
If you could spend a few months — or even a few days — living aboard the ISS, what would you take pictures of? Earth, most likely, with your favorite landforms and your family’s and friends’ hometowns ranking high on the list. After a while, I’m sure plenty of other Earthly features would become photo targets — weather, aurorae, world cities at night, etc. — but ultimately, over the course of your stay in orbit, you would be able to see a trend in the pictures you take, and where you took them.
And over the span of 35 missions across more than 12 years, the graph above shows the trend of all the astronauts’ pictures. Look familiar?
Nighttime photo of the Nile delta region taken from the ISS (NASA)
Created by open-source NASA data aficionado Nate Bergey, the image above is a map made up of over a million points (1,129,177, to be exact) each representing the global coordinates of an JSC-archived photograph taken from the ISS.
Clearly the continents are astronauts’ favored photo subjects, with the populous urban areas of North America, Europe, Egypt and the Middle East, as well as the western and southern coasts of South America standing out.
“This makes sense, photos of clouds over an otherwise blank ocean get old after a while,” Nate Bergey wrote on his blog, open.nasa.gov. “I’m sure every astronaut has taken at least one photograph of the town they grew up in.”
Of course, the map doesn’t create an image of the entire globe. This is because the points denote actual over-ground coordinates of the Station (not necessarily what the photos themselves are of) and “the ISS stays between about 50° and -50° latitude as it orbits the Earth,” as noted by Bergey.
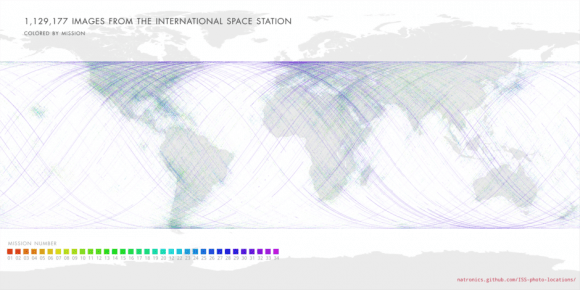
A map of the world with the points overlaid onto it, color-coded by mission, shows the difference:
Bergey also notes the proliferation of purple-colored dots… these indicate the hundreds of images taken by NASA astronaut Don Pettit during Expedition 30/31, when he created incredible time-lapse videos of the Earth from the ISS.
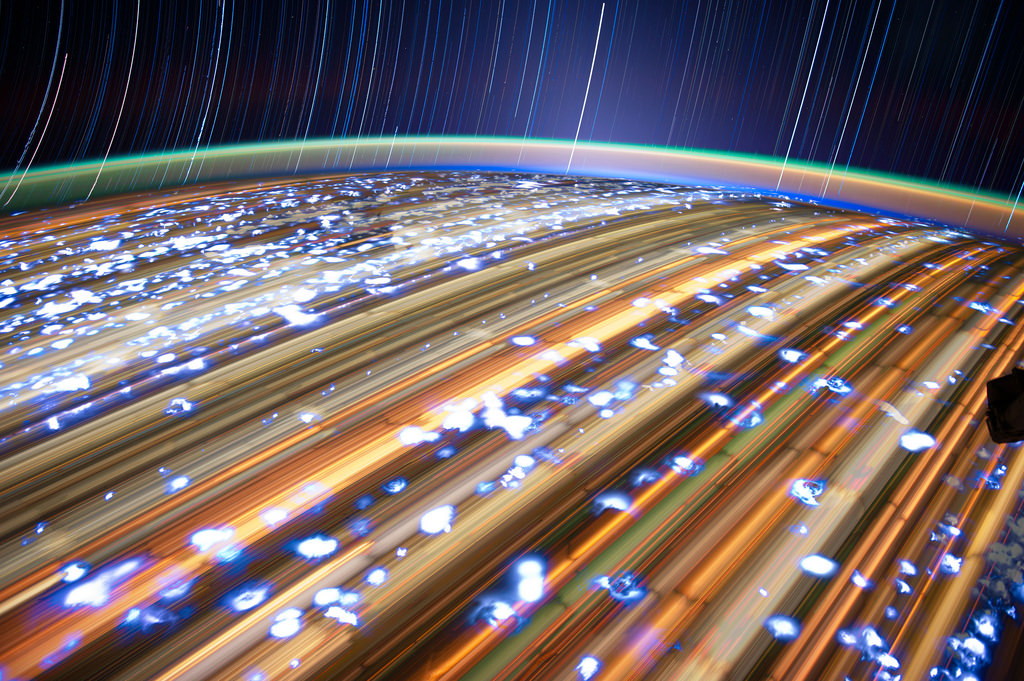
One of many long-exposure images taken by Don Pettit aboard the ISS (NASA/JSC). See more here.
With such a unique and lofty perspective of our world, it’s no wonder that astronauts spend so much time snapping photos — I can’t say I’d be able to tear myself away from the window myself! Read more about Nate Bergey’s project and how he created his map on his open.NASA blog here.