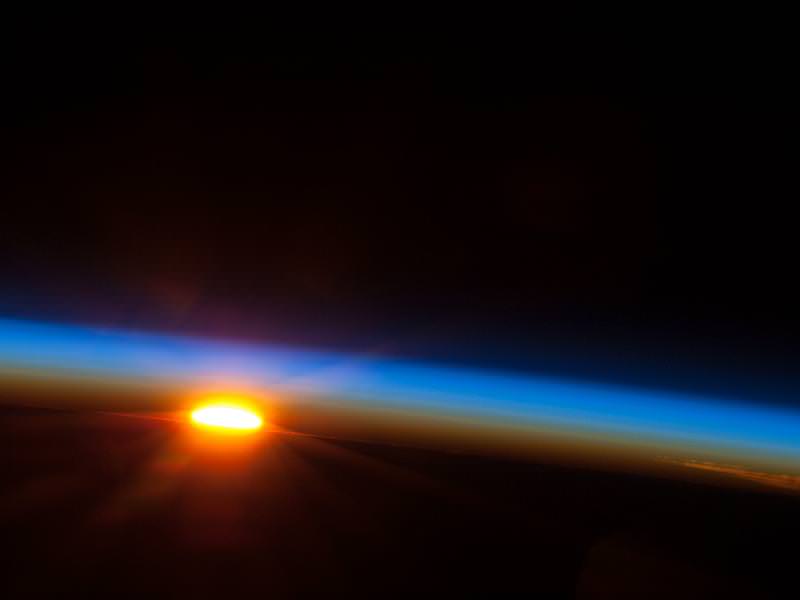
An orbital sunset puts Earth in a unique light, as seen from the International Space Station. Credit: NASA, via astronaut Karen Nyberg.
This is just a gorgeous shot of our home planet from the International Space Station, shared by astronaut Karen Nyberg via Twitter. While many pictures of Earth from space show a bright view of our planet, this view of the world plunging into darkness provides a unique, not-often-seen view. If a picture can be this beautiful, imagine what must look like in person.
Nyberg is sharing her experiences via Twitter and also — I believe she is the first astronaut sharing on Pinterest. She describes herself as “Aspiring quilter, crafter, artist” (perfect for the Pinterest crowd) in addition to being an astronaut by day, and said she hopes to do some crafting in space if she has any spare time. Nyberg has a special board for “Hair in Space” (which includes both bald pates and gravity defying hair,) hoping to inspire the younger generation of women to get interested in space exploration. “When girls see pictures of ponytails, don’t you think it stirs something inside them that says, that could be ME up there!” Nyberg writes.
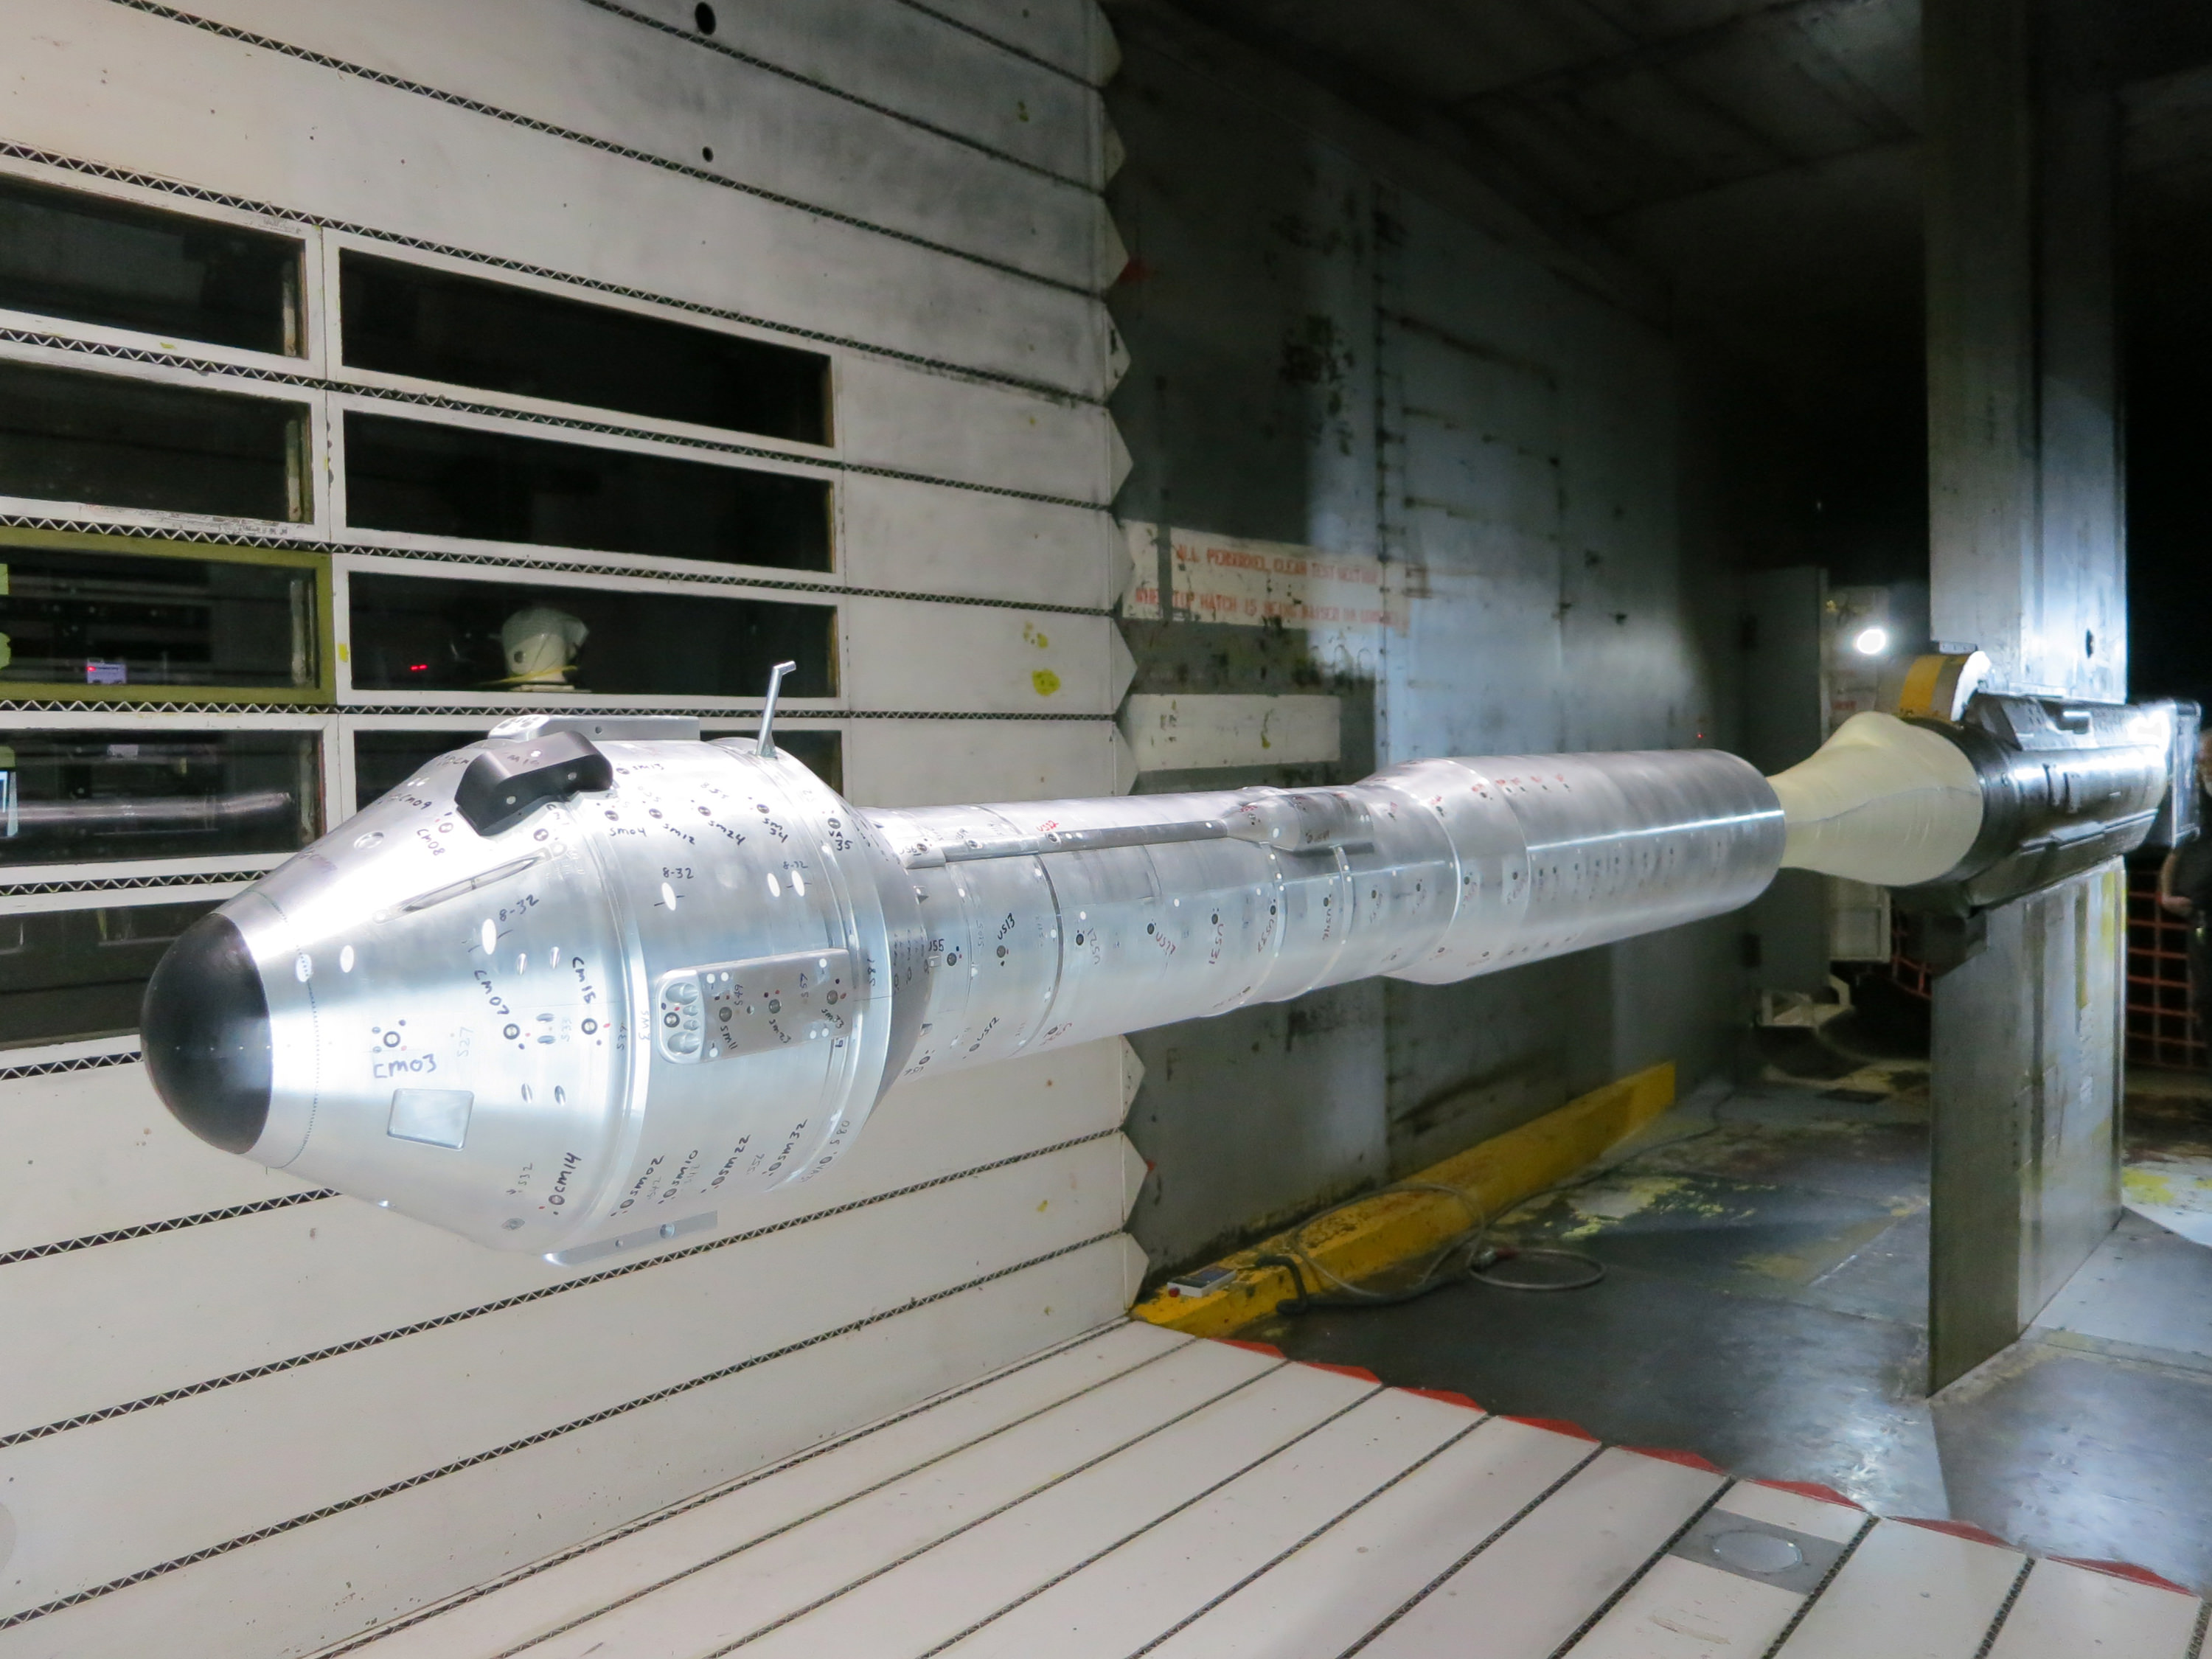
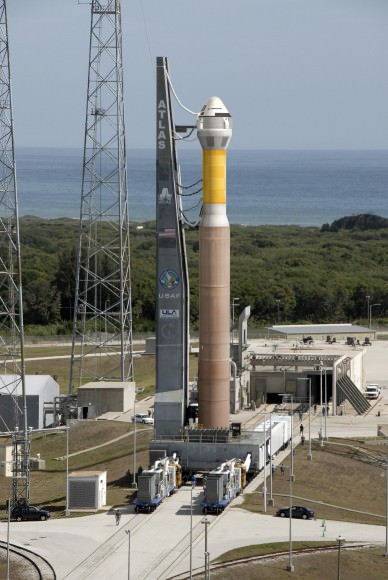
Shown is the integrated CST-100 crew capsule and Atlas V launcher model at NASA's Ames Research Center. The model is a 7 percent model of the Boeing CST-100 spacecraft, launch vehicle adaptor and launch vehicle. Credit: Boeing
The next time that American astronauts launch to space from American soil it will surely be aboard one of the new commercially built “space taxis” currently under development by a trio of American aerospace firms – Boeing, SpaceX and Sierra Nevada Corp – enabled by seed money from NASA’s Commercial Crew Program (CCP).
Boeing has moved considerably closer towards regaining America’s lost capability to launch humans to space when the firm’s privately built CST-100 crew capsule achieved two key new milestones on the path to blastoff from Florida’s Space Coast.
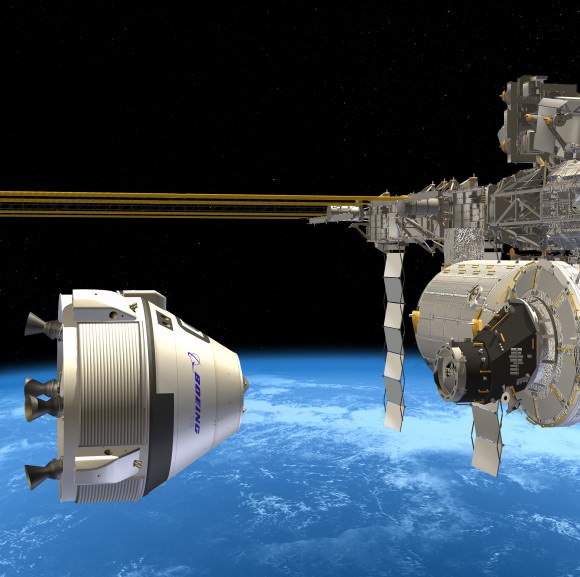
The CST-100 capsule is designed to carry a crew of up to 7 astronauts on missions to low-Earth orbit (LEO) and the International Space Station (ISS) around the middle of this decade.
Boeing CST-100 crew vehicle docks at the ISS. Credit: Boeing
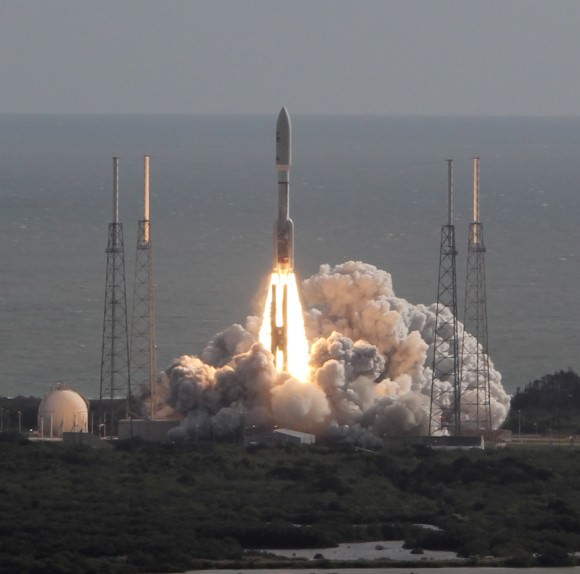
Boeing’s crew transporter will fly to space atop the venerable Atlas V rocket built by United Launch Alliance (ULA) from Launch Complex 41 on Cape Canaveral Air Force Station in Florida.
The Boeing and ULA teams recently completed the first wind tunnel tests of a 7 percent scale model of the integrated capsule and Atlas V rocket (photo above) as well as thrust tests of the modified Centaur upper stage.
The work is being done under the auspices of NASA’s Commercial Crew Integrated Capability (CCiCap) initiative, intended to make commercial human spaceflight services available for both US government and commercial customers, such as the proposed Bigelow Aerospace mini space station.
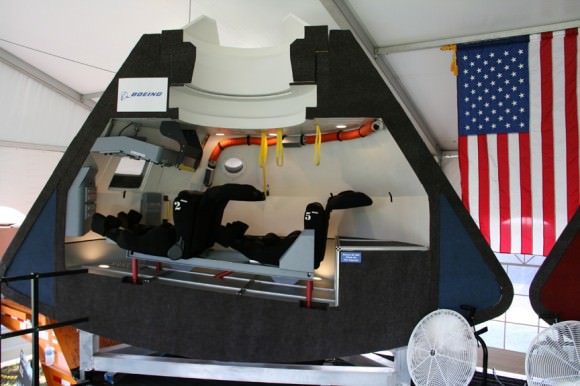
Boeing CST-100 capsule mock-up, interior view. Credit: Ken Kremer – kenkremer.com
Since its maiden liftoff in 2002, the ULA Atlas V rocket has flawlessly launched numerous multi-billion dollar NASA planetary science missions like the CuriosityMars rover, Juno Jupiter orbiter and New Horizons mission to Pluto as well as a plethora of top secret Air Force spy satellites.
But the two stage Atlas V has never before been used to launch humans to space – therefore necessitating rigorous testing and upgrades to qualify the entire vehicle and both stages to meet stringent human rating requirements.
“The Centaur has a long and storied past of launching the agency’s most successful spacecraft to other worlds,” said Ed Mango, NASA’s CCP manager at the agency’s Kennedy Space Center in Florida. “Because it has never been used for human spaceflight before, these tests are critical to ensuring a smooth and safe performance for the crew members who will be riding atop the human-rated Atlas V.”
The combined scale model CST-100 capsule and complete Atlas V rocket were evaluated for two months of testing this spring inside an 11- foot diameter transonic wind tunnel at NASA’s Ames Research Center in Moffett Field, Calif.
“The CST-100 and Atlas V, connected with the launch vehicle adaptor, performed exactly as expected and confirmed our expectations of how they will perform together in flight,” said John Mulholland, Boeing vice president and program manager for Commercial Programs.
Testing of the Centaur stage centered on characterizing the flow of liquid oxygen from the oxygen tank through the liquid oxygen-feed duct line into the pair of RL-10 engines where the propellant is mixed with liquid hydrogen and burned to create thrust to propel the CST-100 into orbit.
Boeing is aiming for an initial three day manned orbital test flight of the CST-100 during 2016, says Mulholland.
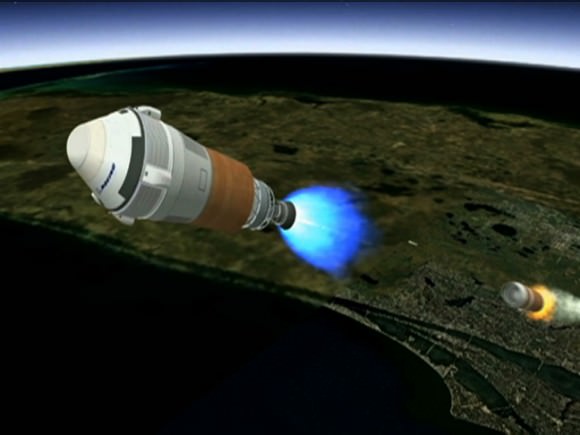
Artist’s concept shows Boeing’s CST-100 spacecraft separating from the first stage of its launch vehicle, a United Launch Alliance Atlas V rocket, following liftoff from Cape Canaveral Air Force Station in Florida. Credit: Boeing
But that date is dependent on funding from NASA and could easily be delayed by the ongoing sequester which has slashed NASA’s and all Federal budgets.
Chris Ferguson, the commander of the final shuttle flight (STS-135) by Atlantis, is leading Boeing’s flight test effort.
Boeing has leased one of NASA’s Orbiter Processing Facility hangers (OPF-3) at the Kennedy Space Center (KSC) for the manufacturing and assembly of its CST-100 spacecraft.
Mulholland told me previously that Boeing will ‘cut metal’ soon. “Our first piece of flight design hardware will be delivered to KSC and OPF-3 around mid 2013.”
NASA’s CCP program is fostering the development of the CST-100 as well as the SpaceX Dragon and Sierra Nevada Dream Chaser to replace the crew capability of NASA’s space shuttle orbiters.
The Atlas V will also serve as the launcher for the Sierra Nevada Dream Chaser space taxi.
Since the forced retirement of NASA’s shuttle fleet in 2011, US and partner astronauts have been 100% reliant on the Russians to hitch a ride to the ISS aboard the Soyuz capsules – at a price tag exceeding $60 Million per seat.
Simultaneously on a parallel track NASA is developing the Orion crew capsule and SLS heavy lift booster to send humans to the Moon and deep space destinations including Asteroids and Mars.
And don’t forget to “Send Your Name to Mars” aboard NASA’s MAVEN orbiter- details here. Deadline: July 1, 2013
…………….
Learn more about Conjunctions, Mars, Curiosity, Opportunity, MAVEN, LADEE and NASA missions at Ken’s upcoming lecture presentations:
June 4: “Send your Name to Mars” and “CIBER Astro Sat, LADEE Lunar & Antares ISS Rocket Launches from Virginia”; Rodeway Inn, Chincoteague, VA, 8:30 PM
NASA’s Curiosity Mars Science Laboratory (MSL) rover blasts off for Mars atop a stunningly beautiful Atlas V rocket on Nov. 26, 2011 at 10:02 a.m. EST from Cape Canaveral, Florida. United Launch Alliance (ULA) is now upgrading the Atlas V to launch humans aboard the Boeing CST-100 and Sierra Nevada Dream Chaser space taxis. Credit: Ken Kremer – kenkremer.comThe CST-100 spacecraft awaits liftoff aboard an Atlas V launch vehicle in this artist’s concept. Credit: Boeing
This article comes from the Universe Today archive, but was updated with this spiffy video.
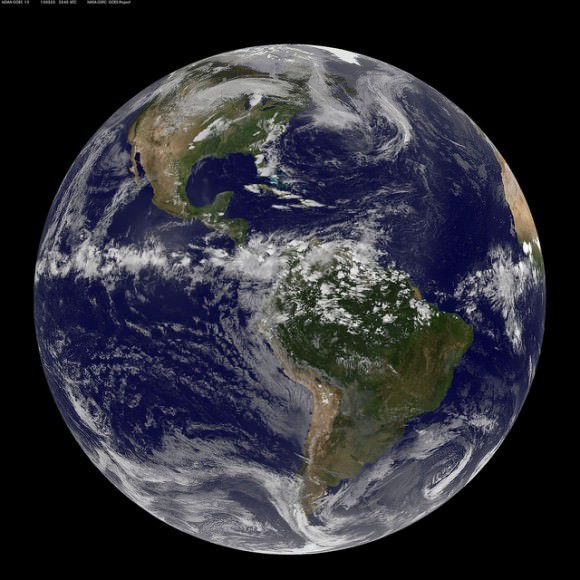
How old is the Earth? Scientists think that the Earth is 4.54 billion years old. Coincidentally, this is the same age as the rest of the planets in the Solar System, as well as the Sun. Of course, it’s not a coincidence; the Sun and the planets all formed together from a diffuse cloud of hydrogen billions of years ago.
In the early Solar System, all of the planets formed in the solar nebula; the remnants left over from the formation of the Sun. Small particles of dust collected together into larger and larger objects – pebbles, rocks, boulders, etc – until there were many planetoids in the Solar System. These planetoids collided together and eventually enough came together to become Earth-sized.
At some point in the early history of Earth, a planetoid the size of Mars crashed into our planet. The resulting collision sent debris into orbit that eventually became the Moon.
How do scientists know Earth is 4.54 billion years old? It’s actually difficult to tell from the surface of the planet alone, since plate tectonics constantly reshape its surface. Older parts of the surface slide under newer plates to be recycled in the Earth’s core. The oldest rocks ever found on Earth are 4.0 – 4.2 billion years old.
Scientists assume that all the material in the Solar System formed at the same time. Various chemicals, and specifically radioactive isotopes were formed together. Since they decay in a very known rate, these isotopes can be measured to determine how long the elements have existed. And by studying different meteorites from different locations in the Solar System, scientists know that the different planets all formed at the same time.
Failed Methods for Calculating the Age of the Earth
Our current, accurate method of measuring the age of the Earth comes at the end of a long series of estimates made through history. Clever scientists discovered features about the Earth and the Sun that change over time, and then calculated how old the planet Earth is from that. Unfortunately, they were all flawed for various reasons.
Declining Sea Levels – Benoit de Maillet, a French anthropologist who lived from 1656-1738 and guessed (incorrectly) that fossils at high elevations meant Earth was once covered by a large ocean. This ocean had taken 2 billion years to evaporate to current sea levels. Scientists abandoned this when they realized that sea levels naturally rise and fall.
Cooling of the Earth – William Thompson, later known as Lord Kelvin, assumed that the Earth was once a molten ball of rock with the same temperature of the Sun, and then has been cooling ever since. Based on these assumptions, Thompson calculated that the Earth took somewhere between 20 and 400 million years to cool to its current temperature. Of course, Thompson made several inaccurate assumptions, about the temperature of the Sun (it’s really 15 million degrees Kelvin at its core), the temperature of the Earth (with its molten core) and how the Sun is made of hydrogen and the Earth is made of rock and metal.
Cooling of the Sun – In 1856, the German physicist Hermann Ludwig Ferdinand von Helmholtz attempted to calculate the age of the Earth by the cooling of the Sun. He calculated that the Sun would have taken 22 million years to condense down to its current diameter and temperature from a diffuse cloud of gas and dust. Although this was inaccurate, Helmholtz correctly identified that the source of the Sun’s heat was driven by gravitational contraction.
Rock Erosion – In his book, The Origin of Species by Means of Natural Selection, Charles Darwin proposed that the erosion of chalk deposits might allow for a calculation of the minimum age of the planet. Darwin estimated that a chalk formation in the Weald region of England might have taken 300 million years to weather to its current form.
Orbit of the Moon – George Darwin, the son of Charles Darwin, guessed that the Moon might have been formed out of the Earth, and drifted out to its current location. The fission theory proposed that the Earth’s rapid rotation caused a chunk of the planet to spin off into space. Darwin calculated that it had taken the Moon at least 56 million years to reach its current distance from Earth. We now know the Moon was probably formed when a Mars-sized object smashed into the Earth billions of years ago.
Salinity of the Ocean – In 1715, the famous astronomer Edmund Halley proposed that the salinity of the oceans could be used to estimate the age of the planet. Halley observed that oceans and lakes fed by streams were constantly receiving more salt, which then stuck around as the water evaporated. Over time, the water would be come saltier and saltier, allowing an estimate of how long this process has been going on. Various geologists used this method to guess that the Earth was between 80 and 150 million years old. This method was flawed because scientists didn’t realize that geologic processes are extracting salt out of the water as well.
Radiometric Dating Provides an Accurate Method to Know the Age of the Earth
In 1896, the French chemist A. Henri Becquerel discovered radioactivity, the process where materials decay into other materials, releasing energy. Geologists realized that the interior of the Earth contained a large amount of radioactive material, and this would be throwing off their calculations for the age of the Earth. Although this discovery revealed flaws in the previous methods of calculating the age of the Earth, it provided a new method: radiometric dating.
Geologists discovered that radioactive materials decay into other elements at a very predictable rate. Some materials decay quickly, while others can take millions or even billions of years to fully decay. Ernest Rutherford and Frederick Soddy, working at McGill University, determined that half of any isotope of a radioactive element decays into another isotope at a set rate. For example, if you have a set amount of Thorium-232, half of it will decay over a billion years, and then half of that amount will decay in another billion years. This is the source of the term “half life”.
By measuring the half lives of radioactive isotopes, geologists were able to build a measurement ladder that let them accurately calculate the age of geologic formations, including the Earth. They used the decay of uranium into various isotopes of lead. By measuring the amount of three different isotopes of lead (Pb-206, Pb-207, and Pb-208 or Pb-204), geologists can calculate how much Uranium was originally in a sample of material.
If the Solar System formed from a common pool of matter, with uniformly distributed Pb isotopes, then all objects from that pool of matter should show similar amounts of the isotopes. Also, over time, the amounts of Pb-206 and Pb-207 will change because as these isotopes are end-products of uranium decay. This makes the amount of lead and uranium change. The higher the uranium-to-lead ratio of a rock, the more the Pb-206/Pb-204 and Pb-207/Pb-204 values will change with time. Now, supposing that the source of the Solar system was also uniformly distributed with uranium isotopes, then you can draw a data line showing a lead-to-uranium plot and, from the slope of the line, the amount of time which has passed since the pool of matter became separated into individual objects can be computed.
Bertram Boltwood applied this method of dating to 26 different samples of rocks, and discovered that they had been formed between 92 and 570 million years old, and further refinements to the technique gave ages between 250 million to 1.3 billion years.
Geologists set about exploring the Earth, seeking the oldest rock formations on the planet. The oldest surface rock is found in Canada, Australia and Africa, with ages ranging from 2.5 to 3.8 billion years. The very oldest rock was discovered in Canada in 1999, and estimated to be just over 4 billion years old.
This set a minimum age for the Earth, but thanks to geologic processes like weathering and plate tectonics, it could still be older.
Meteorites as the Final Answer to the Age of the Earth
The problem with measuring the age of rocks on Earth is that the planet is under constant geological change. Plate tectonics constantly recycle portions of the Earth, blending it up and forever hiding the oldest regions of the planet. But assuming that everything in the Solar System formed at the same time, meteorites in space have been unaffected by weathering and plate tectonics here on Earth.
Geologists used these pristine objects, such as the Canyon Diablo meteorite (the fragments of the asteroid that impacted at Barringer Crater) as a way to get at the true age of the Solar System, and therefore the Earth. By using the radiometric dating system on these meteorites, geologists have been able to determine that the Earth is 4.54 billion years old within a margin of error of about 1%.
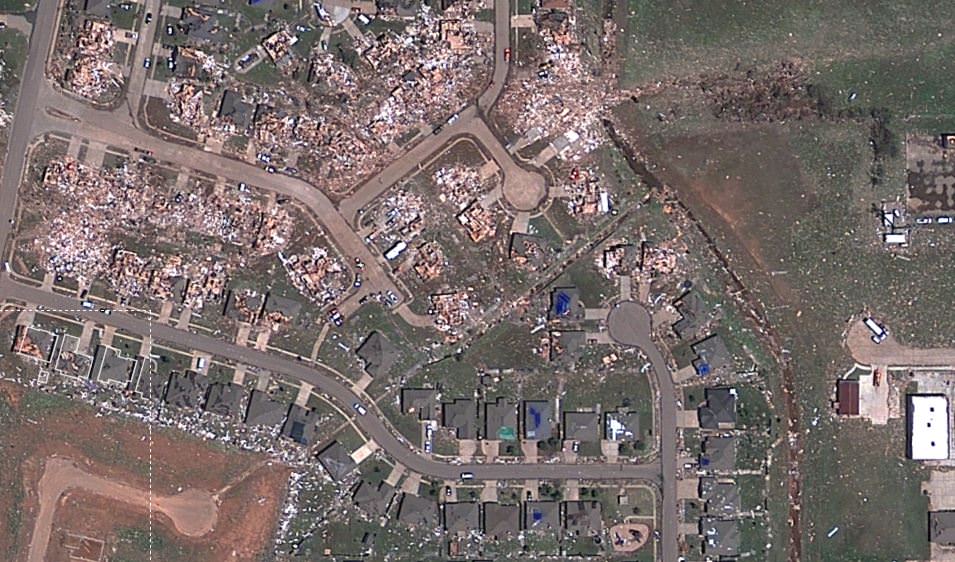
Sceenshot of a satellite view from Google/Digital Globe of the destruction in Moore, Oklahoma after the May 20, 2013 tornado. Click image to have access to an interactive, zoomable version via NPR.
A new satellite map from Google and Digital Globe shows just-released satellite imagery of the damage from the tornado that struck the area of Moore, Oklahoma on May 20, 2013. It’s been called one of the most powerful and destructive tornadoes ever recorded — determined to be an EF5 tornado, the strongest rating for a tornado — and the destruction is heartbreaking. In the screenshot above, you can see how some houses were left undamaged, while others were completely destroyed.
Click on the image above to have access to an interactive map that shows hi-resolution views of the damage, providing details of where the buildings and houses once were. NPR put this map together, using satellite data from Digital Globe, along with property data from City of Oklahoma City, City of Moore, and Cleveland County. Satellite data like this are helping to assist the recovery and rescue teams on the ground.
In the immediate aftermath of a natural catastrophe such as this tornado, the priority is searching for survivors and saving lives.
But longer term recovery — including the rebuilding of infrastructure and amenities such as schools and hospitals — can take decades, and satellite imagery can provide a systematic approach to aiding, monitoring and evaluating this process.
Satellite view of the destructive tornado that passed just south of Oklahoma City. The Moderate Resolution Imaging Spectroradiometer (MODIS) on NASA’s Aqua satellite acquired this image of the storm at 2:40 p.m. local time (19:40 UTC) on May 20, 2013. Credit: NASA image courtesy Jeff Schmaltz, LANCE/EOSDIS MODIS Rapid Response Team at NASA GSFC.
The Take Part website has a list of organizations that are providing support for the recovery and care of the people affected, if you would like to contribute.
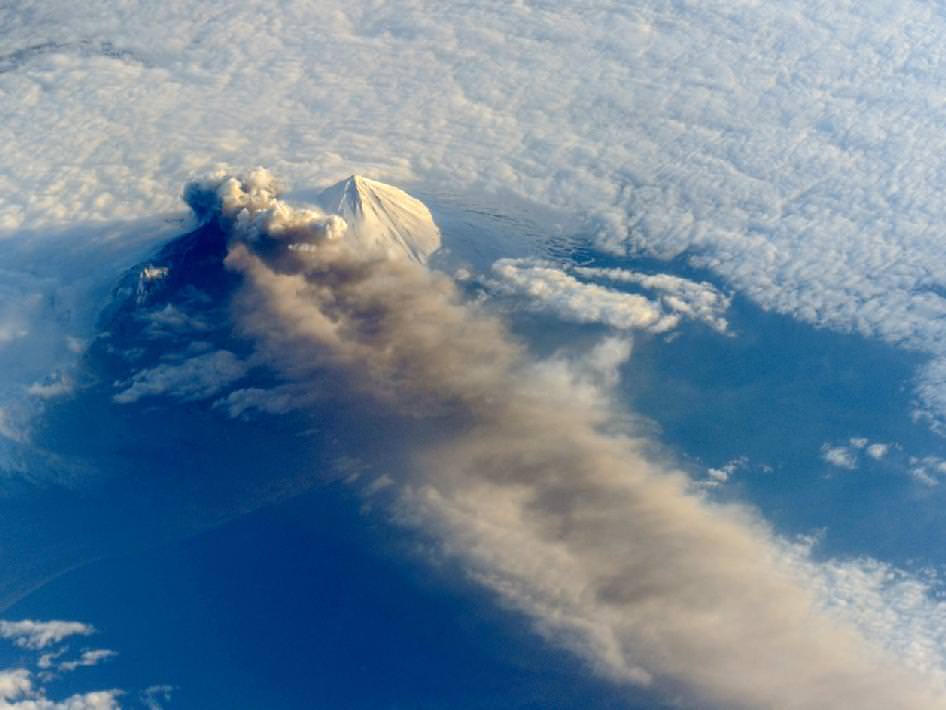
The Pavlof Volcano in Alaska on May 18, 2013. The oblique perspective from the ISS reveals the three dimensional structure of the ash plume, which is often obscured by the top-down view of most remote sensing satellites. Credit: NASA
The Pavlof Volcano began erupting on May 13, 2013, shooting lava into the air and spewing an ash cloud 20,000 feet (6,000 meters) high. This image from the International Space Station was taken on May 18, and provides a unique oblique (sideways) glance at the action. When the photograph was taken, the space station was about 475 miles south-southeast of the volcano (49.1° North latitude, 157.4° West longitude). The volcanic plume extended southeastward over the North Pacific Ocean.
NASA says the oblique perspective reveals the three dimensional structure of the ash plume, which is usually not visible from the top-down views of most remote sensing satellites.
If the volcano keeps erupting and spewing ash at those heights, it could interfere with airline traffic. Pavlov is one of the most frequently erupting volcanoes in the Aleutian arc. It last erupted in August of 2007; it previously had not been active since 1996.
There’s more information — and an impressive set of ground-based images — on the Pavlov Volcano at the Alaska Volcano Observatory website, and here’s a helicopter video of the eruption:
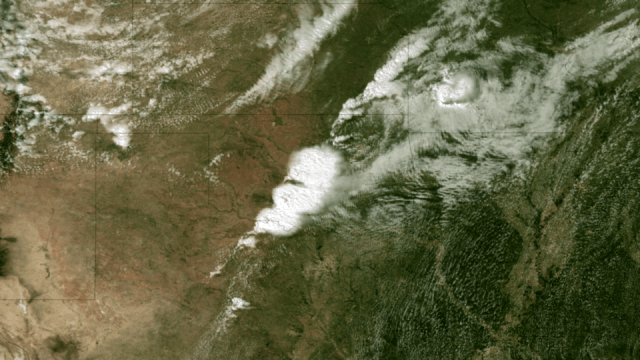
Satellite Image of Oklahoma Tornado. Acquired at 2:55 CT on May 20, 2013, this image from the NOAA GOES-13 satellite shows the storms developing directly over central Oklahoma. One minute later an incredibly destructive tornado touched down in Moore, OK. Credit: NOAA.
The massive tornado that tore through parts of Oklahoma on My 20, 2013 left a 32 km (20-mile) swath of destruction and death, with winds approaching 320 km/hr (200 mph). The US National Weather Service said the 3 km (2-mile)-wide tornado spent 40 minutes on the ground in the area of Moore, Oklahoma, outside of Oklahoma City, destroying schools, a hospital and hundreds of homes, killing dozens of people. Satellite images and video show how the storm developed.
Below is a video showing satellite imagery from the GOES 13 satellite from May 19-20, 2013. It shows the tornado outbreak and supercell thunderstorms that developed across portions of the Great Plains:
Weather satellites help scientists to observe weather patterns from the unique vantage point of space. This provides the ability to see a larger area of the Earth rather than with conventional radar which does not reveal a true overview of cloud structure and wind patterns.
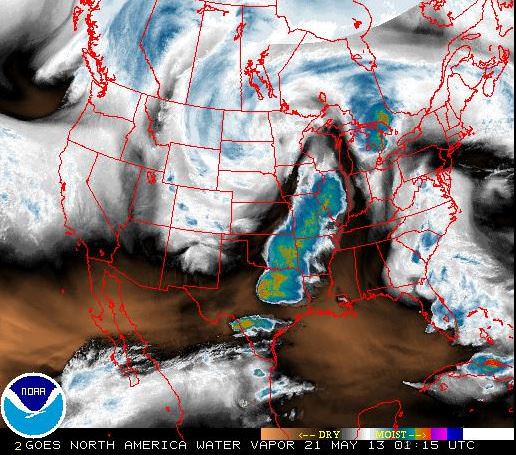
These satellites can measure many different things, such as in the image below, which looks at water vapor content of the clouds. The satellites operated by NASA and NOAA and are equipped to send back images in infrared and other wavelengths, providing snapshots of things like the water vapor measurements, temperatures, wind patterns, cloud coverage, storm movement and many other readings. This information also helps with the prediction of storms, allowing for warnings for people to seek shelter from potentially destructive weather events.
This screenshot shows a false color view of the water vapor content in the clouds during the tornado outbreak in Oklahoma on May 20, 2013, as seen from NOAA geostationary (GOES) satellites. Click on image to go to current NOAA imagery.
The news from Oklahoma is ongoing, and we encourage you to keep current on the latest information from other news sites. But as Phil Plait pointed out, if you are interested in helping the people involved in this tragedy, the Take Part website has a list of organizations that are in the area providing support.
This full-disk view of Earth shows the formation of the Oklahoma tornado, from the Aqua satellite. Credit: NASA Goddard Space Flight Center.
Artist's conception of the solar system, often used in the Eyes on the Solar System 3D Simulator. Credit: NASA
Venus and Mars may be all right tonight, but there’s still a lot we don’t understand about these planets. Why does one, Venus, have such a thick atmosphere? Why is that of Mars so thin? And why is Earth’s atmosphere so different again from what we see on Venus and Mars?
A new JAXA (Japan Aerospace Exploration Agency) satellite aims to better understand what’s going on. It’s called SPRINT-A, for Spectroscopic Planet Observatory for Recognition of Interaction of Atmosphere.
JAXA has set an official launch date of Aug. 22 from the Uchinoura Space Center, although the window extends as far as Sept. 30. (Launches can be delayed due to weather and mechanical difficulties.) The satellite’s expected Earth orbit will range from 590 to 715 miles (950 to 1150 kilometers) above the planet.
“Venus and Earth may be called twin planets, and it recently becomes clear that three terrestrial planets in the solar system – including Mars – have very similar environments in the beginning era of the solar system,” JAXA stated in a press release.
Earth’s atmosphere was similar to that of Venus and Mars in the early solar system, but now it’s quite different, says JAXA. (Image: NASA/Suomi NPP)
The agency pointed out, however, that these three planets ended up with different fates. Venus has a runaway greenhouse effect on its planet, with surface temperatures reaching a scorching 752 degrees Fahrenheit (400 degrees Celsius). Mars, on the other hand, has a very thin atmosphere and more variable temperatures that can get a little chilly.
Understanding how atmospheres escape into outer space is the main goal of SPRINT-A. The sun, the scientists stated, had more intense activity in the past than what we see presently, which could have blown away the atmosphere on some terrestrial planets.
“The study on interaction of the strong solar wind on the atmosphere of the planet leads to acquiring knowledge of history in the early stage of the solar system,” JAXA stated.
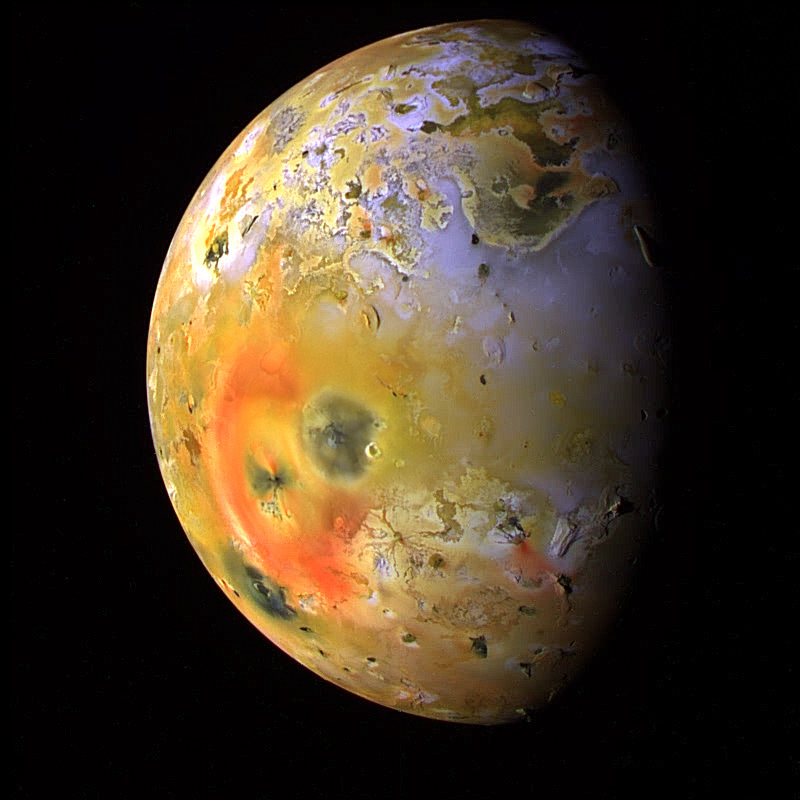
Besides looking at the inner solar system, SPRINT-A will investigate a phenomenon related to a splotchy volcanic moon orbiting the planet Jupiter.
Io, a moon of Jupiter. The colors in this image have been enhanced to better show differences. Sulfur dioxide frost appears in white and grey, and other types of sulfur are in yellow and brown. Recent volcanic activity is marked by red and black blotches. Credit: NASA
SPRINT-A aims to better understand a ring of material surrounding Jupiter that came from Io.
Electrons and ions from the volcanic moon surround Jupiter and, as they collide, produce ultraviolet light in a process similar to what causes auroras in the upper atmosphere of Earth and other planets. How this happens is still being figured out, though.
It’s a pretty radiation-heavy environment in that region of the solar system. The spacecraft Galileo safely orbited the Jovian moons for years, but humans would have a little more trouble surviving the radiation without heavy shielding and careful precautions.
This article originally appeared in 2009, but I’ve updated it and added this video.
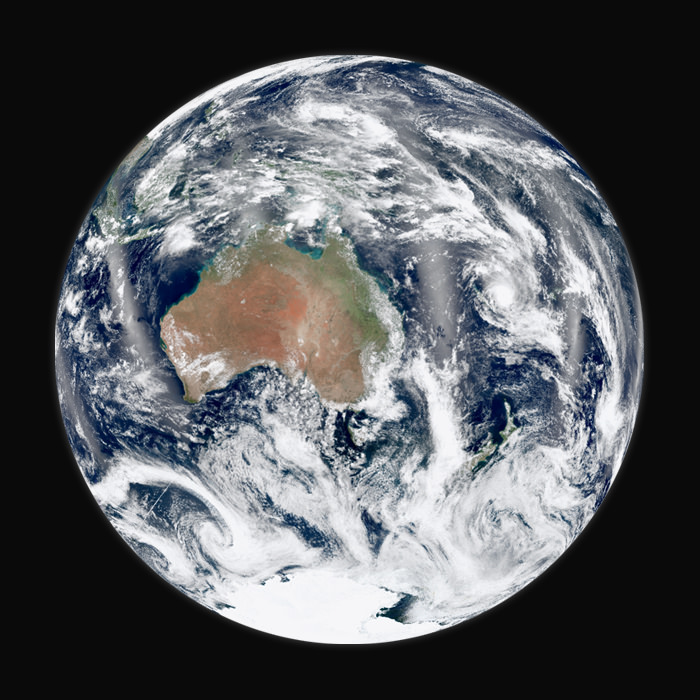
The ground feels firm and solid beneath your feet. Of course, the Earth is rotating, turning once on its axis every day. Fortunately gravity keeps you firmly attached to the planet, and because of momentum, you don’t feel the movement – the same way you don’t feel the speed of a car going down the highway. But how fast does the Earth rotate?
You might be surprised to know that a spot on the surface of the Earth is moving at 1675 km/h or 465 meters/second. That’s 1,040 miles/hour. Just think, for every second, you’re moving almost half a kilometer through space, and you don’t even feel it.
Want to do the calculation for yourself? The Earth’s circumference at the equator is 40,075 km. And the length of time the Earth takes to complete one full turn on its axis is 23.93 hours.
Wait, 23.93 hours? Isn’t a day 24 hours? Astronomers calculate a day in two ways. There’s the amount of time it takes for the Earth to complete one full rotation on its axis, compared to the background stars. Imagine you were looking down at the Earth from above the North Pole. You’d see the Earth turn once completely in 23 hours and 56 minutes. Astronomers call this a sidereal day.
And then there’s the time it takes for the Sun to return to the same spot in the sky. Since the Earth is orbiting the Sun, we actually need an extra 4 minutes each day to return the Sun to the same spot. Astronomers call this a solar day.
Then we divide the length of a day into the distance a point on the equator travels in that period: 40,075 km/23.93 hours = 1,675 km/hour, 465 meters/second.
The speed of the Earth’s rotation changes as you go North or South away from the equator. Finally, when you reach one of the Earth’s poles, you’re taking a whole day to just turn once in place – that’s not very fast.
Because you’re spinning around and around on the Earth, there’s a force that wants to spin you off into space; like when you spin a weight on a string. But don’t worry, that force isn’t very strong, and it’s totally overwhelmed by the force of gravity holding you down. The force that wants to throw you into space is only 0.3% the force of gravity. In other words, if the Earth wasn’t spinning, you would weigh 0.3% more than you do right now.
Space agencies take advantage of the higher velocities at the Earth’s equator to launch their rockets into space. By launching their rockets from the equator, they can use less fuel, or launch more payload with the same amount of fuel. As it launches, the rocket is already going 1,675 km/hour. That makes it easier to reach the 28,000 km/hour orbital velocity; or even faster to reach geosynchronous orbit.
We have written many articles about the Earth for Universe Today. Here’s an article about why the Earth rotates.
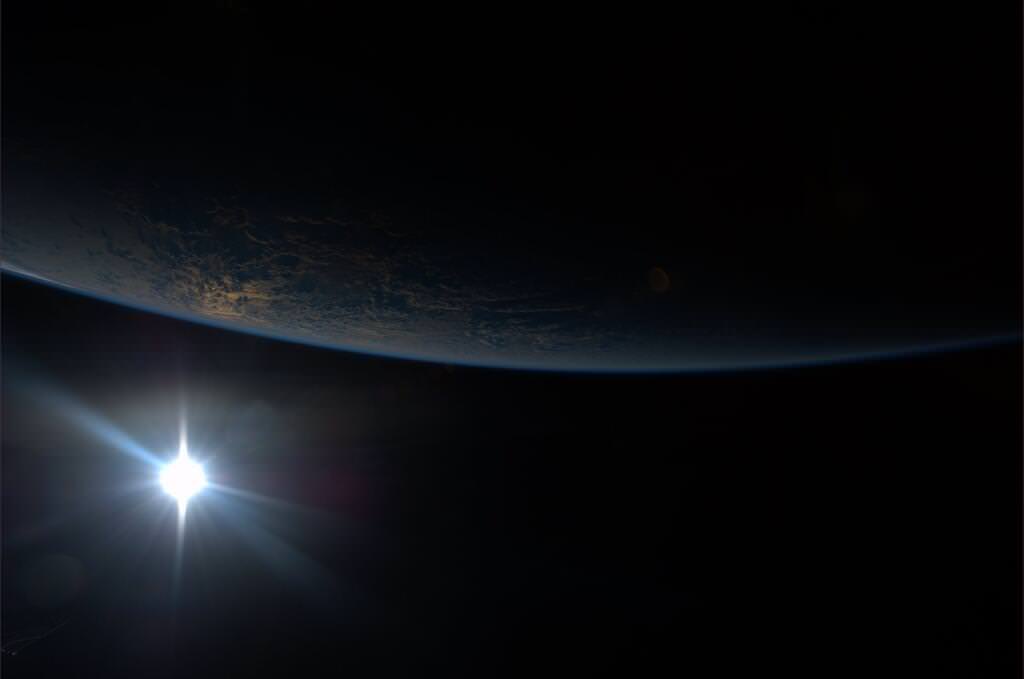
The Sun is about to come up over the South Pacific Ocean in this colorful scene photographed by one of the Expedition 35 crew members aboard the International Space Station between 4 and 5 a.m. local time, May 5, 2013. Credit: NASA
Today’s NASA Image of the Day is just plain pretty; pretty as a postcard. All it is missing is the “Wish you were here!” sentiments.
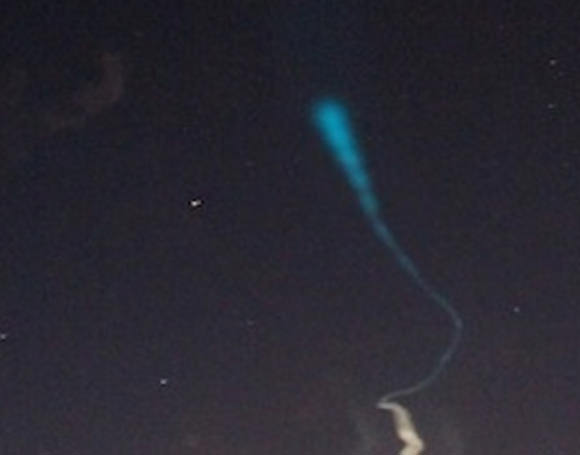
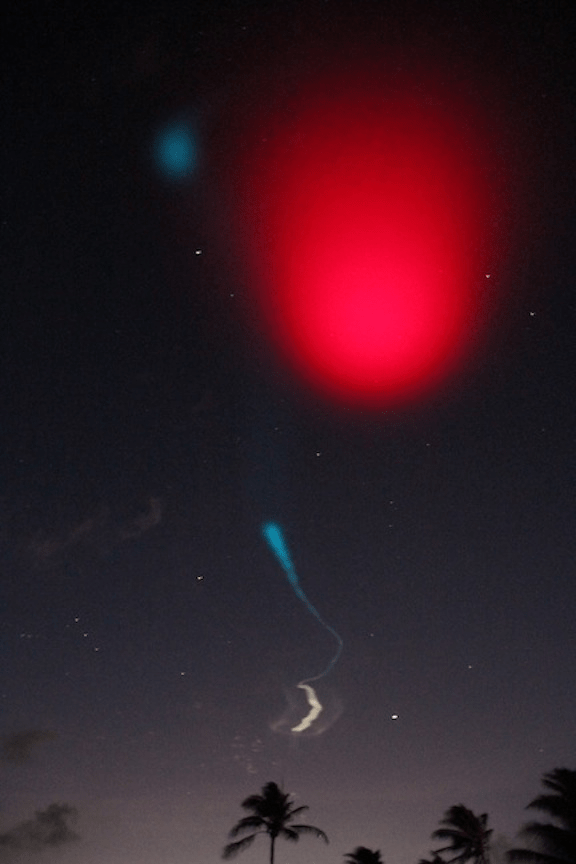
Glowing trails seen in the early morning sky over the Marshall Islands (NASA/Jon Grant)
Ball lightning? Spectral orbs? Swamp gas? Early this morning, May 7, these eerie glowing trails were seen in the sky above the Marshall Islands and were captured on camera by NASA photographer John Grant. Of course, if NASA’s involved there has to be a reasonable explanation, right?
For a larger image (and to see what really caused the trails) click below:
Credit: NASA/John Grant
Although it might look like cheesy special effects, these colorful clouds are actually visible trails that were left by two sounding rockets launched from Roi Namur in the Marshall Islands, at 3:39 a.m. EDT on May 7. The rockets were part of the NASA-funded EVEX experiment to study winds and electrical activity in the upper atmosphere.
The red cloud was formed by the release of lithium vapor and the white-and-blue tracer clouds were formed by the release of trimethyl aluminum (TMA). These clouds allowed scientists on the ground from various locations in the Marshall Islands to observe neutral winds in the ionosphere.
“Neutral winds are one of the hardest things to study,” said Doug Rowland, an EVEX team member at NASA’s Goddard Space Flight Center in Greenbelt, Maryland. “One can’t physically see the wind, and it is difficult to measure from the ground, so we use the TMA as a tracer.”
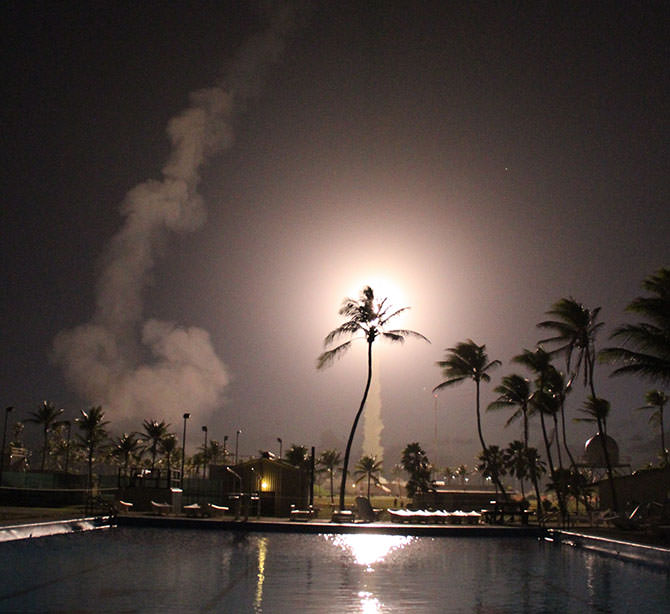
Launch of the second EVEX rocket on the morning of May 7. The plume from the first is visible on the left. (NASA/John Grant)
The EVEX (Equatorial Vortex Experiment) rockets were launched 90 seconds apart. By staggering the launches the two rockets were able to gather data simultaneously at two altitudes through the ionosphere.
Beginning about 60 miles (96 km) up, the ionosphere is a crucial layer of charged particles surrounding our planet. This layer serves as the medium through which high frequency radio waves – such as those sent down to the ground by satellites – travel. Governed by Earth’s magnetic field, high-altitude winds, and incoming material and energy from the sun, the ionosphere can be calm at certain times of day and at other times turbulent, disrupting satellite signals.
The EVEX experiment is designed to measure events in two separate regions of the ionosphere to see how they work together to drive it from placid and smooth to violently disturbed. Such information could ultimately lead to the ability to accurately forecast this important aspect of space weather.

 William Thompson, later known as Lord Kelvin, assumed that the Earth was once a molten ball of rock with the same temperature of the Sun, and then has been cooling ever since. Based on these assumptions, Thompson calculated that the Earth took somewhere between 20 and 400 million years to cool to its current temperature. Of course, Thompson made several inaccurate assumptions, about the temperature of the Sun (it’s really 15 million degrees Kelvin at its core), the temperature of the Earth (with its molten core) and how the Sun is made of hydrogen and the Earth is made of rock and metal.