NASA’s Glory mission launched from Vandenberg Air Force Base in California Friday at 5:09:45 a.m. EST failed to reach orbit. Telemetry indicated the fairing, the protective shell atop the Taurus XL rocket, did not separate as expected about three minutes after launch. The failure represents a $420 million loss for NASA, and the loss of two important investigations related to climate change: ongoing data collection to monitor the sun’s energy reaching Earth, and a study of how aerosols move through Earth’s atmosphere and may influence climate.
This is the second time a Taurus XL rocket has failed to separate. NASA’s $273 million Orbiting Carbon Observatory crashed into the ocean in February 2009 due to a similar mishap. After that failure, Orbital Sciences redesigned the system. It has worked three times since on the company’s Minotaur rocket.
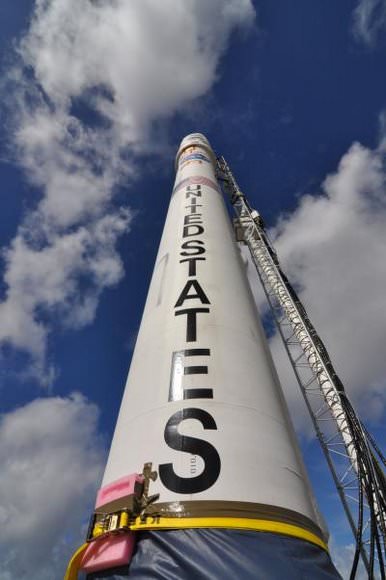
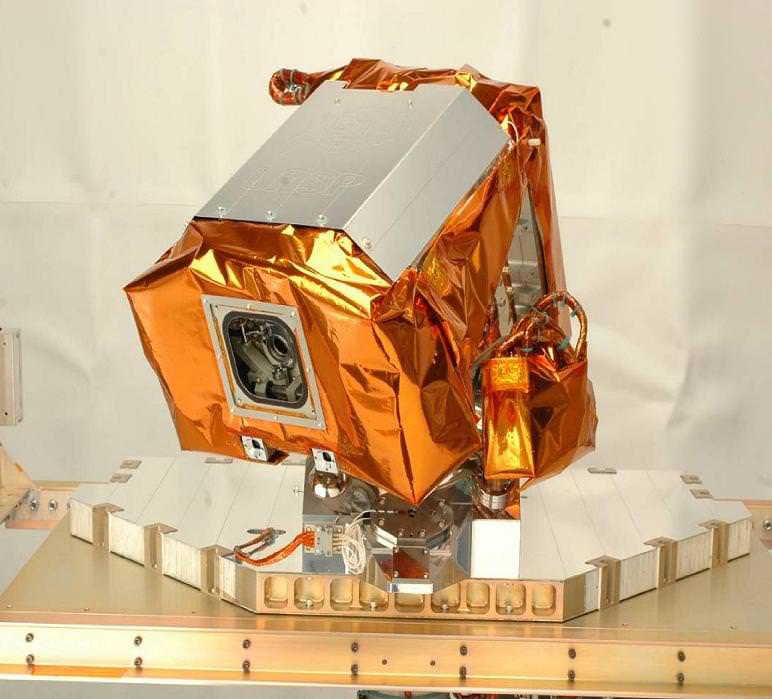
NASA will try again to launch its “climate change satellite” on Friday, following an attempt that was scrubbed on Feb. 23 due to technical issues with ground support equipment for the Taurus XL launch vehicle, shown at right.
The March 4 liftoff is targeted for just after 2 a.m. local time at the Vandenberg Air Force Base in California (5:09:43 a.m. eastern).
Two instruments aboard Glory will help address influences on Earth’s climate. The Total Irradiance Monitor led by Greg Kopp at the Boulder, Colorado-based Laboratory for Atmospheric and Space Physics will continue a decades-long measurement of the sun’s energy reaching Earth, and Raytheon’s Aerosol Polarimetry Sensor will track aerosols in Earth’s atmosphere. See a more detailed story about the mission.
NASA will stream coverage of the launch starting at 3:30 a.m. eastern time on March 4. Real-time updates of countdown and launch milestones will also be posted on NASA’s launch blog.
Betelgeuse is a red super-giant, meaning it has enough mass that it will end as a supernova, rather than as a white dwarf with a planetary nebula. New research suggests that the star could've consumed a smaller companion star. Image credit: Hubble Space Telescope
[/caption]
While planets orbiting twin stars are a staple of science fiction, another is having humans live on planets orbiting red giant stars. The majority of the story of Planet of the Apes takes place on a planet around Betelgeuse. Planets around Arcturus in Isaac Asimov’s Foundation series make up the capital of his Sirius Sector. Superman’s home planet was said to orbit a the fictional red giant, Rao. Races on these planets are often depicted as being old and wise since their stars are aged, and nearing the end of their lives. But is it really plausible to have such planets?
Stars don’t last forever. Our own Sun has an expiration date in about 5 billion years. At that time, the amount of hydrogen fuel in the core of the Sun will have run out. Currently, the fusion of that hydrogen into helium is giving rise to a pressure which keeps the star from collapsing in on itself due to gravity. But, when it runs out, that support mechanism will be gone and the Sun will start to shrink. This shrinking causes the star to heat up again, increasing the temperature until a shell of hydrogen around the now exhausted core becomes hot enough to take up the job of the core and begins fusing hydrogen to helium. This new energy source pushes the outer layers of the star back out causing it to swell to thousands of times its previous size. Meanwhile, the hotter temperature to ignite this form of fusion will mean that the star will give off 1,000 to 10,000 times as much light overall, but since this energy is spread out over such a large surface area, the star will appear red, hence the name.
So this is a red giant: A dying star that is swollen up and very bright.
Now to take a look at the other half of the equation, namely, what determines the habitability of a planet? Since these sci-fi stories inevitably have humans walking around on the surface, there’s some pretty strict criteria this will have to follow.
First off, the temperature must be not to hot and not to cold. In other words, the planet must be in the Habitable zone also known as the “Goldilocks zone”. This is generally a pretty good sized swath of celestial real estate. In our own solar system, it extends from roughly the orbit of Venus to the orbit of Mars. But what makes Mars and Venus inhospitable and Earth relatively cozy is our atmosphere. Unlike Mars, it’s thick enough to keep much of the heat we receive from the sun, but not too much of it like Venus.
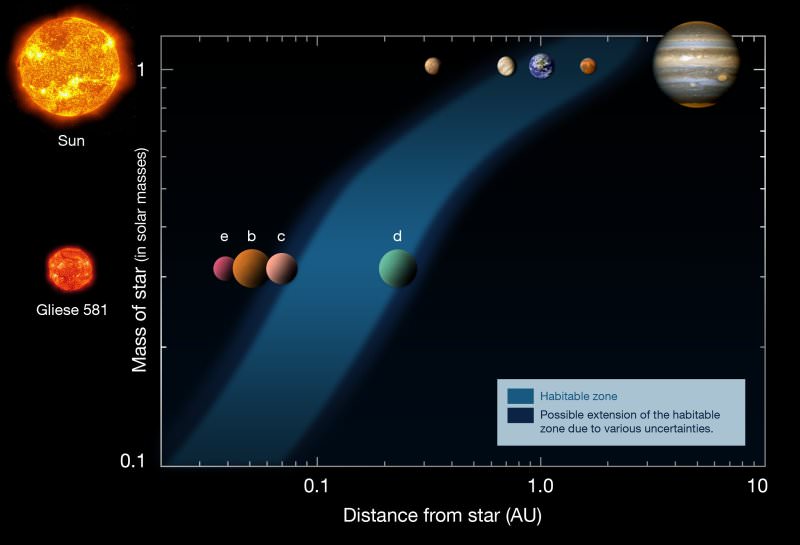
This diagram shows the distances of the planets in the Solar System (upper row) and in the Gliese 581 system (lower row), from their respective stars (left). The habitable zone is indicated as the blue area, showing that Gliese 581 d is located inside the habitable zone around its low-mass red star. Based on a diagram by Franck Selsis, Univ. of Bordeaux. Credit: ESO
The atmosphere is crucial in other ways too. Obviously it’s what the intrepid explorers are going to be breathing. If there’s too much CO2, it’s not only going to trap too much heat, but make it hard to breathe. Also, CO2 doesn’t block UV light from the Sun and cancer rates would go up. So we need an oxygen rich atmosphere, but not too oxygen rich or there won’t be enough greenhouse gasses to keep the planet warm.
The problem here is that oxygen rich atmospheres just don’t exist without some assistance. Oxygen is actually very reactive. It likes to form bonds, making it unavailable to be free in the atmosphere like we want. It forms things like H2O, CO2, oxides, etc… This is why Mars and Venus have virtually no free oxygen in their atmospheres. What little they do comes from UV light striking the atmosphere and causing the bonded forms to disassociate, temporarily freeing the oxygen.
Earth only has as much free oxygen as it does because of photosynthesis. This gives us another criteria that we’ll need to determine habitability: the ability to produce photosynthesis.
So let’s start putting this all together.
Firstly, the evolution of the star as it leaves the main sequence, swelling up as it becomes a red giant and getting brighter and hotter will mean that the “Goldilocks zone” will be sweeping outwards. Planets that were formerly habitable like the Earth will be roasted if they aren’t entirely swallowed by the Sun as it grows. Instead, the habitable zone will be further out, more where Jupiter is now.
However, even if a planet were in this new habitable zone, this doesn’t mean its habitable under the condition that it also have an oxygen rich atmosphere. For that, we need to convert the atmosphere from an oxygen starved one, to an oxygen rich one via photosynthesis.
So the question is how quickly can this occur? Too slow and the habitable zone may have already swept by or the star may have run out of hydrogen in the shell and started contracting again only to ignite helium fusion in the core, once again freezing the planet.
The only example we have so far is on our own planet. For the first three billion years of life, there was little free oxygen until photosynthetic organisms arose and started converting it to levels near that of today. However, this process took several hundred million years. While this could probably be increased by an order of magnitude to tens of millions of years with genetically engineered bacteria seeded on the planet, we still need to make sure the timescales will work out.
It turns out the timescales will be different for different masses of stars. More massive stars burn through their fuel faster and will thus be shorter. For stars like the Sun, the red giant phase can last about 1.5 billion years, so ~100x longer than is necessary to develop an oxygen rich atmosphere. For stars twice as massive as the Sun, that timescale drops to a mere 40 million years, approaching the lower limit of what we’ll need. More massive stars will evolve even more quickly. So for this to be plausible, we’ll need lower mass stars that evolve slower. A rough upper limit here would be a two solar mass star.
However, there’s one more effect we need to worry about: Can we have enough CO2 in the atmosphere to even have photosynthesis? While not nearly as reactive as oxygen, carbon dioxide is also subject to being removed from the atmosphere. This is due to effects like silicate weathering such as CO2 + CaSiO3 –> CaCO3 + SiO2. While these effects are slow they build up with geological timescales. This means we can’t have old planets since they would have had all their free CO2 locked away into the surface. This balance was explored in a paper published in 2009 and determined that, for an Earth mass planet, the free CO2 would be exhausted long before the parent star even reached the red giant phase!
So we’re required to have low mass stars that evolve slowly to have enough time to develop the right atmosphere, but if they evolve that slowly, then there’s not enough CO2 left to get the atmosphere anyway! We’re stuck with a real Catch 22. The only way to make this feasible again is to find a way to introduce sufficient amounts of new CO2 into the atmosphere just as the habitable zone starts sweeping by.
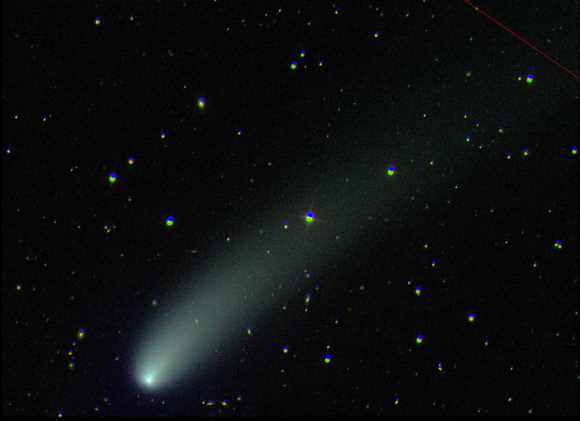
Fortunately, there are some pretty large repositories of CO2 just flying around! Comets are composed mostly of frozen carbon monoxide and carbon dioxide. Crashing a few of them into a planet would introduce sufficient CO2 to potentially get photosynthesis started (once the dust settled down). Do that a few hundred thousand years before the planet would enter the habitable zone, wait ten million years, and then the planet could potentially be habitable for as much as an additional billion years more.
Ultimately this scenario would be plausible, but not exactly a good personal investment since you’d be dead long before you’d be able to reap the benefits. A long term strategy for the survival of a space faring species perhaps, but not a quick fix to toss down colonies and outposts.
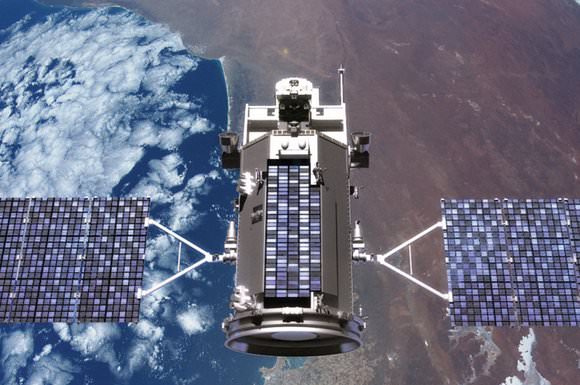
Artist concept of the Glory spacecraft in Earth orbit. Credit: NASA Goddard Space Flight Center
[/caption]
NASA is launching an Earth-orbiting satellite called Glory tomorrow that will tackle a highly charged question: How much can the sun contribute to climate change?
The lull in solar activity between solar cycles 23 and 24 lasted for two years, twice as long as expected. By mid-2009, well into the second year, predictions of global cooling — another Little Ice Age — dominated global warming skeptic blogs. Now Solar Cycle 24 is safely underway, but aside from the dramatic flare and rash of sunspots that erupted last week, it’s been wimpy. Tom Woods, a solar physicist at the Boulder, Colo.-based Laboratory for Atmospheric and Space Physics, says he expects a subdued maximum for Solar Cycle 24 (around 2013) and generally, weak solar cycles come in threes. Each known set of sluggish solar cycles in the past has coincided with bitterly cold winters in parts of the globe — especially Europe and North America.
The question is, with the level of greenhouse gases in the atmosphere from the burning of fossil fuels, would we even feel an extended solar minimum? That’s exactly what Glory will aim to find out.
Glory will launch shortly after 2 a.m. local time on Wednesday, Feb. 23 from the Vandenberg Air Force Base north of Santa Barbara, Calif. The six-foot (1.9 meter), 1,100-pound (525 kg) satellite will orbit for at least three years in Earth’s upper atmosphere, where it will monitor both the total solar energy that’s reaching Earth, and the airborne aerosols greeting the energy it when it gets here.
Aerosols include salt, mineral dust, soot, and smoke and come from a variety of sources – such as vehicle exhaust, campfires, volcanoes and even desert winds and sea spray. They can influence climate by absorbing and scattering light, and NASA scientists have said the range of uncertainty about their role in climate change is far greater than any doubt about greenhouse gases from fossil fuels. Raytheon’s Aerosol Polarimetry Sensor, an instrument mounted on the Earth-facing side of the spacecraft, will observe the movement of aerosols through the atmosphere over time, especially on a seasonal scale.
Glory’s sun-facing side will sport the Total Irradiance Monitor, which will measure the intensity of solar radiation at the top of Earth’s atmosphere, adding to a 32-year data set, to record the solar radiation reaching Earth.
Four solar irradiance instruments are currently flying, including VIRGO, launched in 1995, and SORCE, sent into orbit in 2003. Three of those, though, have long exceeded their designed mission lifetimes and are deteriorating. The European PICARD mission, launched in 2010, and NASA’s Glory mission are the new guard.
Greg Kopp, a researcher also at the Laboratory for Atmospheric and Space Physics, is principal investigator on the Glory mission. He says the existing data has already helped researchers understand variations on the scale of the sun’s 11-year activity cycles. But in order to capture longer trends, observations must continue. And solar researchers are increasingly eager to quantify the sun’s role, given the global importance of the question.
“I’m fond of saying we should get closer to the votersphere,” says Daniel Baker, director of Boulder’s Laboratory for Atmospheric and Space Physics. “I can think of no problem that is more significant to humanity than understanding climate change.”
Follow the mission:
On Feb. 23, NASA TV coverage of the countdown will begin at 3:30 a.m. EST (12:30 a.m. PST). Liftoff is targeted for 5:09:43 a.m. EST (2:09:43 a.m. PST). Spacecraft separation from the Taurus occurs 13 minutes after launch. The briefings and launch coverage also will be streamed online.
Launch coverage of Glory countdown activities will appear on NASA’s launch blog starting at 3:30 a.m. EST (12:30 a.m. PST). Real-time updates of countdown milestones as well as streaming video clips highlighting launch preparations and liftoff will also be available.
Up to two-thirds of Earth’s permafrost likely will disappear by 2200 as a result of warming temperatures, unleashing vast quantities of carbon into the atmosphere, says a new study by the University of Colorado Boulder’s Cooperative Institute for Research in Environmental Sciences (CIRES).
The carbon resides in permanently frozen ground that is beginning to thaw in high latitudes from warming temperatures, which will impact not only the climate but also international strategies to reduce fossil fuel emissions, said CU-Boulder’s Kevin Schaefer, lead study author. “If we want to hit a target carbon dioxide concentration, then we have to reduce fossil fuel emissions that much lower than previously thought to account for this additional carbon from the permafrost,” he said. “Otherwise we will end up with a warmer Earth than we want.” Continue reading “Study: Thawing Permafrost Could Accelerate Global Warming”
It’s not often I voice my opinion on climate change without sounding like a tree-hugger or a total kook. However, in this circumstance I had an opportunity to read about some findings that hit home with my own personal thoughts and I figured you might like to know, too.
According to the latest American Astronomical Society Press Release, “Scientists have taken a major step toward accurately determining the amount of energy that the Sun provides to Earth, and how variations in that energy may contribute to climate change. In a new study of laboratory and satellite data, researchers report a lower value of that energy, known as total solar irradiance, than previously measured and demonstrate that the satellite instrument that made the measurement — which has a new optical design and was calibrated in a new way — has significantly improved the accuracy and consistency of such measurements. The new findings give confidence, the researchers say, that other, newer satellites expected to launch starting early this year will measure total solar irradiance with adequate repeatability — and with little enough uncertainty — to help resolve the long-standing question of how significant a contributor solar fluctuations are to the rising average global temperature of the planet.
“Improved accuracies and stabilities in the long-term total solar irradiance record mean improved estimates of the Sun’s influence on Earth’s climate,” said Greg Kopp of the Laboratory for Atmospheric and Space Physics (LASP) of the University of Colorado Boulder. Kopp, who led the study, and Judith Lean of the Naval Research Laboratory, in Washington, D.C., published their findings today in Geophysical Research Letters, a journal of the American Geophysical Union. The new work will help advance scientists’ ability to understand the contribution of natural versus anthropogenic causes of climate change, the scientists said. That’s because the research improves the accuracy of the continuous, 32-year record of total solar irradiance, or TSI. Energy from the Sun is the primary energy input driving Earth’s climate, which scientific consensus indicates has been warming since the Industrial Revolution.
Lean specializes in the effects of the Sun on climate and space weather. She said, “Scientists estimating Earth’s climate sensitivities need accurate and stable solar irradiance records to know exactly how much warming to attribute to changes in the Sun’s output, versus anthropogenic or other natural forcings.” The new, lower TSI value was measured by the LASP-built Total Irradiance Monitor (TIM) instrument on the NASA Solar Radiation and Climate Experiment (SORCE) spacecraft. Tests at a new calibration facility at LASP verify the lower TSI value. The ground- based calibration facility enables scientists to validate their instruments under on-orbit conditions against a reference standard calibrated by the National Institute of Standards and Technology (NIST). Before the development of the calibration facility, solar irradiance instruments would frequently return different measurements from each other, depending on their calibration. To maintain a long-term record of the Sun’s output through time, scientists had to rely on overlapping measurements that allowed them to intercalibrate among instruments.
Kopp said, “The calibration facility indicates that the TIM is producing the most accurate total solar irradiance results to date, providing a baseline value that allows us to make the entire 32-year record more accurate. This baseline value will also help ensure that we can maintain this important climate data record for years into the future, reducing the risks from a potential gap in spacecraft measurements.” Lean said, “We are eager to see how this lower irradiance value affects global climate models, which use various parameters to reproduce current climate: incoming solar radiation is a decisive factor. An improved and extended solar data record will make it easier for us to understand how fluctuations in the Sun’s energy output over time affect temperatures, and how Earth’s climate responds to radiative forcing.” Lean’s model, which is now adjusted to the new lower absolute TSI values, reproduces with high fidelity the TSI variations that TIM observes and indicates that solar irradiance levels during the recent prolonged solar minimum period were likely comparable to levels in past solar minima. Using this model, Lean estimates that solar variability produces about 0.1 degree Celsius (0.18 degree Fahrenheit) global warming during the 11-year solar cycle, but is likely not the main cause of global warming in the past three decades.”
I think the new findngs are awesome. For one, we really haven’t been studying our weather with any great accuracy or scientific instruments for that long – only about 5 decades. For those of us who enjoy viewing sunspots, you also might have noticed that when sunspot activity is high, it really does seem to affect our weather – especially cloud cover. Global warming is real, and there is no doubt that mankind has contributed to it. However, take solar findings very much to heart because my opinion is the Sun plays a more important role in our climate than we could have ever dreamed possible.
Original Source: American Geophysical Union – Image Courtesy of NASA
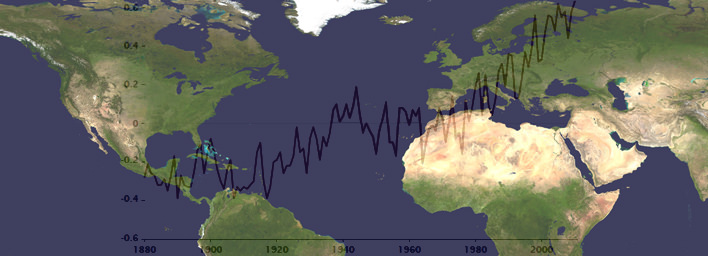
World map with global temperature changes from 1880 to 2010. Credit: NASA GISS
[/caption]
Newly released scientific data shows that 2010 equals 2005 as the Earths warmest year on record over the last 131 years, say researchers from NOAA and NASA. Temperature measurements from instrumented monitoring stations date back to 1880.
The past decade from 2001 to 2010 was the warmest on record and includes 9 of the 10 hottest years. A NOAA ranking of the 15 hottest years globally shows they all occurred in the last 15 years since 1995.
2010 was the 34th consecutive year with global temperatures above the 20th century average of 57.0 F (13.9°C), according to NOAA data. 1976 was the last year with a below average global temperature. Updated.
Global surface temperature anomalies for 2010. Credit: NOAA
Overall, the combined global land and ocean surface temperatures for 2010 and 2005 has risen 1.12 F (0.62 C) compared with the 20th century average, according to NOAA. The average global temperature in 2010 was 58.12 degrees compared to 57.0 F (13.9°C) as the average for all of 20th century. 2010 was also the wettest year on record.
The rise in Earths’ global temperature has been accompanied by a decline in arctic sea ice. Specifically, surface air temperatures in the arctic were warmer than normal during the summer of 2010. The sea ice extent measured in September 2010, was the 3rd lowest on record since accurate monitoring began in 1979, states NOAA in the annual Arctic report card. See Video below.
Scientists from NOAA’s National Climatic Data Center (NCDC) in Asheville, N.C. and NASA’s Goddard Institute for Space Studies (GISS) in New York City announced the findings on Jan 12. The temperature data are collected by weather stations that span across the globe.
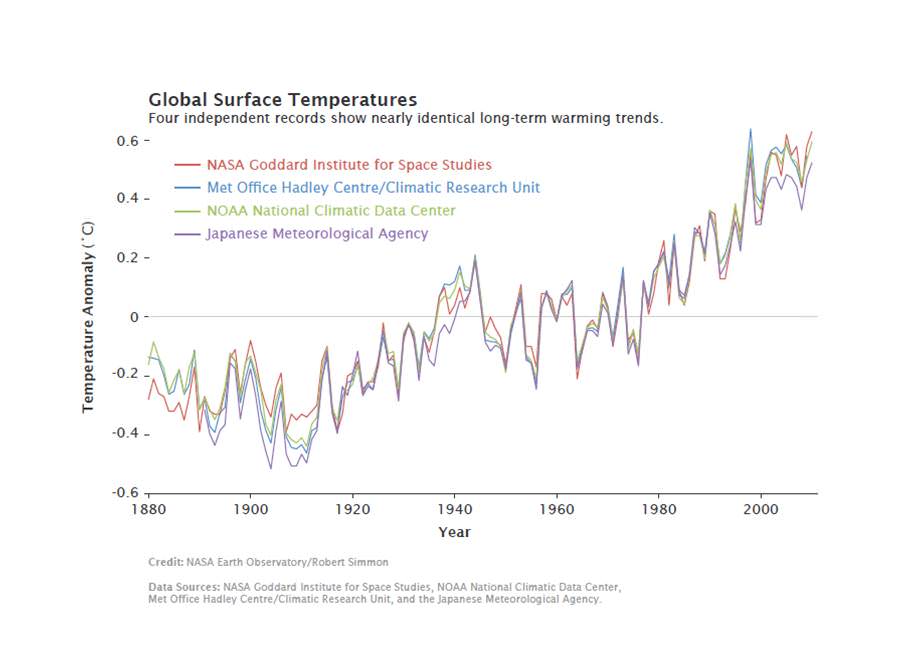
Global measurements by independent researchers in the UK at the Met Office Hadley Centre and at the Japanese Meteorological Agency closely match the trend of warming temperatures gathered by NOAA NCDC and NASA GISS.
The graphic below combines the actual temperature data collected independently by the four research agencies. The temperature trend lines are remarkably consistent.
Multiple institutions monitor global surface temperatures. Despite subtle differences in the ways the scientists perform their analyses, these four widely referenced records show remarkable agreement. Credit: NASA Earth Observatory/Robert Simmon
Much of the rise in global temperatures has taken place since the late 1970’s, says NASA. The rate of increase has been about 0.36 F per decade. The NASA GISS weather data were collected using over 1000 meteorological stations around the world, satellite observations of sea surface temperature and Antarctic research station measurements.
2010 average annual temperature ranks by state in the US. Credit: NOAA
The data are fed into a computer program which then calculates temperature anomalies — the difference between surface temperature in a given month and the average temperature for the same period during 1951 to 1980. NASA GISS uses that three-decade period as the baseline for analysis against which climate change can be tracked. NOAA uses the entire 20th century.
For the contiguous United States, NOAA analysis shows that “2010 was the 14th consecutive year with an annual temperature above the long-term average. Since 1895, the temperature across the US has increased at an average rate of approximately 0.12 F per decade.”
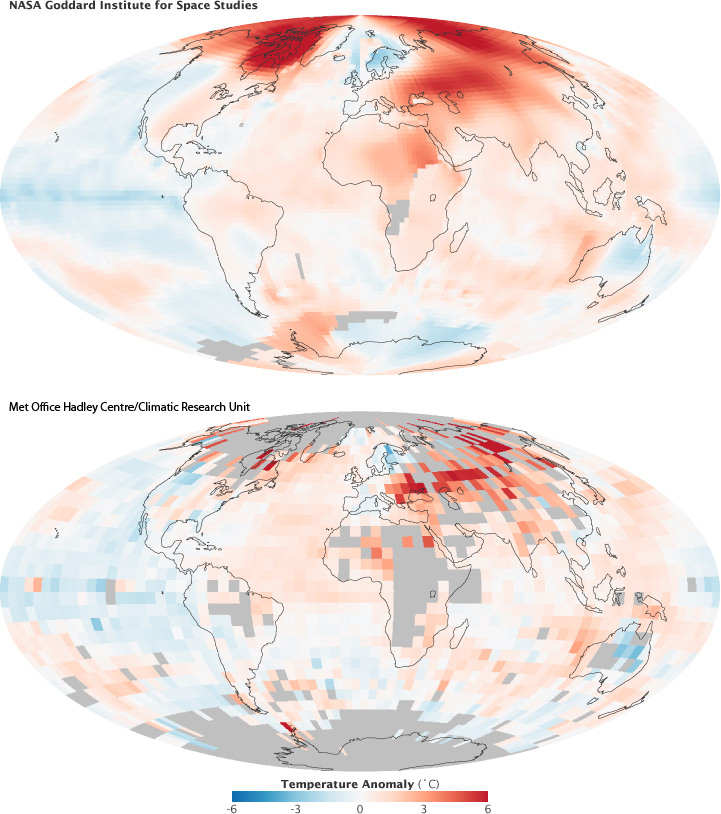
There are large areas in the Arctic without weather stations. NASA GISS approaches the problem by filling in gaps with data from the nearest land stations. The Climatic Research Unit at the University of East Anglia, which works jointly with the Met Office Hadley Centre, leaves much of the region out of its global temperature analysis. Credit: NASA Earth Observatory/Robert Simmon2010 Global Significant Weather and Climate Events. Credit: NOAA Global Temperatures.
The year 2010 tied with 2005 as the warmest year since records began in 1880. The annual global combined land and ocean surface temperature was 0.62°C (1.12°F) above the 20th century average. The range associated with this value is plus or minus 0.07°C (0.13°F). The 2010 combined land and ocean surface temperature in the Northern Hemisphere was also the warmest on record, while the combined land and ocean surface temperature in the Southern Hemisphere was the sixth warmest such period on record. Credit: NOAA
“Red sky in the morning… Sailors take warning!” How many of you have heard of that old phrase? Just look at this beautiful panorama of Cairns, Australia done by Joe Brimacombe – does it portend foul weather ahead or are such sayings a myth? Step inside and let’s find out…
In present time we recognize such beautiful clouds to be a reflection from the rising Sun, but in times past mankind relied on such fanciful wordsmithing to help them predict weather patterns crucial to farmers and sailors. Can the appearance of the sky and appearance of the clouds really foretell the atmospheric future? You just might be surprised…
Generally our weather moves in the opposite direction – west to east – from which our Earth turns. It’s carried along by the romantic westerly trade winds, meaning storm systems are more likely to arrive from the west. We know the brilliant and varied colors we see in the sky are caused by sunlight being refracted into almost all the colors of the spectrum as they pass through our atmosphere and bounce off the water vapor and fine particles present in Earth’s atmosphere. The amount, of which, are darn good indications of weather-to-be!
At both rise and set, the Sun is low on the horizon and the light coming through is penentrating the very thickest part of Earth’s atmosphere. When skies appear red, we know it carries a concentration of both moisture and dust particles. We perceive red because the longest wavelengths in the visible spectrum dictate it. The shorter blue wavelengths are dispersed. Therefore a red sunrise means the Sun is reflecting from dust particles and clouds that have passed from the west and a storm may be following in from the east. Watch for the skies themselves to change color, too… Because if they should appear a deep, brilliant red? That means there’s a high moisture content in the atmosphere and rain is usually on the way!
And now you know…
Many thanks to Dr. Joseph Brimacombe for sharing his awesome photo taken from Coral Towers Observatory, Cairns, Australia. You rock, Doc!
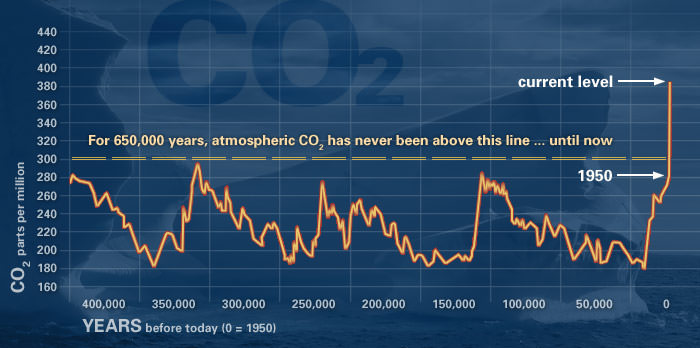
This graph, based on the comparison of atmospheric samples contained in ice cores and more recent direct measurements, provides evidence that atmospheric CO2 has increased since the Industrial Revolution. (Source: NOAA)
[/caption]
The body of evidence for climate change is strong and convincing, and multiple lines of evidence show the changes are caused largely by human activities. The consensus among scientists about the reality of the phenomenon is also convincing.
But from the nature of public discussions on the subject today – at least in the US – that consensus might not be apparent. And somehow the discussion has become a “debate,” which is often divided down political party lines.
“We have to make it clear that the ice sheets are not Republicans or Democrats – they don’t have a political agenda as they disappear,” said Michael Mann, a physicist at Pennsylvania State University, who has been at the recent forefront of climate research. “Certain facts cannot be denied. We have to find a way to steer the conversation to a good faith debate about what we can do about the problem, not this bad faith debate about the reality of it.”
Why has the public discourse become so polarizing and why is there a fair amount of legislators and the public who now think that climate change is an elaborate hoax?
Michael Mann, Professor Director, Earth System Science Center, Pennsylvania State University. Credit: PSU
Mann referred specifically to an infamous memo sent out by GOP political consultant Frank Luntz in 2002 to President George Bush, “which basically said that if the public comes to understand the reality of this problem they will demand policy action to deal with it,” Mann said, “and so you need to manufacture doubt and controversy and uncertainty and cultivate a set of scientists who can act for advocates essentially for fossil fuel industry. And that is what is happened.”
And the science became politicized. “If you can politicize something in today’s political environment,” Mann continued, “you can immediately get half the population on your side. Unfortunately the forces of anti-science — those who deny the science — have been very effective in politicizing the framing.”
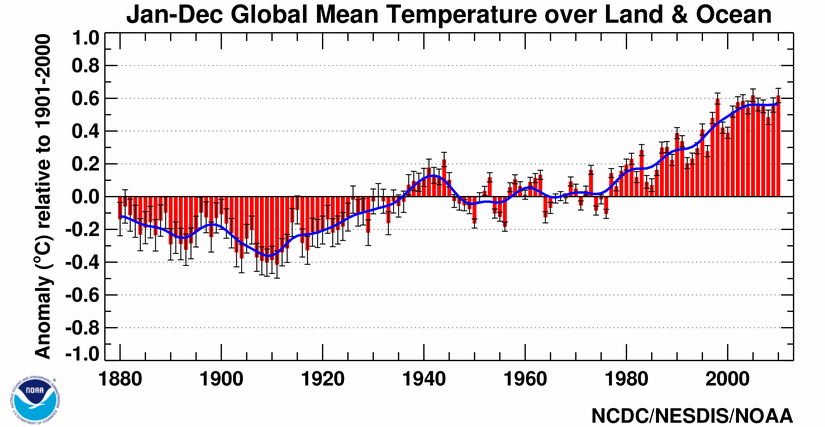
Line plot of global mean land-ocean temperature index, 1880 to present, with the base period 1951-1980. The dotted black line is the annual mean and the solid red line is the five-year mean. The green bars show uncertainty estimates. Credit: NASA
But thousands of scientists from almost 200 countries around the world agreed on the most recent Intergovernmental Panel on Climate Change (IPCC) report which said most of the observed increases in global average temperatures is very likely due to the observed increase in anthropogenic greenhouse gas concentrations. Additionally, the US National Academy of Sciences, the National Academies of all the G-8 nations, the American Association for the Advancement of Science and several other scientific bodies have all issued equivalent statements of consensus of the reality of human-caused climate change.
“Certain facts cannot be denied because you don’t like the implications,” Mann said.
Mann is probably best known for known for his “hockey stick” reconstruction of past climate, (Nature, 1998) which shows the world is warmer now than it has been for at least 1000 years. The “hockey stick” has been attacked by climate change deniers, and while new research has better defined the data, it has not been disproven, nor is it the only line of evidence for global warming.
“The hockey stick is not ‘the’ pillar of evidence for the reality of climate change,” Mann said. “There are multiple pillars that include just the basic understanding of chemistry and physics. But it is one of the more visually compelling pieces of evidence for warming.”
The 'hockey stick' chart from the Intergovernmental Panel on Climate Change Third Assessment Report in 2001.
Mann conceded that various other studies and reconstructions of past climate data don’t agree entirely and that there are uncertainties of how much warming will continue because the predictions are based on models, which attempt to predict the future.
“There are legitimate uncertainties, but unfortunately the public discourse is so far removed from where the scientific discourse and controversies actually are, “Mann said. “There is not an uncertainty of the reality of climate change, that sea levels are going to rise, that arctic sea ice will be gone in a few decades or a whole lot of other areas, but we do have an uncertainty in our ability to project regional climate change.”
Mann said scientists don’t completely understand the El Nino and La Nina affects, how cloud feedback will influence the warming and other modeling issues.
However, Mann said, the science has improved over the past few years, and still, there is enough evidence for not just a hockey stick, but an entire hockey league.
“Every reconstruction reveals that the warming is indeed anomalous in a very long term context. Global temperatures are running the highest they have ever run. The twelve month running averages are warmer than they have ever been in documented history. There is no cooling of the globe and no decline to hide,” Mann said referring to the “Climategate” emails that were stolen from East Anglia climate research center and leaked just a few weeks before the Copenhagen climate summit in late 2009.
“Hackers stole thousands of emails –private correspondences between scientists,” said Mann, “and their words were cherry picked, taken out of context and distorted to make it sound like scientists were engaged in some sort of hoax.”
‘Hide the decline’ actually meant the scientists were going to remove unreliable tree-ring data, not cover up any decline in temperatures.
Mann said the real crime was the illegal theft of private correspondence, in addition to the moral crime of intentionally distorting what scientists believe and think.
Mann took his audience to task by saying, “I’d like to say the mainstream media recognized the manufactured controversy for what is was, but they didn’t, entirely.” He also admitted that scientists have not done all they could in the past to make the science clear and their words convincing.
But looking at the current political climate, Mann asked for journalists’ help in the future.
“No doubt we are in for a period of months or even years where climate science is likely to be subject to the sort of politically motivated inquisition that we haven’t seen, frankly, since the 1950’s,” he said. “It is necessary and important for the scientific community to do the best it I can to defend itself from this oncoming attack, and frankly, we are entirely reliant on the willingness of the mainstream media to serve in its role as the critical and independent arbiter and not just report the two sides of the so-called debate, but to actually establish what is fact and what is fiction. The scientists will not be successful against the attack that is coming unless the media is serving its role.”
Mann ended his talk with a picture of his daughter enthralled by a polar bear at a zoo. “I don’t want to have to tell my daughter that polar bears became extinct because we failed to counter a well funded effort to distract the public,” he said.
————————————
Note: For any reader who thinks they need to leave a comment to debate the climate change science, before posting, please take a look at the following information:
The newest citizen science project from the Galaxy Zoo team lets the public travel back in time and join the crews of over 280 different World War I royal navy warships. While an engaging historical journey, the project will help scientists better understand the climate of the past. There are gaps in weather and climate data records, particularly before 1920, prior to when weather station observations were accurately recorded. But old naval ships routinely recorded the weather they encountered – marking down temperatures and conditions even while in battle. The information in many of these weather logbooks has not been utilized – until now, as the “Old Weather” project has made its debut as the newest way for the public to contribute in scientific research.
The project is designed to provide a detailed map of the world’s climate around 100 years ago, which will help tell us more about the climate today. Anyone can take part, read the logs, follow events aboard the vessels and contribute to this fun and historical project, which could tell us more about our climate’s future.
“These naval logbooks contain an amazing treasure trove of information but because the entries are handwritten they are incredibly difficult for a computer to read,’ said Dr. Chris Lintott of Oxford University, a Galaxy Zoo founder and developer of the OldWeather.org project. “By getting an army of online human volunteers to retrace these voyages and transcribe the information recorded by British sailors we can relive both the climate of the past and key moments in naval history.”
By transcribing information about weather, and any interesting events, from images of each ship’s logbook web volunteers will help scientists to build a more accurate picture of how our climate has changed over the last century, as well as adding to our knowledge of this important period of British history.
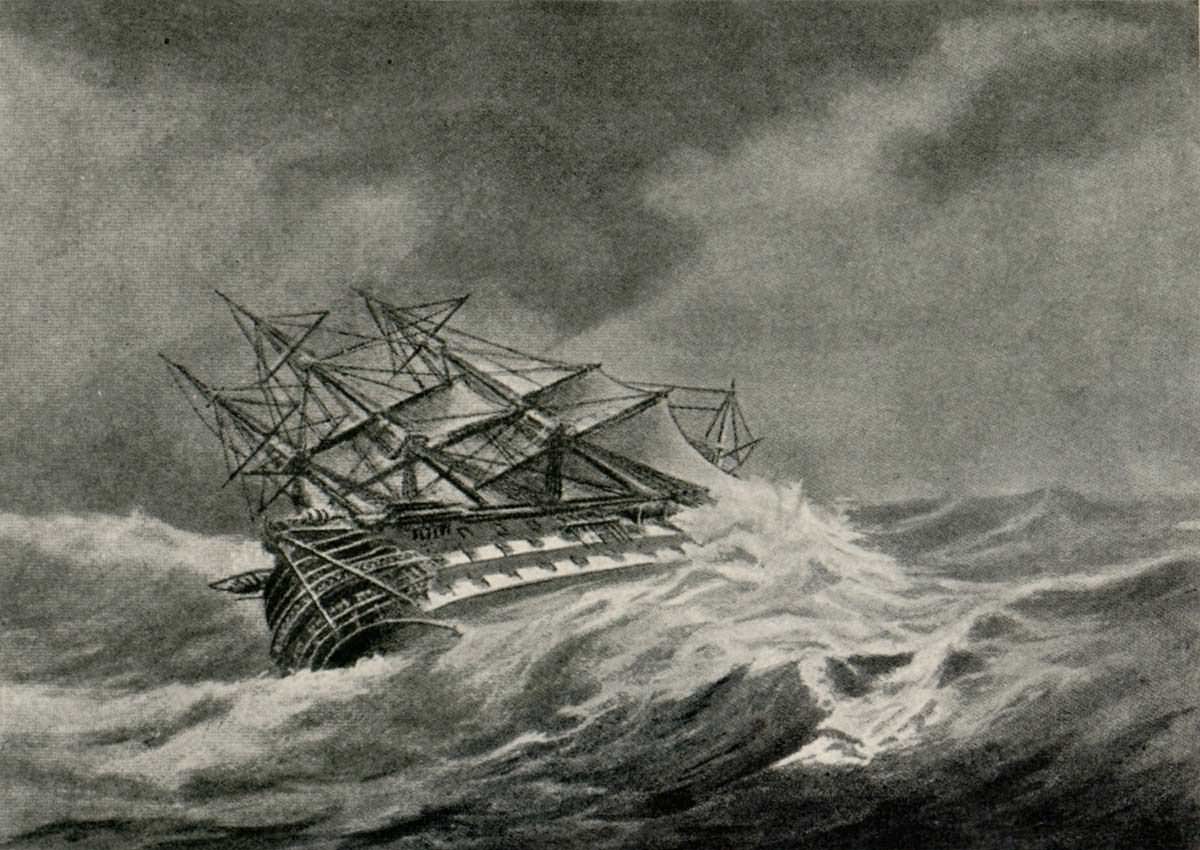
HMS Acacia, one of the ships in the Old Weather project.
“Historical weather data is vital because it allows us to test our models of the Earth’s climate,”said Dr. Peter Stott, Head of Climate Monitoring and Attribution at the British meteorology, or Met Office. “If we can correctly account for what the weather was doing in the past, then we can have more confidence in our predictions of the future. Unfortunately, the historical record is full of gaps, particularly from before 1920 and at sea, so this project is invaluable.”
Weather observations by Royal Navy sailors were made every four hours without fail, said Dr. Robert Simpson of Oxford University, who added that this project is almost like “launching a weather satellite into the skies at a time when manpowered flight was still in its infancy.”
If you are not yet familiar yet with the Zooniverse, which includes citizen science projects like Galaxy Zoo and Moon Zoo, you are really missing out on a fun and engaging way to do actual, meaningful science. In those projects, 320,000 people have made over 150 million classifications and published several scientific papers – which shown that ordinary web users can make observations that are as accurate as those made by experts.
Old Weather is unique among the eight scientific projects encompassed by the Zooniverse because of how old the data is, and participating really is a trip back in time. The ‘virtual sailors’ visiting OldWeather.org are rewarded for their efforts by a rise through the ratings from cadet to captain of a particular ship according to the number of pages they transcribe. Historians are also hoping that a look into these old records will provide a fresh insight into naval history and encourage people to find out more about the past.
Here’s a tutorial on how to participate in Old Weather: