How Deforestation in Brazil is Affecting Local Climate

Image credit: NASA
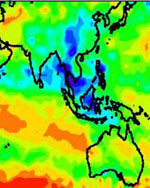
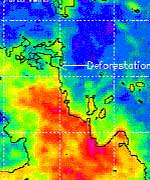
NASA satellite data are giving scientists insight into how large-scale deforestation in the Amazon Basin in South America is affecting regional climate. Researchers found during the Amazon dry season last August, there was a distinct pattern of higher rainfall and warmer temperatures over deforested regions.

Researchers analyzed multiple years of data from NASA’s Tropical Rainfall Measuring Mission (TRMM). They also used data from the Department of Defense Special Sensor Microwave Imager and the National Oceanic and Atmospheric Administration’s Geostationary Operational Environmental Satellites.

The study appeared in a recent issue of the American Meteorological Society’s Journal of Climate. Lead authors, Andrew Negri and Robert Adler, are research meteorologists at NASA’s Goddard Space Flight Center (GSFC), Greenbelt, Md. Other authors include Liming Xu, formerly of the University of Arizona, Tucson, and Jason Surratt, North Carolina State University, Raleigh.

“In deforested areas, the land heats up faster and reaches a higher temperature, leading to localized upward motions that enhance the formation of clouds and ultimately produce more rainfall,” Negri said.

The researchers caution the rainfall increases were most pronounced in August, during the transition from dry to wet seasons. In this transition period, the effects of land cover, such as evaporation, are not overwhelmed by large-scale weather disturbances that are common during the rest of the year. While the study, based on satellite data analysis, focused on climate changes in the deforested areas, large increases in cloud cover and rainfall were also observed in the naturally un-forested savanna region and surrounding the urban area of Port Velho, Brazil, particularly in August and September.

Recent studies by Dr. Marshall Shepherd cited similar findings, including an average rain-rate increase of 28 percent downwind of urban areas and associated changes in the daily timing of cloud formation and precipitation. He is also a research meteorologist at GSFC.

This research confirmed the Amazon savanna region experienced a shift in the onset of cloudiness and rainfall toward the morning hours. The shift was likely initiated by the contrast in surface heating across the deforested and savanna region.

The varied heights of plants and trees in the region change the aerodynamics of the atmosphere, creating more circulation and rising air. When the rising air reaches the dew point in the cooler, upper atmosphere, it condenses into water droplets and forms clouds.

Negri acknowledged other factors are involved. The savanna in this study is approximately 100 kilometers (62 miles) wide, the perfect size to influence precipitation, such as rain showers and thunderstorms. Earlier studies hypothesized certain land surfaces, such as bands of vegetation 50 to 100 kilometers (31-62 miles) wide in semiarid regions, could result in enhanced precipitation.

This research is in agreement with the recent and sophisticated computer models developed by the Massachusetts Institute of Technology. The models concluded small-scale circulations, including the mixing and rising of air induced by local land surfaces, could enhance cloudiness and rainfall. Many earlier studies that relied on models developed in the 1990s or earlier concluded widespread deforestation of the Amazon Basin would lead to decreased rainfall.

“The effects here are rather subtle and appear to be limited to the dry season. The overall effect of this deforestation on annual and daily rainfall cycles is probably small and requires more study,” Negri said. Future research will use numerical models for investigating the linkage between deforested land surface and the cloud-precipitation components of the water cycle.

NASA’s Earth Science Enterprise is dedicated to understanding the Earth as an integrated system and applying Earth System Science to improve prediction of climate, weather, and natural hazards using the unique vantage point of space.

Original Source: NASA News Release

More Details on Water Vapour Feedback

Image credit: NASA
A NASA-funded study found some climate models might be overestimating the amount of water vapor entering the atmosphere as the Earth warms. Since water vapor is the most important heat-trapping greenhouse gas in our atmosphere, some climate forecasts may be overestimating future temperature increases.

In response to human emissions of greenhouse gases, like carbon dioxide, the Earth warms, more water evaporates from the ocean, and the amount of water vapor in the atmosphere increases. Since water vapor is also a greenhouse gas, this leads to a further increase in the surface temperature. This effect is known as “positive water vapor feedback.” Its existence and size have been contentiously argued for several years.

Ken Minschwaner, a physicist at the New Mexico Institute of Mining and Technology, Socorro, N.M., and Andrew Dessler, a researcher with the University of Maryland, College Park, and NASA’s Goddard Space Flight Center, Greenbelt, Md, did the study. It is in the March 15 issue of the American Meteorological Society’s Journal of Climate. The researchers used data on water vapor in the upper troposphere (10-14 km or 6-9 miles altitude) from NASA’s Upper Atmosphere Research Satellite (UARS).

Their work verified water vapor is increasing in the atmosphere as the surface warms. They found the increases in water vapor were not as high as many climate-forecasting computer models have assumed. “Our study confirms the existence of a positive water vapor feedback in the atmosphere, but it may be weaker than we expected,” Minschwaner said.

“One of the responsibilities of science is making good predictions of the future climate, because that’s what policy makers use to make their decisions,” Dessler said. “This study is another incremental step toward improving those climate predictions,” he added.

According to Dessler, the size of the positive water vapor feedback is a key debate within climate science circles. Some climate scientists have claimed atmospheric water vapor will not increase in response to global warming, and may even decrease. General circulation models, the primary tool scientists use to predict the future of our climate, forecast the atmosphere will experience a significant increase in water vapor.

NASA’s UARS satellite was used to measure water vapor on a global scale and with unprecedented accuracy in the upper troposphere. Humidity levels in this part of the atmosphere, especially in the tropics, are important for global climate, because this is where the water vapor has the strongest impact as a greenhouse gas.

UARS recorded both specific and relative humidity in the upper troposphere. Specific humidity refers to the actual amount of water vapor in the air. Relative humidity relates to the saturation point, the amount of water vapor in the air divided by the maximum amount of water the air is capable of holding at a given temperature. As air temperatures rise, warm air can hold more water, and the saturation point of the air also increases.

In most computer models relative humidity tends to remain fixed at current levels. Models that include water vapor feedback with constant relative humidity predict the Earth’s surface will warm nearly twice as much over the next 100 years as models that contain no water vapor feedback.

Using the UARS data to actually quantify both specific humidity and relative humidity, the researchers found, while water vapor does increase with temperature in the upper troposphere, the feedback effect is not as strong as models have predicted. “The increases in water vapor with warmer temperatures are not large enough to maintain a constant relative humidity,” Minschwaner said. These new findings will be useful for testing and improving global climate models.

NASA’s Earth Science Enterprise is dedicated to understanding the Earth as an integrated system and applying Earth system science to improve prediction of climate, weather and natural hazards using the unique vantage point of space. NASA plans to launch the Aura satellite in June 2004. Along with the Terra and Aqua satellites already in operation, Aura will monitor changes in Earth’s atmosphere.

Original Source: NASA News Release

The Origins of Oxygen on Earth

Image credit: NASA
Christopher Chyba is the principal investigator for The SETI Institute lead team of the NASA Astrobiology Institute. Chyba formerly headed the SETI Institute’s Center for the Study of Life in the Universe. His NAI team is pursuing a wide range of research activities, looking at both life’s beginnings on Earth and the possibility of life on other worlds. Astrobiology Magazine’s managing editor, Henry Bortman, spoke recently with Chyba about several of his team’s projects that will explore the origin and significance of oxygen in Earth’s atmosphere.

Astrobiology Magazine: Many of the projects that members of your team will be working on have to do with oxygen in Earth’s atmosphere. Today oxygen is a significant component of the air we breathe. But on early Earth, there was very little oxygen in the atmosphere. There is a great deal of debate about just how and when the planet’s atmosphere became oxygenated. Can you explain how your team’s research will approach this question?

Christopher Chyba: The usual story, with which you’re probably familiar, is that after oxygenic photosynthesis evolved, there was then a huge biological source of oxygen on early Earth. That’s the usual view. It may be right, and what’s usually the case in these kinds of arguments is not whether one effect is right or not. Probably many effects were active. It’s a question of what was the dominant effect, or whether there were several effects of comparable importance.

SETI Institute researcher Friedemann Freund has a completely non-biological hypothesis about the rise of oxygen, which has some experimental support from laboratory work that he’s done. The hypothesis is that, when rocks solidify from magma, they incorporate small amounts of water. Cooling and subsequent reactions leads to the production of peroxy links (consisting of oxygen and silicon atoms) and molecular hydrogen in the rocks.

Then, when the igneous rock is subsequently weathered, the peroxy links produce hydrogen peroxide, which decomposes into water and oxygen. So, if this is right, simply weathering igneous rocks is going to be a source of free oxygen into the atmosphere. And if you look at some of the quantities of oxygen that Friedemann is able to release from rocks in well-controlled situations in his initial experiments, it might be that this was a substantial and significant source of oxygen on early Earth.

So even apart from photosynthesis, there might be a kind of natural source of oxygen on any Earth-like world that had igneous activity and liquid water available. This would suggest that the oxidation of the surface might be something that you expect to occur, whether photosynthesis happens early or late. (Of course, the timing of this depends on oxygen sinks as well.) I emphasize that’s all a hypothesis at this point, for much more careful investigation. Friedemann’s done only pilot experiments so far.

One of the interesting things about Friedemann’s idea is that it suggests there might be an important source of oxygen on planets completely independent of biological evolution. So there might be a natural driver towards the oxidation of the surface of a world, with all the ensuing consequences for evolution. Or maybe not. The point is to do the work and find out.

Another component of his work, which Friedemann will do with the microbiolologist Lynn Rothschild of NASA Ames Research Center, has to do with this question of whether in environments associated with weathered igneous rocks and the production of oxygen, you could have created micro-environments that would have allowed certain microorganisms living in those environments to have pre-adapted to an oxygen-rich environment. They’ll be doing work with microorganisms to try to address that question.

AM: Emma Banks will be looking at chemical interactions in the atmosphere of Saturn’s moon Titan. How does that tie into understanding oxygen on early Earth?

CC: Emma’s looking at another abiotic way that might be important in oxidizing a world’s surface. Emma does chemical computational models, all the way down to the quantum mechanical level. She does them in a number of contexts, but what’s relevant to this proposal has to do with haze formation.

On Titan – and possibly on the early Earth as well, depending on your model for the atmosphere of the early Earth – there’s a polymerization of methane [the combination of methane molecules into larger hydrocarbon-chain molecules] in the upper atmosphere. Titan’s atmosphere is several percent methane; almost all the rest of it is molecular nitrogen. It’s bombarded with ultraviolet light from the sun. It’s also bombarded with charged particles from Saturn’s magnetosphere. The effect of that, acting on the methane, CH4 , is to break the methane up and polymerize it into longer-chain hydrocarbons.

If you start polymerizing methane into longer and longer carbon chains, each time you add another carbon onto the chain, you’ve got to get rid of some hydrogen. For example, to go from CH4 (methane) to C2H6, (ethane) you have to get rid of two hydrogens. Hydrogen is an extremely light atom. Even if it makes H2, that’s an extremely light molecule, and that molecule’s lost off the top of Titan’s atmosphere, just as it’s lost off the top of the Earth’s atmosphere. If you bleed hydrogen off the top of your atmosphere, the net effect is to oxidize the surface. So it’s another way that gives you a net oxidation of a world’s surface.

Emma’s interested in this primarily with respect to what takes place on Titan. But it’s also potentially relevant as a kind of global oxidizing mechanism for the early Earth. And, bringing nitrogen into the picture, she’s interested in the potential production of amino acids out of these conditions.

AM: One of the mysteries about early life on Earth is how it survived the damaging effects of ultraviolet (UV) radiation before there was enough oxygen in the atmosphere to provide an ozone shield. Janice Bishop, Nathalie Cabrol and Edmond Grin, all of whom are with the SETI Institute, are exploring some of these strategies.

CC: And there are a lot of potential strategies there. One is just being deep enough below the surface, whether you’re talking about the land or the sea, to be completely shielded. Another is to be shielded by minerals within the water itself. Janice and Lynn Rothschild are working on a project that is examining the role of ferric oxide minerals in water as a kind of UV shield.

In the absence of oxygen the iron in water would be present as ferric oxide. (When you have more oxygen, the iron oxidizes further; it becomes ferrous and drops out.) Ferric oxide could potentially have played the role of an ultraviolet shield in the early oceans, or in early ponds or lakes. To investigate how good it is as a potential UV shield, there are some measurements you might want to make, including measurements in natural environments, such as in Yellowstone. And once again there’s a microbiological component to the work, with Lynn’s involvement.

This is related to the project that Nathalie Cabrol and Edmond Grin are pursuing, from a different perspective. Nathalie and Edmond are very interested in Mars. They are both on the Mars Exploration Rover science team. In addition to their Mars work, Nathalie and Edmond explore environments on Earth as Mars analog sites. One of their topics of investigation is strategies for survival in high-UV environments. There’s a lake six kilometers high on Licancabur (a dormant volcano in the Andes). We now know there’s microscopic life in that lake. And we’d like to know what are its strategies for surviving in the high-UV environment there? And that’s a different, very empirical way of getting at this question of how life survived in the high-UV environment that existed on early Earth.

These four projects are all coupled, because they have to do with the rise of oxygen on early Earth, how organisms survived before there was substantial oxygen in the atmosphere, and then, how all this relates to Mars.

Original Source: Astrobiology Magazine

Early Oceans Might Have Had Little Oxygen

Image credit: NASA
As two rovers scour Mars for signs of water and the precursors of life, geochemists have uncovered evidence that Earth’s ancient oceans were much different from today’s. The research, published in this week’s issue of the journal Science, cites new data that shows that Earth’s life-giving oceans contained less oxygen than today’s and could have been nearly devoid of oxygen for a billion years longer than previously thought. These findings may help explain why complex life barely evolved for billions of years after it arose.

The scientists, funded by the National Science Foundation (NSF) and affiliated with the University of Rochester, have pioneered a new method that reveals how ocean oxygen might have changed globally. Most geologists agree there was virtually no oxygen dissolved in the oceans until about 2 billion years ago, and that they were oxygen-rich during most of the last half-billion years. But there has always been a mystery about the period in between.

Geochemists developed ways to detect signs of ancient oxygen in particular areas, but not in the Earth’s oceans as a whole. The team’s method, however, can be extrapolated to grasp the nature of all oceans around the world.

“This is the best direct evidence that the global oceans had less oxygen during that time,” says Gail Arnold, a doctoral student of earth and environmental sciences at the University of Rochester and lead author of the research paper.

Adds Enriqueta Barrera, program director in NSF’s division of earth sciences, “This study is based on a new approach, the application of molybdenum isotopes, which allows scientists to ascertain global perturbations in ocean environments. These isotopes open a new door to exploring anoxic ocean conditions at times across the geologic record.”

Arnold examined rocks from northern Australia that were at the floor of the ocean over a billion years ago, using the new she had method developed by her and co-authors, Jane Barling and Ariel Anbar. Previous researchers had drilled down several meters into the rock and tested its chemical composition, confirming it had kept original information about the oceans safely preserved. The team members brought those rocks back to their labs where they used newly developed technology -called a Multiple Collector Inductively Coupled Plasma Mass Spectrometer-to examine the molybdenum isotopes within the rocks.

The element molybdenum enters the oceans through river runoff, dissolves in seawater, and can stay dissolved for hundreds of thousands of years. By staying in solution so long, molybdenum mixes well throughout the oceans, making it an excellent global indicator. It is then removed from the oceans into two kinds of sediments on the seafloor: those that lie beneath waters, oxygen-rich and those that are oxygen-poor.

Working with coauthor Timothy Lyons of the University of Missouri, the Rochester team examined samples from the modern seafloor, including the rare locations that are oxygen-poor today. They learned that the chemical behavior of molybdenum’s isotopes in sediments is different depending on the amount of oxygen in the overlying waters. As a result, the chemistry of molybdenum isotopes in the global oceans depends on how much seawater is oxygen-poor. They also found that the molybdenum in certain kinds of rocks records this information about ancient oceans. Compared to modern samples, measurements of the molybdenum chemistry in the rocks from Australia point to oceans with much less oxygen.

How much less oxygen is the question. A world full of anoxic oceans could have serious consequences for evolution. Eukaryotes, the kind of cells that make up all organisms except bacteria, appear in the geologic record as early as 2.7 billion years ago. But eukaryotes with many cells-the ancestors of plants and animals- did not appear until a half billion years ago, about the time the oceans became rich in oxygen. With paleontologist Andrew Knoll of Harvard University, Anbar previously advanced the hypothesis that an extended period of anoxic oceans may be the key to why the more complex eukaryotes barely eked out a living while their prolific bacterial cousins thrived. Arnold’s study is an important step in testing this hypothesis.

“It’s remarkable that we know so little about the history of our own planet’s oceans,” says Anbar. “Whether or not there was oxygen in the oceans is a straightforward chemical question that you’d think would be easy to answer. It shows just how hard it is to tease information from the rock record and how much more there is for us to learn about our origins.”

Figuring out just how much less oxygen was in the oceans in the ancient past is the next step. The scientists plan to continue studying molybdenum chemistry to answer that question, with continuing support from NSF and NASA, the agencies that supported the initial work. The information will not only shed light on our own evolution, but may help us understand the conditions we should look for as we search for life beyond Earth.

Original Source: NSF News Release

Ozone Destroying Molecule Found

Image credit: NASA
Using measurements from a NASA aircraft flying over the Arctic, Harvard University scientists have made the first observations of a molecule that researchers have long theorized plays a key role in destroying stratospheric ozone, chlorine peroxide.

Analysis of these measurements was conducted using a computer simulation of atmospheric chemistry developed by scientists at NASA’s Jet Propulsion Laboratory (JPL), Pasadena, Calif.

The common name atmospheric scientists use for the molecule is “chlorine monoxide dimer” since it is made up of two identical chlorine-based molecules of chlorine monoxide, bonded together. The dimer has been created and detected in the laboratory; in the atmosphere it is thought to exist only in the particularly cold stratosphere over Polar Regions when chlorine monoxide levels are relatively high.

“We knew, from observations dating from 1987, that the high ozone loss was linked with high levels of chlorine monoxide, but we had never actually detected the chlorine peroxide before,” said Harvard scientist and lead author of the paper, Rick Stimpfle.

The atmospheric abundance of chlorine peroxide was quantified using a novel arrangement of an ultraviolet, resonance fluorescence-detection instrument that had previously been used to quantify levels of chlorine monoxide in the Antarctic and Arctic stratosphere.

We’ve observed chlorine monoxide in the Arctic and Antarctic for years and from that inferred that this dimer molecule must exist and it must exist in large quantities, but until now we had never been able to see it,” said Ross Salawitch, a co-author on the paper and a researcher at JPL.

Chlorine monoxide and its dimer originate primarily from halocarbons, molecules created by humans for industrial uses like refrigeration. Use of halocarbons has been banned by the Montreal Protocol, but they persist in the atmosphere for decades. “Most of the chlorine in the stratosphere continues to come from human-induced sources,” Stimpfle added.

Chlorine peroxide triggers ozone destruction when the molecule absorbs sunlight and breaks into two chlorine atoms and an oxygen molecule. Free chlorine atoms are highly reactive with ozone molecules, thereby breaking them up, and reducing ozone. Within the process of breaking down ozone, chlorine peroxide forms again, restarting the process of ozone destruction.

“You are now back to where you started with respect to the chlorine peroxide molecule. But in the process you have converted two ozone molecules into three oxygen molecules. This is the definition of ozone loss,” Stimpfle concluded.

“Direct measurements of chlorine peroxide enable us to better quantify ozone loss processes that occur in the polar winter stratosphere,” said Mike Kurylo, NASA Upper Atmosphere Research Program manager, NASA Headquarters, Washington.

“By integrating our knowledge about chemistry over the polar regions, which we get from aircraft-based in situ measurements, with the global pictures of ozone and other atmospheric molecules, which we get from research satellites, NASA can improve the models that scientists use to forecast the future evolution of ozone amounts and how they will respond to the decreasing atmospheric levels of halocarbons, resulting from the implementation of the Montreal Protocol,” Kurylo added.

These results were acquired during a joint U.S.-European science mission, the Stratospheric Aerosol and Gas Experiment III Ozone Loss and Validation Experiment/Third European Stratospheric Experiment on Ozone 2000. The mission was conducted in Kiruna, Sweden, from November 1999 to March 2000.

During the campaign, scientists used computer models for stratospheric meteorology and chemistry to direct the ER-2 aircraft to the regions of the atmosphere where chlorine peroxide was expected to be present. The flexibility of the ER-2 enabled these interesting regions of the atmosphere to be sampled.

Original Source: NASA News Release

Taking the Temperature of a Hurricane’s Eye

Image credit: NASA

When Hurricane Erin was beating up the North Atlantic last year, NASA researchers decided to take its temperature. Using a special aircraft, researchers dropped eight sensors into the area round the storm’s eye, a place that contains the most powerful winds and warmest temperatures. Using this data, they were able to create a three-dimensional image of the complete inner core.

Last year, NASA researchers took the temperature of the eye of Hurricane Erin to determine how a hurricane?s warm center fuels the strength of storms. The new data is helping scientists understand the inner workings of hurricanes at very high altitudes, and will improve future hurricane forecasts.

The researchers found that the warmest portion around a hurricane?s eye is approximately 3.5 miles high and that area in the eye corresponds with falling pressure, which is what causes the winds to spiral inward at destructive speeds.

During September 2001 while flying over the North Atlantic Ocean, scientists aboard NASA?s ER-2 aircraft dropped eight sensors into the area around Hurricane Erin?s eye, containing the strongest thunderstorms and winds, and warmest temperatures. Variations in temperatures within a hurricane provide clues about the storm?s intensity. For example, a warm center marked by a large temperature contrast compared to the rest of the hurricane is a sign of a strong storm.

The sensors measured temperature, air pressure and winds as they fell through the hurricane and transmitted their data back to the ER-2 aircraft. For the first time, the data allowed scientists to create a comprehensive 3-dimensional image of the complete inner core (including the eyewall and the eye) of a hurricane, giving scientists a better look at how heat from warm, rising air spreads out in the storm?s center. The warm, humid, rising air is the key to a hurricane?s power. This rising air draws in air from the surface to take its place, and creates winds.

?Scientists can obtain a detailed look at a hurricane?s heat engine (the warm temperatures that power a storm) by combining the aircraft data with that from satellites such as NASA?s Tropical Rainfall Measurement Mission,? said Jeff Halverson, a scientist from NASA?s Goddard Space Flight Center, Greenbelt, Md., and the University of Maryland Baltimore County.

?The data from the sensors and the satellite have given us a view of the eye?s warm air, the rain clouds that warm the air through condensation, and the spiraling surface winds which in turn create the rain clouds. We have assembled all this data in a three dimensional rendition of the hurricane which is akin to taking a detailed ?CAT scan? of the storm,? Halverson said.

?We found that this storm had a very warm eye, from the ocean to the top of the lower atmosphere at around 10 miles altitude,? said Halverson. The warmest part of Erin?s eye was almost 21 degrees (Fahrenheit) warmer than the surrounding air, a dramatic difference from the air around it. Above 7.5 miles high, the eye?s temperature dropped quickly to the same temperature as the air outside the eye.

The warming temperatures within the hurricane?s eye make the air lighter, so air pressure eases on the surface and falls. When air is cold, the air molecules are dense, and air is heavier. The falling pressure in the hurricane?s eye is what creates swirling destructive winds.

The experiment also discovered that strong rising air currents in Erin caused the tropopause (top of the lower atmosphere) to ?bubble up? or bend, south of the eye?s center. This is indicative of the strength of Hurricane Erin, which was a Category 3 storm at this time.

There are five categories in which hurricanes are classified, the fifth being the most devastating. Category 3 hurricanes, such as Erin have winds between 111-130 mph, and can bring a storm surge of water (wind driven water above tide level) between 9-12 feet to shorelines.

Halverson will be presenting these findings at the AMS Hurricane and Tropical Meteorology Conference in San Diego, Calif. on Tuesday, April 30, 2002 at 9:00 a.m. Pacific time in a session titled ?Thermal Structure of Hurricane Erin?s Core Using Dropsonde Data From 68,000 Feet and Comparison with AMSU Satellite Measurements.?

Original Source: NASA News Release