NASA’s New Climate and Weather Satellite Launches

The National Polar-orbiting Operational Environmental Satellite System Preparatory Project, or NPP, launched successfully on a Delta 2 rocket early today at at 5:48 a.m. EDT 09:48 GMT (or precisely at 2:48:01.828 a.m. PDT, according to NASA’s Twitter feed). The next generation satellite will measure both global climate changes and key weather variables, as well as test new technologies for future Earth observing satellites.

The spacecraft has also successfully separated and is now in orbit. The separation video is below.

Continue reading “NASA’s New Climate and Weather Satellite Launches”

Next Generation Climate and Weather Satellite Ready for Friday Launch

A new satellite that will test key technologies and instruments for the next generation of climate and weather-monitoring satellites is scheduled to launch on Friday, Oct. 28, 2011. The NPOESS Preparatory Project (NPP) mission has a planned liftoff from Vandenberg Air Force Base in California at 5:48 a.m. EDT/2:48 a.m. PDT.

“This is the first mission designed to provide observations for both weather forecasters and climate researchers and will provide data that is critical to climate research,” said Jim Gleason, NPP project scientist during a news briefing last week.
Continue reading “Next Generation Climate and Weather Satellite Ready for Friday Launch”

From the Land of Ice and Snow

Ice-coated mountaintops of Alexander Island, one of the largest islands off Antarctica. Credit: Michael Studinger/NASA.

[/caption]

Views from the window of NASA’s DC-8 reveal sweeping expanses of ice and rock as part of the ongoing 2011 Operation IceBridge survey of Antarctica’s ice cover.

Now in its third season, Operation IceBridge is a six-year-long mission to study the dynamics of the Antarctic and Arctic ice sheets. It’s the largest ever aerial survey of the polar ice and will yield valuable data on the state of Earth’s vast reservoirs of frozen water, including the land and sea underneath and how they are being affected by today’s rapidly changing climate.

The ridges of the Shackleton Range cast shadows onto Antarctica's ice. Credit: Michael Studinger/NASA.

Researchers – like Michael Studinger, who took the incredible photos seen here –  fly over Greenland during the months of March through May and over Antarctica in October and November. NASA’s instrument-laden DC-8 flies over these remote locations at a low altitude of about 1,500 feet, often with little or no advance weather data.

98 percent of Antarctica is covered with ice. Information obtained by Operation IceBridge will be combined with satellite data to create the most accurate models possible of Antarctic ice loss and how it will affect future sea level rise.

Mountains piled with snow and ice rise above the clouds on Alexander Island. Credit: Michael Studinger/NASA.

This season’s Antarctic IceBridge campaign features NASA’s DC-8, at 157 feet long the largest plane in the agency’s airborne research fleet, and will also feature the debut of the Gulfstream V (G-V) operated by the National Science Foundation and National Center for Atmospheric Research.

While the DC-8 flies at low altitudes, the G-V will fly above 30,000 feet to utilize its Land, Vegetation and Ice Sensor (LVIS), which makes detailed topographic studies of the surface.

“With IceBridge, our aim is to understand what the world’s major ice sheets could contribute to sea-level rise. To understand that you have to record how ice sheets and glaciers are changing over time.”

– Michael Studinger, IceBridge project scientist at NASA’s Goddard Space Flight Center in Greenbelt, Md.

The wing of NASA's DC-8 cuts across the frozen expanse of the Brunt Ice Shelf, with its 100-foot-high cliff face. Credit: Michael Studinger/NASA.

Read more about Operation IceBridge here.

Tropical Storm Lee Drenches Gulf Coast as Hurricane Katia Aims for US East Coast

Tropical Storm Lee - Visible image from the GOES-13 satellite on Sunday, Sept. 4 at 9:32 a.m. EDT. It shows the extent of Lee's cloud cover over Louisiana, Mississippi, Alabama and the Florida Panhandle and spread into the Tennessee Valley. The thickest clouds and heaviest rainfall stretch from the northeast to southwest of the center. Credit: NASA/NOAA GOES Project

[/caption]

New imagery from NASA and NOAA satellites taken today (Sept 4) shows the extent of a hurricane season storm currently ravaging the US Gulf Coast and another potentially posing a new threat to US East Coast areas still suffering from the vast destruction caused by Hurricane Irene just days ago. Data from the NASA and NOAA satellites is critical in providing advance warning to government officials and local communities to save human lives and minimize property damage. .

Slow moving Tropical Storm Lee has unleashed strong thunderstorms and heavy rainfall in several Gulf Coast states. Rainfall amounts of up to 7 to 14 inches over the last 48 hours are currently drenching coastal and inland communities – especially in Louisiana, Mississippi and Alabama along a wide swath that extends from Texas to the Florida panhandle.

Isolated pockets of Gulf State areas may see up to 20 inches of rainfall. Severe flooding to homes and roads has occurred in some locations. Winds have diminished from 60 mph on Saturday (Sept. 3) to 45 mph on Sunday.

Imagery and measurements from the Aqua and GOES-13 satellites from NASA and NOAA revealed that TS Lee finally made landfall in Louisiana after two days of drenching rain along the Gulf Coast..

A tropical storm warning is in effect on Sept 4 for New Orleans, Lake Pontchartrain, and Lake Maurepas. Fortunately the rebuilt levees in New Orleans appear to holding in the first serious test since the vast destruction of Hurricane Katrina. Other areas are less lucky.

This infrared image of Tropical Storm Lee on Sept. 3 at 3:47 p.m. EDT when the center was still sitting south of the Louisiana coast. The strongest thunderstorms and coldest clouds (purple) stretched from Mobile Bay, south into the Gulf of Mexico and covered about 1/3rd of the Gulf of Mexico. Winds were 55 mph at the time of this image. The image was taken by the AIRS instrument on NASA's Aqua satellite. Credit: NASA JPL, Ed Olsen NASA

Lee’s tropical force winds now extend out 275 miles from the center. A large part of Lee is still over the Gulf of Mexico where the driving wind and rain affected operations on some oil rigs.

Lee has spawned more than a dozen tornadoes in the Gulf Coast states. The storm is spreading more heavy rain and winds on a northeast to east- northeast heading tracking towards Tennessee over the next 24 to 36 hours according to the latest weather forecasts.

Meanwhile Hurricane Katia is packing winds of 110 MPH and is on a path that could cause it to make landfall on the Outer Banks of North Carolina just a week after the state suffered from Hurricane Irene.

Hurricane Katia has the potential to affect the launch of NASA’s GRAIL Lunar Mappers slated for liftoff on Sept. 8 from Cape Canaveral, Florida, depending on its exact course.

This GOES-13 satellite image shows Hurricane Katia (right), Tropical Depression 13 (left) and System 94L (top). Credit: NASA/NOAA GOES Project

Irene caused extensive flooding and devastation on the hundred year scale in several US states still reeling from flooding and destruction. More than 43 deaths have been reported so far, including emergency rescue workers. Initial damage estimates are over $6 Billion.

Thousands of East Coast homes and businesses are still without power as strong after effects from Irene continue to play out.

President Obama toured flood stricken areas of Paterson, New Jersey today (Sept. 4).

According to a statement by Rob Gutro, of NASA’s Goddard Space Flight Center, Greenbelt, Md; Tropical Storm Lee’s winds had dropped from 60 mph exactly 24 hours before to 45 mph at 8 a.m. EDT on Sept. 4.

Lee’s center was over Vermillion Bay, Louisiana near 29.7 North and 92.0 West. It was crawling to the northeast near 3 mph (6 kmh) and expected to continue in that direction today, turning to the east-northeast tonight. Because Lee’s center is over land, he is expected to continue weakening gradually in the next couple of days. Lee’s outer bands still extend far over the Gulf of Mexico, bringing in more moisture and keeping the system going.

Here's a 3-D look at Tropical Depression 13 from NASA's TRMM Satellite on Sept 1. Some of the highest thunderstorm towers in that area were shown by PR data to reach heights of over 15km (~9.3 miles) and there were areas of heavy rain - which is going to affect the shoreline.. waves of rainfall to move inland. Credit: NASA/Goddard
This visible image of Tropical Storm Lee was taken from the GOES-13 satellite on Saturday, Sept. 3 at 9:32 a.m. EDT. It shows the extent of Lee's cloud cover over Louisiana, Mississippi, Alabama and the Florida Panhandle. The clearing on the southeastern side is a result of drier air moving in and preventing development of thunderstorms. Credit: NASA/NOAA GOES Project

Deadly and Destructive Path of Hurricane Irene seen in NASA Videos and Images

Irene Makes Landfall Over New York. This GOES-13 satellite image is of Hurricane Irene just 28 minutes before the storm made landfall in New York City. The image shows Irene's huge cloud cover blanketing New England, New York and over Toronto, Canada. Shadows in Irene's clouds indicate the bands of thunderstorms that surrounded the storm. Credit: NASA/NOAA GOES Project

NASA Video Caption: The Life of Hurricane Irene from the Caribbean to Canada from August 21 through August 29 seen by NASA/NOAA satellites. Credit: NASA/NOAA/GOES/MODIS

The new NASA animation above shows the birth and subsequent destructive and deadly path followed by Hurricane Irene from August 21 through August 29, 2011 starting in the Caribbean, and then tracking along the US East Cost and up into Canada. The observations combine images taken by NASA and NOAA Earth orbiting satellites.

The cloud images were captured by the NASA/NOAA GOES-13 satellite and overlaid on a true-color NASA MODIS map. Irene followed a lengthy course over Puerto Rico, Hispaniola, the Bahamas, and then along the entire US East with landfalls over North Carolina, New Jersey and New York.

NASA ISS astronaut Ron Garan and cameras flying overhead aboard the International Space Station (ISS) also photographed vivid images showing the magnitude of Irene slamming into the US East coast.

Irene caused widespread property damage. Massive and raging flooding in several US states destroyed houses, crushed businesses and washed away bridges and roads and more. The worst flooding is yet to come to some inland portions of Vermont, New Jersey, New York, Pennsylvania and elsewhere as uncontrollable waters continue to rise at numerous rivers, lakes and even ponds, threatening even more misery in their wake.

[/caption]

So far 41 fatalities in 12 states have been attributed to Irene and more may be expected as searches continue. Some communities have been entirely cut off due to washed out access. Airlifts of food and water have begun. More people are being evacuated from New Jersey towns today, Aug 30.

Brave emergency rescue workers have put their own lives at peril and saved the lives of countless others of all ages from babies to the elderly. Some 8 million customers, including my area, lost power due to extensive flooding, downed trees and electrical wires, and devastated infrastructure.

Hurricane Irene twitpic from the International Space Station on 8/27/11 by NASA Astronaut Ron Garan
Irene From Space and the ISS as it crossed the coast on August 27, 2011 at 3:32pm EST. Hope everyone is OK wrote NASA Astronaut Ron Garan with his twitpic from the ISS. Credit: NASA/Ron Garan aboard the ISS

Emergency crews are hard at work to restore power as quickly as possible, but many thousands of homes and businesses could be without power for up to a week or more. About 3.3 million customers are still without power today.

NASA’s GOES-13 satellite captured a dramatic view of Hurricane Irene just 28 minutes prior to making landfall over New York City. Today’s NASA Image of the day shows the humongous cloud cover spanning the US East coast from the Mid-Atlantic States up to New Jersey, New York, Pennsylvania, and New England and into Toronto, Canada.

This GOES-13 image from Monday, August 29 at 7:45 a.m. EDT shows an active Atlantic Ocean with the remnants of Hurricane Irene moving into Quebec and Newfoundland (left), Tropical Storm Jose (center) and newly formed Tropical Depression 12 (right). Credit: NASA/NOAA GOES Project
Irene slams into North Carolina. The GOES-13 satellite saw Hurricane Irene on August 27, 2011 at 10:10 a.m. EDT after it made landfall at 8 a.m. in Cape Lookout, North Carolina. Irene's outer bands had already extended into New England. Credit: NASA/NOAA GOES Project

Many transit systems and airports in Irene’s path were shutdown ahead of the storm.

Send me your photos of Irene’s destruction to post at Universe Today.

Can We Put Weather On A Budget?

Forecast of surface pressures five days into the future for the north Pacific, North America, and north Atlantic ocean. Credit: NOAA

[/caption]

When Vanguard 2 was launched on February 17, 1959 it became our first orbiting “eye” on Earth’s weather. Although the satellite was unsuccessful in the long run, it paved the way for TIROS-1 about a year later. This in turn opened the avenue for the Nimbus program – the forerunner for today’s NASA and NOAA’s space-based weather observatories. Although our current climate spectators have proven to be not only efficacious, but enduring, the recent economy may spell an end to future pursuits.

With what appears to be crazy changes to our weather in recent times, they may not produce opportunities for climatologists to take advantage of data produced by satellite imaging. However, leaders in all fields of study are emphasizing the importance of continuing the weather satellite programs. “The stakes are high and the challenge is great,” said Earth Science Director Michael Freilich, at a briefing at the Forum on Earth Observation.

The importance of weather prediction affects our world population in more ways than just grabbing an umbrella or getting out your winter coat. Radical ramifications can disrupt logistics and threaten lives. This realization has prompted support from everyone from US President Obama to National Weather Service director Jack Hayes As the director explained, the “what if” synopsis could be very ugly when it comes to above average snowfall, powerful hurricanes or deadly tornadoes. The geostationary satellites portray global weather from a high level standpoint – but the lower, polar orbiters collect far more detailed data in a three to five day window that’s needed to make forecasting by the National Oceanic and Atmospheric Administration possible.

“People tend to talk about forecasts in terms of extreme weather, but it’s also important to collect and study data over the long term to see how things are changing in certain areas and to anticipate the future.” said John Townshend of the University of Maryland. “We’ve got to recognize that climate change is occurring, whether or not you believe in global warming. Climate changes from year-to-year.”

And so do budgets…

Coming Soon – Night Shining Noctilucent Clouds

Noctilucent Cloud Display Credit: Adrian West

[/caption]

Soon you may see an eerie spectacle on clear summer nights if you are located at latitudes between 50° and 70° north and south of the equator: Noctilucent Clouds.

These ghostly apparitions are a delight to see and are quite rare. It is incredibly difficult to predict exactly when they will appear, but we do know they should begin to appear soon.

The season for Noctilucent Clouds (Noctilucent = Latin for “Night Shining”) starts early June and continues into late July. They are seen just after dusk, or before dawn and an apparition can last around an hour.

These mysterious clouds, with their bizarre tenuous wispy shapes reminiscent of ripples in sand or the changing surface of a pool of water, spread like a glowing web across the northern sky. Colours can range from brilliant whites, with tinges of blue, pink and orange.

Formed by tiny ice crystals, they are the highest clouds in the Earth’s atmosphere, located in the mesosphere at altitudes of around 76 to 85 kilometers (47 to 53 miles) almost at the edge of space.

They are normally too faint to be seen, and are visible only when illuminated by sunlight from below the horizon, while the lower layers of the atmosphere are in the Earth’s shadow. Noctilucent clouds are not fully understood and are a recently discovered meteorological phenomenon, only being recorded for about 120 years.

Noctilucent clouds can only form under very restrictive conditions, and their occurrence can be used as a guide to changes in the upper atmosphere. Since their relatively recent classification, the occurrence of noctilucent clouds appears to be increasing in frequency, brightness and extent.

There is evidence that the relatively recent appearance of noctilucent clouds and their gradual increase, may be linked to climate change. Another recent theory is that some of these bright displays come from particulates and water vapour in the atmosphere left over from Space Shuttle launches.

How can you see them? Over the next couple of months look north during dusk and dawn and try and spot this mysterious and elusive phenomenon. They are best seen when the sun is between 6 and 16 degrees below the horizon, and seem to occur more frequently in the Northern hemisphere than the Southern.

Good luck!

Noctilucent clouds over Blair, Nebraska, USA. Credit: Mike Hollingshead

Arctic Ozone Levels Reach All-Time Low

This set of images by the Ozone Monitoring Instrument (OMI) on NASA’s Aura satellite shows March 19, 2010 on the left, and the right shows the same date in 2011. March 2010 had relatively high ozone, while March 2011 has low levels. NASA image by Rob Simmon, with data courtesy of Ozone Hole Watch.

In the past, massive ozone loss over Antarctica has grabbed the headlines. But this year, measurements by several different sources show record levels of stratospheric ozone loss over the Arctic. Scientists say the main reason for the record ozone loss this year is that unusually cold stratospheric temperatures, which have endured later into the season than usual. Scientists say the unusual loss is not catastrophic, but something that needs to be monitored.

The World Meteorological Organization cautioned that people who live in northerly latitudes could get sunburned easier, noting that ozone-depleted air masses extended from the north pole to southern Scandinavia.

The record low temperatures were caused by unusually strong winds, known as the polar vortex, which isolated the atmospheric mass over the North Pole and prevented it from mixing with air in the mid-latitudes.

This has allowed for the formation of polar stratospheric clouds, and the catalytic chemical destruction of ozone molecules occurs on the surface of these clouds which form at 18-25 kilometers height when temperatures drop below -78 C.

[/caption]

This created conditions similar to those that occur every southern hemisphere winter over the Antarctic.
Measurements by ESA’s Envisat satellite, the Ozone Monitoring Instrument (OMI) on NASA’s Aura satellite, and France’s MetOp satellite, as well as observations made since January from the ground and from balloons show all show that 40% of ozone molecules have been destroyed over the Arctic.

Ozone is a protective atmospheric layer found at around 25 km altitude that acts as a sunlight filter shielding life on Earth from harmful ultraviolet rays, which can increase the risk of skin cancer and cataracts in humans and harm marine life.

Stratospheric temperatures in the Arctic usually do vary widely from winter to winter. Last year, temperatures and ozone above the Arctic were very high. The last unusually low stratospheric temperatures over the North Pole were recorded in 1997.

See this link from ESA that shows a animation comparison between 2010 and 2011.

“This depletion is not necessarily a big surprise,” said Paul Newman, an atmospheric scientist and ozone expert at NASA’s Goddard Space Flight Center. “The ozone layer remains vulnerable to large depletions because total stratospheric chlorine levels are still high, in spite of the regulation of ozone-depleting substances by the Montreal Protocol. Chlorine levels are declining slowly because ozone-depleting substances have extremely long lifetimes.”

Ozone “holes” do not form consistently over the North Pole like they do in Antarctica. “Last winter, we had very high lower stratospheric temperatures and ozone levels were very high; this year is just the opposite,” Newman said. “The real question is: Why is this year so dynamically quiet and cold in the stratosphere? That’s a big question with no good answer.”

Scientists will be watching in coming months for possible increases in the intensity of ultraviolet radiation (UV) in the Arctic and mid-latitudes, since ozone is Earth’s natural sunscreen. “We need to wait and see if this will actually happen,” Newman said. “It’s something to look at but it is not catastrophic.”

Scientists are also investigating why the 2011 and 1997 Arctic winters were so cold and whether these random events are statistically linked to global climate change. “In a changing climate, it is expected that on average stratospheric temperatures cool, which means more chemical ozone depletion will occur,” said Mark Weber from the University of Bremen.

Experts say that on a global scale, the ozone layer is still on a long-term course for recovery. But for decades to come, there remains a risk of major ozone losses on yearly or regional scales.

Sources: Nature, ESA, NASA, The Independant Science Daily Earth/Sky Blog

Scientists Predict Arctic Could Be Ice-Free Within Decades

Sea ice data through mid- March 2011. Credit: National Snow and Ice Data Center

[/caption]

Bad news for what is now the beginning of the “melt season” in the Arctic. Right now, the sea ice extent maximum appears to be tied for the lowest ever measured by satellites as the spring begins, according to scientists at the University of Colorado Boulder’s National Snow and Ice Data Center. And because of the trend of how the amount of Arctic sea ice has been spiraling downward in the last decade, some scientists are predicting the Arctic Ocean may be ice free in the summers within the next several decades.

“I’m not surprised by the new data because we’ve seen a downward trend in winter sea ice extent for some time now,” said Walt Meier, a research scienitist with the NSIDC.

The seven lowest maximum Arctic sea ice extents measured by satellites all have occurred in the last seven years, and the from the latest data, the NSIDC research team believes the lowest annual maximum ice extent of 5,650,000 square miles occurred on March 7 of this year.

The maximum ice extent was 463,000 square miles below the 1979-2000 average, an area slightly larger than the states of Texas and California combined. The 2011 measurements were tied with those from 2006 as the lowest maximum sea ice extents measured since satellite record keeping began in 1979.

Virtually all climate scientists believe shrinking Arctic sea ice is tied to warming temperatures in the region caused by an increase in human-produced greenhouse gases being pumped into Earth’s atmosphere.

Meier said the Arctic sea ice functions like an air conditioner for the global climate system by naturally cooling air and water masses, playing a key role in ocean circulation and reflecting solar radiation back into space. In the Arctic summer months, sunlight is absorbed by the growing amounts of open water, raising surface temperatures and causing more ice to melt.

“I think one of the reasons the Arctic sea ice maximum extent is declining is that the autumn ice growth is delayed by warmer temperatures and the ice extent is not able to ‘catch up’ through the winter,” said Meier. “In addition, the clock runs out on the annual ice growth season as temperatures start to rise along with the sun during the spring months.”

Since satellite record keeping began in 1979, the maximum Arctic sea ice extent has occurred as early as Feb. 18 and as late as March 31, with an average date of March 6. Since the researchers determine the maximum sea ice extent using a five-day running average, there is small chance the data could change.

As of March 22, ice extent declined for five straight days. But February and March tend to be quite variable, so there is still a chance that the ice extent could expand again. Ice near the edge is thin and is highly sensitive to weather, scientists say, moving or melting quickly in response to changing winds and temperatures, and it often oscillates near the maximum extent for several days or weeks, as it has done this year.

In early April the NSIDC will issue a formal announcement on the 2011 maximum sea ice extent with a full analysis of the winter ice growth season, including graphics comparing 2011 to the long-term record.

Source: NSIDC, University of Colorado-Boulder

NASA: Happy St. Paddy’s Day!

Collection of Ireland images, captured from the AIRS instrument onboard NASA's Aqua satellite on March 3. Credit: NASA JPL, Ed Olsen/ Henry Kline

[/caption]

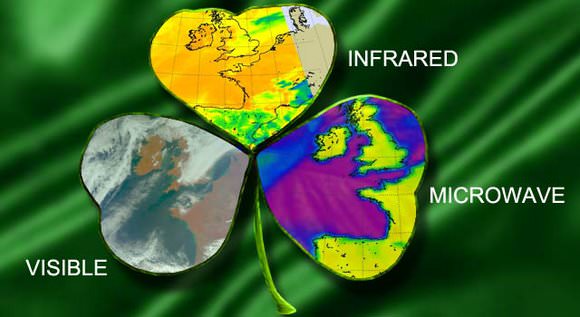
With the luck o’ the Irish, NASA’s Aqua satellite was fortunate to capture mostly clear views of the Emerald Isle in these near-infrared/visible, infrared and microwave light views acquired by Aqua’s Atmospheric Infrared Sounder (AIRS) instrument. And with holiday flair, the agency has arranged the images into a clover and released them as a St. Paddy’s Day treat.

From the press release:

Ireland, located in the Atlantic Ocean, is the third-largest island in Europe, and originated the St. Patrick’s Day holiday. Located west of Great Britain and separated from it by the Irish Sea, it is surrounded by hundreds of islands and islets. In March, Ireland’s average daytime high temperature is near 9.4 degrees Celsius (49 degrees Fahrenheit) and its average nighttime low temperature is near 3.3 degrees Celsius (38 degrees Fahrenheit).

The AIRS instrument measures temperatures of land, sea and air to provide a better understanding of what is happening in those environments. The March 3 images reveal temperatures near the surface that were near normal for this time of year.

NASA’s Aqua satellite circles Earth pole-to-pole 15 times a day in a sun-synchronous orbit to provide data and images to researchers in Earth, ocean and atmospheric sciences. When Aqua passed over Ireland on March 3, it captured visible, infrared and microwave images: a clover of images from one instrument.

The false-color near-infrared/visible image revealed a mostly cloud-free country, except for the northernmost area, as a cold front approached from the west. Also visible were some of the navigable rivers that extend inland.

The visible image also showed areas over the North Sea, Spain and the French-Italian border region where the clouds were heavy enough to confine AIRS infrared data to the higher regions of the atmosphere above the cloud tops. Over the Pyrenees at the Spanish-French border and the Alps at the French-Italian border, the clouds were heavy enough (and contained some precipitation) so that the surface is not visible even using the microwave wavelength.

The infrared image showed that the clouds approaching Ireland from the west were low clouds associated with the cold front moving east. There were no areas of high, cold clouds that would indicate convection and the possibility of thunderstorms. “The brightness temperature of the island is approximately 283 Kelvin, which amounts to 10 degrees Celsius or 50 degrees Fahrenheit,” said Ed Olsen of NASA’s Jet Propulsion Laboratory in Pasadena, Calif. Olsen provides images for the AIRS instrument. “This brightness temperature is a combination of the temperature of the near-surface air temperature and the (land) surface temperature. This is close to the ambient temperature that the population there experienced outdoors.”

The microwave brightness temperature is a bit colder than the infrared temperature data, approximately 273 Kelvin, which is just at the freezing point for water (0 degrees Celsius/32 degrees Fahrenheit). Olsen noted, “The major component of the 89 gigahertz radiances is due to emissions from the surface to about a centimeter below the surface.” He said the temperature of the ground just below the (land surface) that is warmed by the sun is colder–after all, it is still winter in Ireland.

AIRS infrared data can measure cold, high cloud tops in thunderstorms and tropical cyclones, warm or cold ocean waters and land surfaces. Cloud top temperatures, for example, provide clues to scientists about the power of the thunderstorms. The colder the clouds are, the higher they are, and the more powerful the thunderstorms. When AIRS measures cloud temperatures as cold as or colder than minus 52 degrees Celsius (minus 63 degrees Fahrenheit), that indicates high cloud tops, strong convection and the likelihood of powerful thunderstorms.

Data from the Advanced Microwave Sounding Unit (AMSU), another of the AIRS suite of instruments on Aqua, are used to create microwave images. Cold areas in AMSU images can indicate where there is precipitation or ice in cloud tops.

Every day, NASA’s Aqua satellite looks at conditions around the globe, just like looking over a clover (in this case, a three-leafed or imaged one) that it looked at before.

Source: NASA release, via Eurekalert