Cirrus clouds in the Martian atmosphere may have helped keep Mars warm enough for liquid water to sculpt the Martian surface. Image: Mars Exploration Rover Mission, Cornell, JPL, NASA
Many features on the surface of Mars hint at the presence of liquid water in the past. These range from the Valles Marineris, a 4,000 km long and 7 km deep system of canyons, to the tiny hematite spherules called “blueberries“. These features suggest that liquid water played a vital role in shaping Mars.
Some studies show that these features have volcanic origins, but a new study from two researchers at the Carl Sagan Institute and the NASA Virtual Planet Laboratory put the focus back on liquid water. The model that the two came up with says that, if other conditions were met, cirrus clouds could have provided the necessary insulation for liquid water to flow. The two researchers, Ramses M. Ramirez and James F. Kasting, constructed a climate model to test their idea.
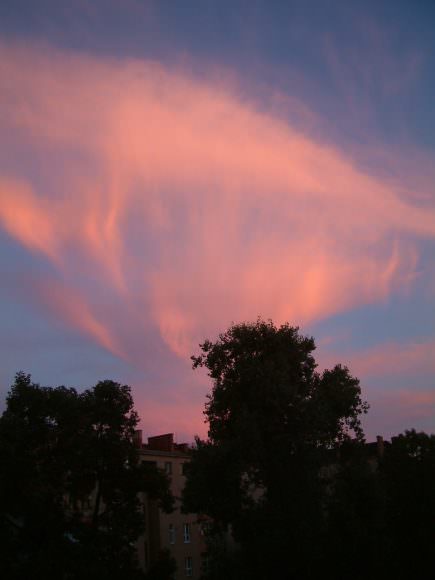
Cirrus clouds are thin, wispy clouds that appear regularly on Earth. They’ve also been seen on Jupiter, Saturn, Uranus, possibly Neptune, and on Mars. Cirrus clouds themselves don’t produce rain. Whatever precipitation they produce, in the form of ice crystals, evaporates before reaching the surface. The researchers behind this study focussed on cirrus clouds’ because they tend to warm the air underneath them by 10 degrees Celsius.
Cirrus clouds over Poznan, Poland. Image: Radomil, http://creativecommons.org/licenses/by-sa/3.0/
If enough of Mars was covered by cirrus clouds, then the surface would be warm enough for liquid water to flow. On Earth, cirrus clouds cover up to 25% of the Earth and have a measurable heating effect. They allow sunlight in, but absorb outgoing infrared radiation. Kasting and Ramirez sought to show how the same thing might happen on Mars, and how much cirrus cloud cover would be necessary.
The cirrus clouds themselves wouldn’t have created all the warmth. Impacts from comets and asteroids would have created the heat, and extensive cirrus cloud cover would have trapped that heat in the Martian atmosphere.
The two researchers conducted a model, called a single-column radiative-convective climate model. They then tested different ice crystal sizes, the portion of the sky covered by cirrus clouds, and the thicknesses of those clouds, to simulate different conditions on Mars.
A color mosaic of Candor Chasma (part of Mars’ Valles Marineris) based on data from Voyager 1 and Voyager 2. Credit: NASA
They found that under the right circumstances, the clouds in the early Martian atmosphere could last 4 to 5 times longer than on Earth. This favors the idea that cirrus clouds could have kept Mars warm enough for liquid water. However, they also found that 75% to 100% of the planet would have to be covered by cirrus. That amount of cloud cover seems unlikely according to the researchers, and they suggest that 50% would be more realistic. This figure is similar to Earth’s cloud cover, including all cloud types, not just cirrus.
As they adjusted the parameters of their model, they found that thicker clouds and smaller particle sizes reduced the heating effect of the cirrus cloud cover. This left a very thin set of parameters in which cirrus clouds could have kept Mars warm enough for liquid water. But their modelling also showed that there is one way that cirrus clouds could have done the job.
If the ancient Martian surface temperature was lower than 273 Kelvin, the value used in the model, then it would be possible for cirrus clouds to do their thing. And it would only have to be lower by 8 degrees Kelvin for that to happen. At times in Earth’s past, the surface temperature has been lower by 7 degrees Kelvin. The question is, might Mars have had a similarly lower temperature?
So, where does that leave us? We don’t have a definitive answer yet. It’s possible that cirrus clouds on Mars could have helped to keep the planet warm enough for liquid water. The modelling done by Ramirez and Kasting shows us what parameters were required for that to happen.
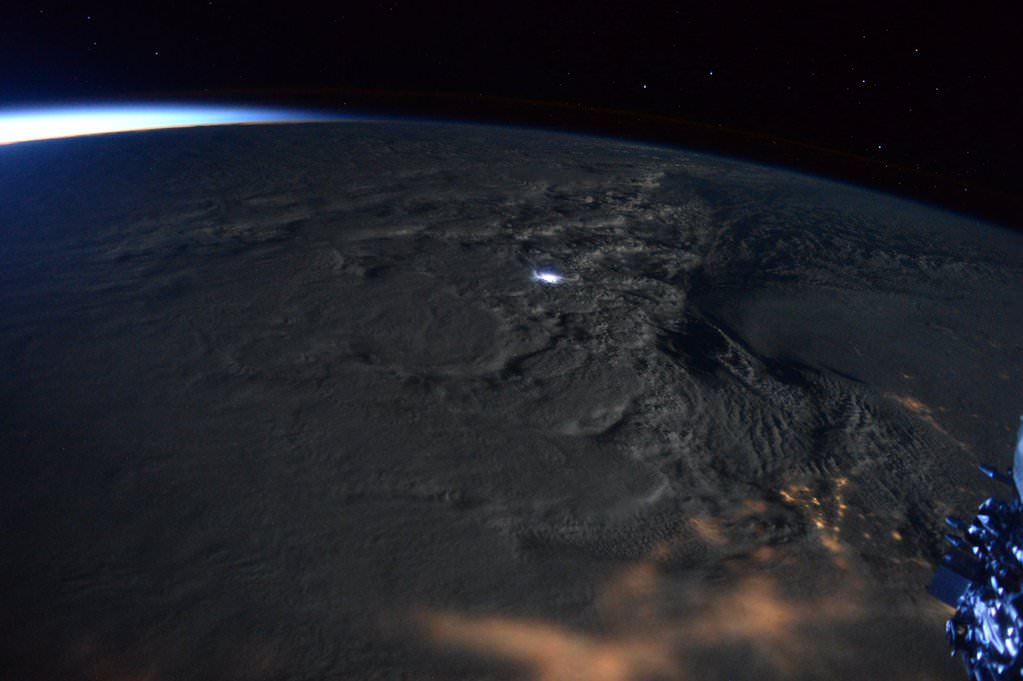
Rare #thundersnow visible from @Space_Station in #blizzard2016! Jan. 23, 2016. Credit: NASA/Scott Kelly/@StationCDRKelly
Rare #thundersnow visible from @Space_Station in #blizzard2016! Jan. 23, 2016. Credit: NASA/Scott Kelly/@StationCDRKelly
NEW JERSEY – NASA astronaut Scott Kelly captured a rare and spectacular display of ‘thundersnow’ from space as Snowzilla’s blast pummeled much of the US East Coast this weekend with two feet or more of paralyzing snow from the nations’ capital to New York City and beyond.
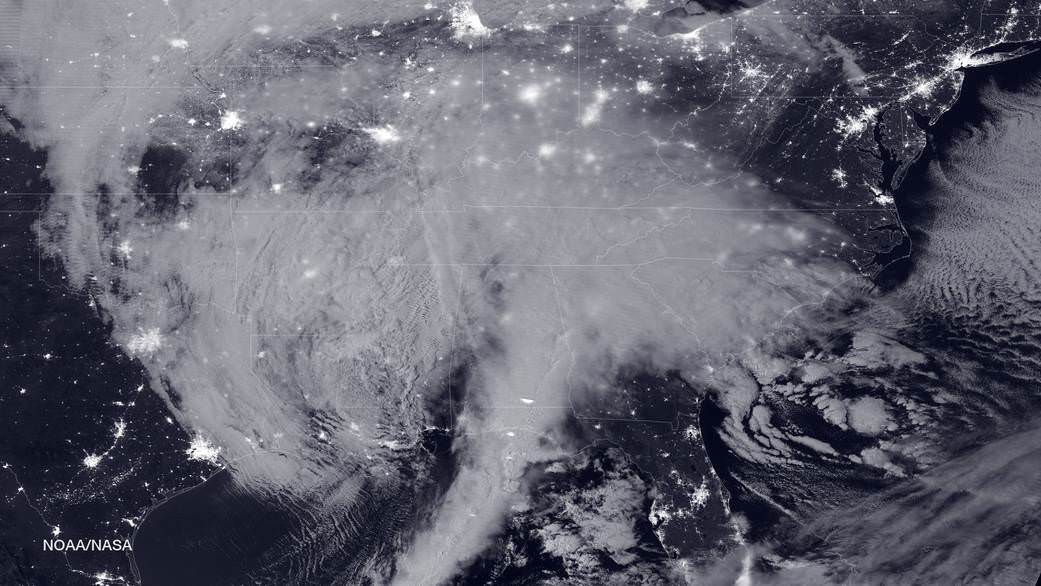
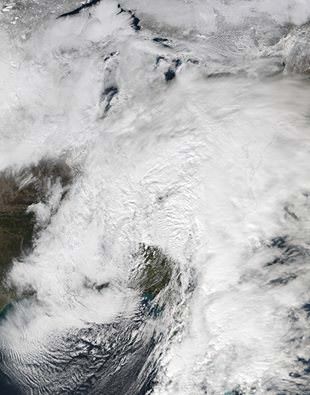
NASA-NOAA's Suomi NPP satellite snapped this image of the approaching blizzard around 2:35 a.m. EST on Jan. 22, 2016 using the Visible Infrared Imaging Radiometer Suite (VIIRS) instrument's Day-Night band. Credit: NOAA/NASA
NASA-NOAA’s Suomi NPP satellite snapped this image of the approaching blizzard around 2:35 a.m. EST on Jan. 22, 2016 using the Visible Infrared Imaging Radiometer Suite (VIIRS) instrument’s Day-Night band. Credit: NOAA/NASA
NEW JERSEY- The monstrous ‘Blizzard of 2016’ predicted by weather forecasters for days has struck a wide swath of the US East Coast from the Gulf coast to the Carolinas to New York and soon into New England, with full fury today, Friday, Jan. 22.
NASA and NOAA satellites are tracking the storm which is already inundating the biggest population centers, affecting some 85 million people in 20 states up and down the Atlantic Coast, as it moves in a northeasterly direction.
This afternoon, NASA and NOAA released a series of eyepopping satellite images showing the massive extent of the storm, which may drop historic amounts of snow on Washington DC and other cities over the next 24 to 48 hours.
The two agencies released a particularly striking image, shown above, showing the storm swarming over virtually the entire eastern half of the continental US as it was barreling towards the East coast cites.
It was taken Friday afternoon by the NASA-NOAA’s Suomi NPP satellite showing the approaching blizzard around 2:35 a.m. EST on Jan. 22, 2016 using the Visible Infrared Imaging Radiometer Suite (VIIRS) instrument’s Day-Night band.
States of Emergency have been declared by Governors of states from the mid-Atlantic to New England, including North Carolina, Virginia, Maryland, New York, Pennsylvania, New Jersey, Kentucky, Georgia, Tennessee, West Virginia, the District of Columbia and the list is growing.
The heaviest snowfall is expected in and around Washington DC with estimates of 24 inches of snow or more. 18 to 24 inches may fall along the metropolitan Northeast corridor on Baltimore, Philadelphia, Trenton and New York City.
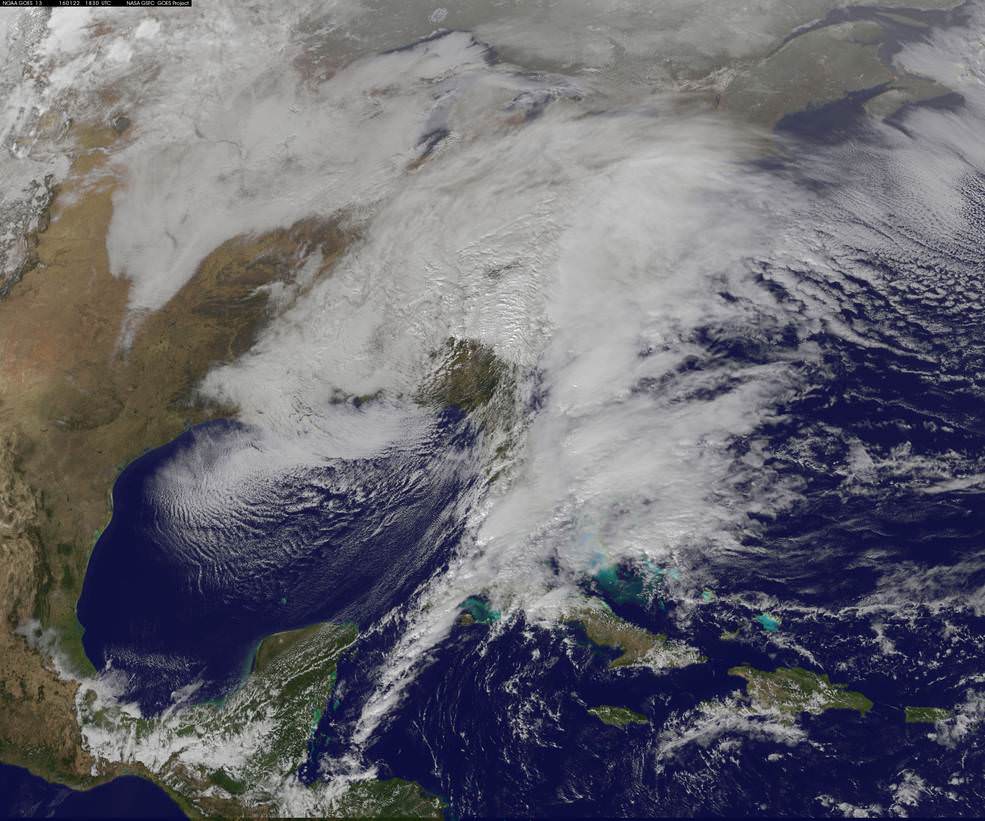
This visible image from NOAA’s GOES-East satellite at 1830 UTC (1:30 p.m. EST) on Jan. 22, 2016 shows the major winter storm now affecting the U.S. East coast. Credits: NASA/NOAA GOES Project
The heavy, blinding snow was already hitting Virginia and Washington by Friday afternoon. Governors, Mayors and Federal officials warned drivers to get off the roads by early Friday afternoon.
Stay off the roadways !!
Widespread treacherous driving with icy roads, sleet, rain, low visibility and whiteout conditions are causing numerous auto accidents as the blizzard bashes the region.
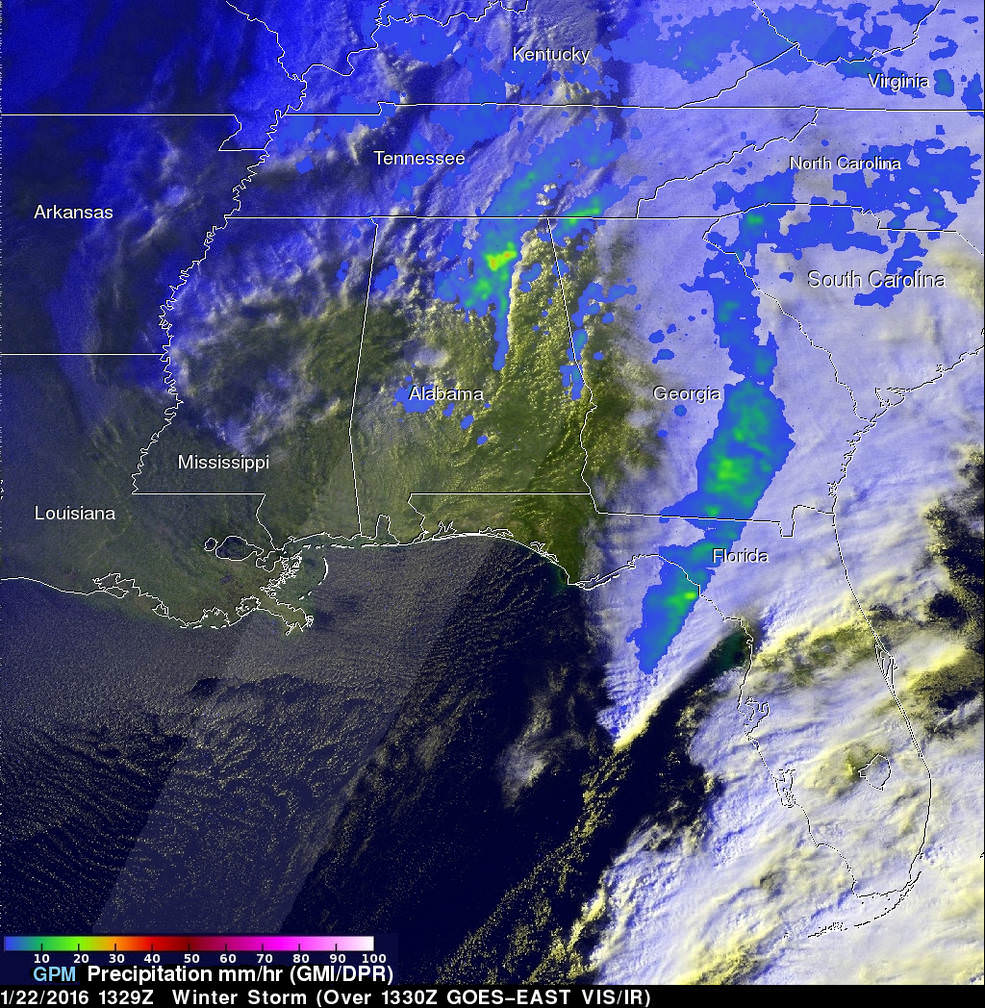
“The winter storm that caused damage during the night along the Gulf Coast has deepened and has started to spread heavy rain, freezing rain, sleet and snow northward into the Mid-Atlantic region. NASA’s GPM and NOAA’s GOES satellites are providing data on rainfall, cloud heights, extent and movement of the storm” wrote NASA’s Rob Gutro in an update on Friday.
On January 22 at 1329 UTC (8:29 a.m. EST) the GPM core satellite saw precipitation falling at a rate of over 64 mm (2.5 inches) per hour in storms over northern Alabama. Credits: SSAI/NASA/JAXA, Hal Pierce
The National Weather Service (NWS) Weather Prediction Center in College Park, Maryland said “An area of low pressure centered over the southeastern U.S. will continue developing into a major winter storm which will impact a large portion of the East Coast from the southern Appalachians through the Mid-Atlantic States from Friday into the weekend. Snowfall totals may exceed 2 feet in portions of these areas, including the Baltimore and Washington D.C. metropolitan areas.”
The monster storm has already caused at least ten deaths. Thousands of motorists are stranded.
High winds up to 55 mph are expected to batter the New Jersey shore, causing significant beach erosion, coastal flooding and property destruction in the same areas devastated by Superstorm Sandy. Thousands of people have been evacuated.
The blizzard has also impacted the US Presidential campaigns and forced New Jersey Governor Chris Christie to temporary cancel campaign appearances in New Hampshire on Friday and Saturday, to deal first hand with the storm back home.
Heavy ice and snow accumulations could cause falling tress resulting in downed power lines and days long power outages during brutally cold temperatures.
Here’s a cool supercomputer animation model:
Video caption: A NASA Center for Climate Simulation supercomputer model that shows the flow of #Blizzard2016 thru Sunday, January 24, 2015. Credit: NASA
Many airports have been closed and some seven thousand flights have also been canceled.
The storm is expected to last into Sunday, Jan. 24
Looking massive from space…. This view of the winter storm over the eastern United States was captured on Friday, January 22, 2016 at 1:55 pm ET via the Visible Infrared Imaging Radiometer Suite (VIIRS) instrument on the Suomi NPP satellite. Credit: NASA/Goddard/Suomi NPP/VIIRS
Stay tuned here for Ken’s continuing Earth and Planetary science and human spaceflight news.
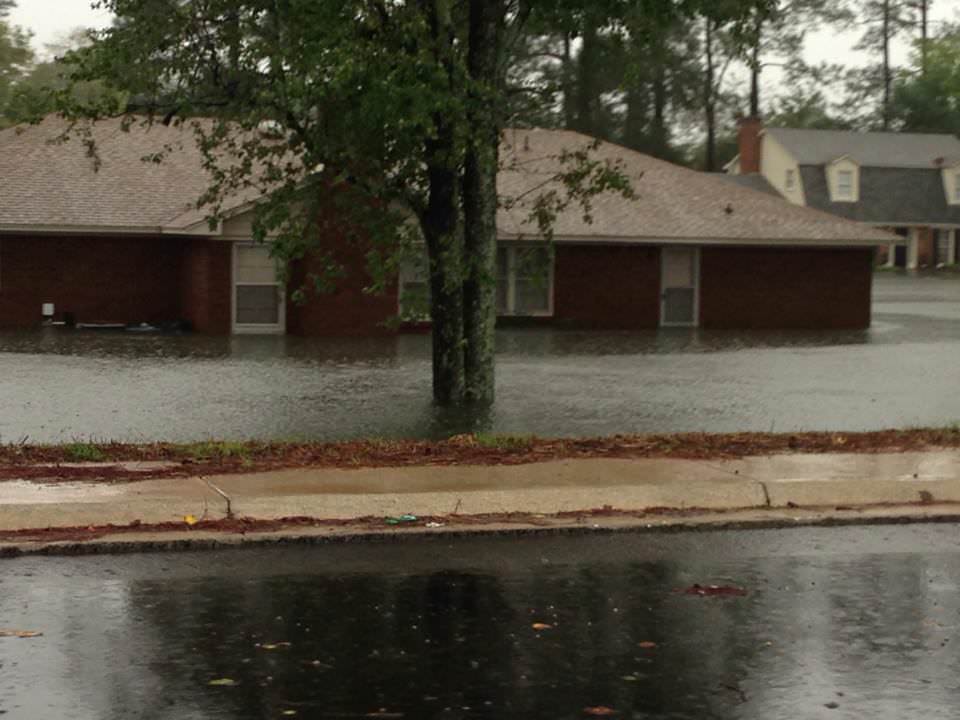
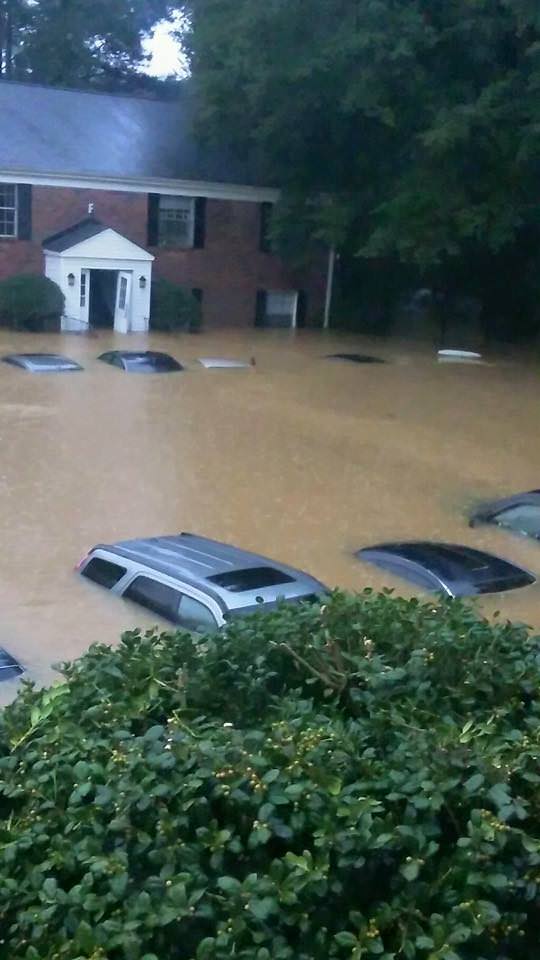
Flooded streets and houses in South Carolina. Credit: Hap Griffin
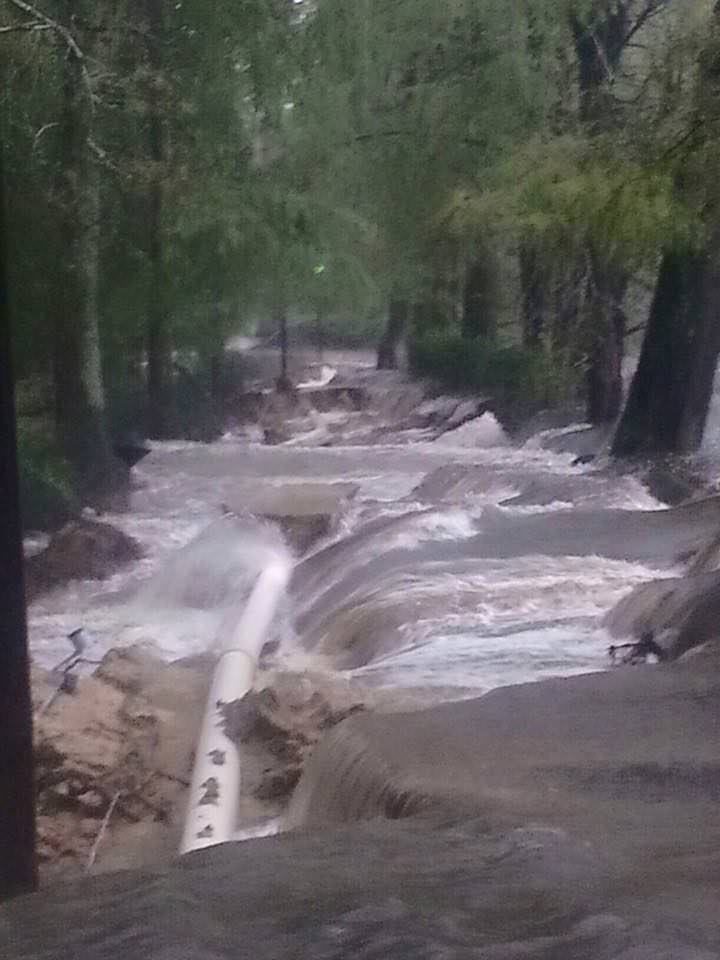
Video Caption: NASA/JAXA’s GPM satellite measured record rainfall that fell over the Carolinas from September 26 to October 5, 2015 from a plume of moisture from Hurricane Joaquin when it was located over the Bahamas and moved to Bermuda. The IMERG showed highest rainfall totals near 1,000 mm (39.3 inches) in a small area of South Carolina and rainfall between 700 and 900 mm (27.5 and 37.4 inches) over a large area of South Carolina. Credits: SSAI/NASA/JAXA, Hal Pierce See below ground level images and videos of storm devastation Story updated with additional details/imagery from NASA and South Carolina
South Carolina Gov. Nikki Haley declared the historic and torrential rain fall to be a “1000 Year event” on Sunday, Oct. 4. “We have never seen anything like this.” Governor Haley and President Obama issued a “State of Emergency.”
Although the horrendous rains in South Carolina may nearly be done, the nor’easter caused damage estimated to be in the Billions of Dollars and at least 9 storm related deaths as of today, Monday, Oct. 5.
Rainfall totals ranging from 14 to 37 inches in local areas over the past week drenched a wide swath of the Palmetto state with never before seen flooding, according to NASA and NOAA. The most intense periods of rain fell over the weekend.
See herein a gallery of photos from friends and others living through the disaster in South Carolina.
NASA astronaut Scott Kelly also captured dramatic images of Hurricane Joaquin – as I reported earlier here.
A slew of NASA and NOAA orbiting weather satellites are constantly tracking the fierce storms and providing the state and federal governments with the most up to date forecasts to aid officials and emergency responders in evaluating and managing the disaster in the most effective manner possible.
NASA’s GPM and a global fleet of other international weather monitoring satellites gathered measurements every 30 minutes from September 26 to October 5, 2015 that were combined into the eyepoppongly dramatic IMERG (Integrated Multi-satellitE Retrievals for GPM) color-coded video above. It tracks the massive growth, spread and direction of the storms and shows the historic levels of destructive precipitation generated by the lethal pair of powerful storms.
The NASA GPM video shows plumes of moisture from the Nor’Easter and Hurricane Joaquin as they gather force and moved over South Carolina and through the Caribbean around and over the Bahamas and later as Joaquin fortunately veered away from the US eastern seaboard towards Bermuda.
“The IMERG showed highest rainfall totals near 1,000 mm (39.3 inches) in a small area of South Carolina and rainfall between 700 and 900 mm (27.5 and 37.4 inches) over a large area of South Carolina,” says NASA’s Hal Pierce.
Here’s a NASA video with NASA scientist Dalia Kirschbaum describing how GPM can see inside a hurricane to makes rainfall and precipitation measurements in 3D:
Video caption: NASA scientist Dalia Kirschbaum explains how the Global Precipitation Measurement Mission’s Core observatory has an instrument that can see layer by layer through a storm.
The GPM precipitation measurements come from both of its advanced radar instruments – the dual-frequency precipitation (DPR) radar instrument (Ku and Ka band) and the GPM microwave imager (GMI), NASA scientist George Huffman told Universe Today.
The IMERG video is based on an algorithm that also carefully combines and calibrates measurements gathered every 30 minutes from the passive microwave sensors flying aboard a large international constellation of satellites from the US, Europe, Japan and India – and outlined in complete detail further below by NASA’s Huffman and Kirschbaum; exclusively for Universe Today.
The visualization of data was created by NASAs Goddard’s Space Flight Center and shows Hurricane Joaquin around the Bahamas “when it was a tropical storm. Red and green colors show rain and the ice and snow at the top of the storm is visualized in blue.”
“Understanding hurricane structure helps weather forecasters around the world determine a storm’s structure and where it may be going,” says Kirschbaum.
Hurricane Joaquin was still packing winds exceeding 125 mph this morning, but it has lost strength throughout the day.
Over 40,000 homes and businesses are without power today, Oct. 5, in South Carolina due to the unending rain and widespread catastrophic flooding. And many folks had to be evacuated.
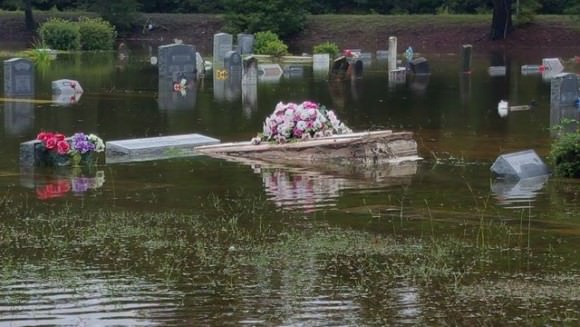
Some cemeteries were uprooted with caskets seen floating down flooded streets.
Residents are warned to stay out of the flood waters and standing waters that can be carrying bacteria and diseases presenting a significant health hazard.
In the capitol city of Columbia, there was widespread flooding with severe damage to water mains that cut off drinking water to over 15,000 people.
The governor deployed over 1300 national guard troops to render assistance. Over 150 folks were rescued by helicopter, some from the rooftops of their homes and apartments.
Here’s a helicopter rescue:
Video: Helicopter Rescue at Lakewood Links in Sumter, SC on Oct 4, 2014. Credit: Sean Reyes
Scores of South Carolina residents were getting rescued by canoes and even boats where waters surged in places up to 25 feet above normal.
At least 9 dams have been breached statewide, as well as levees, requiring many thousands people more to be evacuated.
Dam at Swan Lake in South Carolina on Oct. 4, 2015. Credit: Edwin Corning
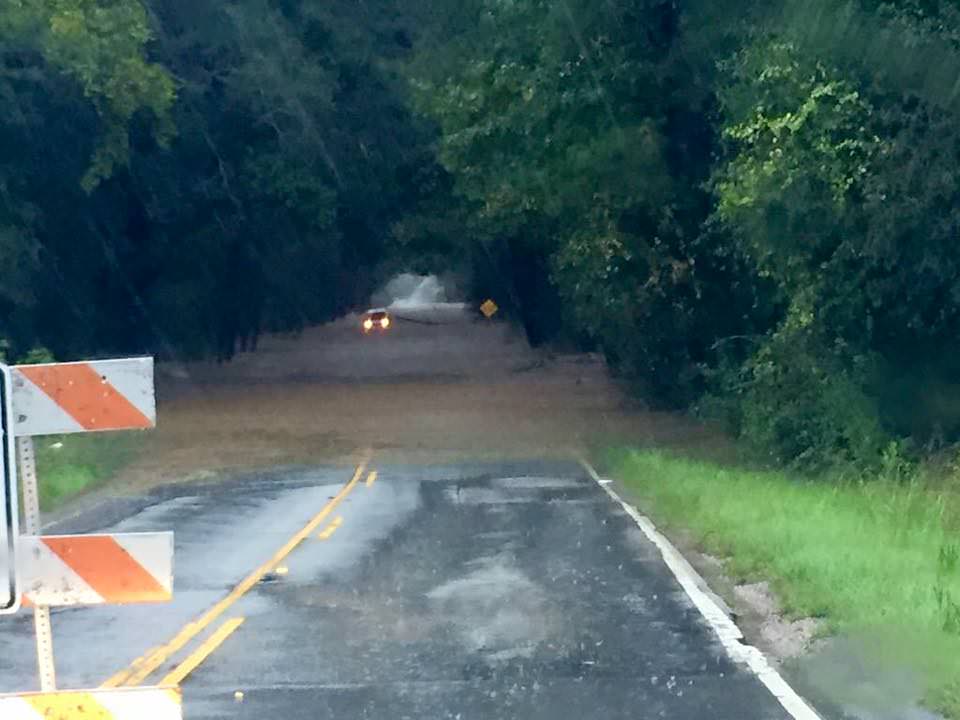
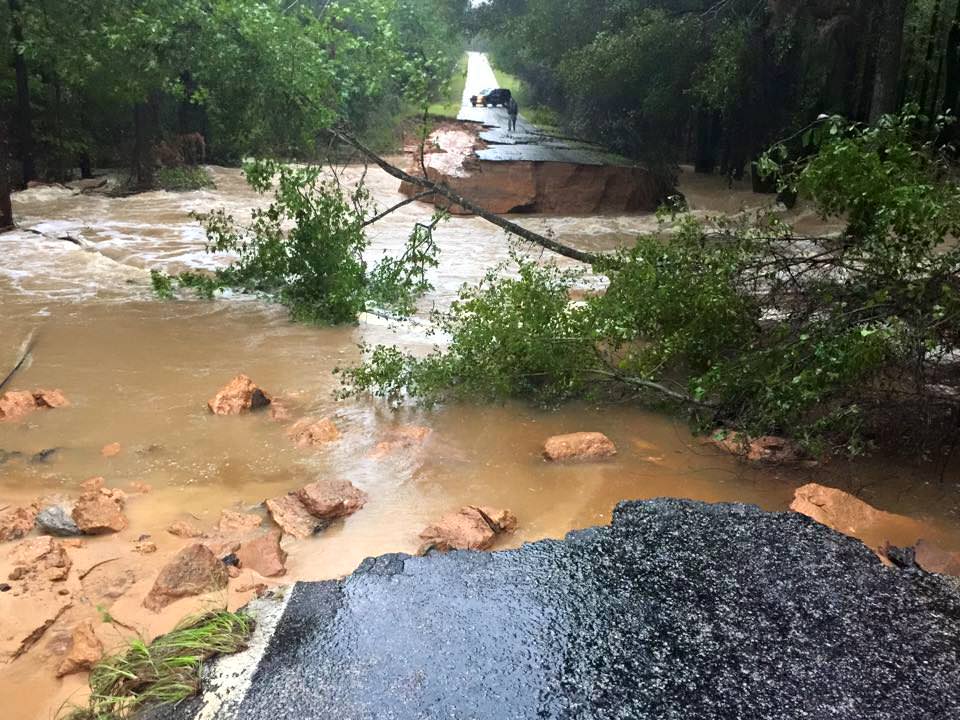
Governor Haley confirmed that over 550 roads were either closed, damaged or destroyed, including back roads and major interstate highways vital to the states and US national economy.
A 70 mile stretch of I-95, a major north-south artery traveled by millions including myself, was closed to all traffic on Sunday and remains closed today. And many side roads that could serve as potential detours are also closed.
Historically high water levels in some of the areas worst hit by flooding has finally receded. But in other areas water levels are rising.
In addition, the US Coast Guard says the cargo ship ‘El Faro’ with 33 people aboard is believed to have sunk because it ventured straight into Hurricane Joaquin. The ship’s crew included 28 Americans and 5 Polish sailors. It sank in the area popularly known as the ‘Bermida Triangle’ in water some 3 miles deep.
Today, the Coast Guard reported the discovery of a debris field over 25-square-miles wide. At least one crew member has already been found dead.
The El Faro set out from the port of Jacksonville on Tuesday when Joaquin was a tropical storm with 85 mph wind speed.
The last distress call on last Thursday morning, as the ship neared the eye of the Hurricane, then a Category 3. The ship was listing over 15 degrees surrounded by 30 foot high waves.
The hurricane quickly grew into a Cat 4 and no further word was heard from the ship. It may be 3 miles underwater at the bottom of the Atlantic Ocean.
How and from which fleet of satellites does NASA obtain the orbital measurements used to create the high resolution, color-coded GPM IMERG visualizations?
“The Integrated Multi-satellitE Retrievals for GPM (IMERG) creates a merged precipitation product from the GPM constellation of satellites. These satellites include DMSPs from the U.S. Department of Defense, GCOM-W from the Japan Aerospace Exploration Agency (JAXA), Megha-Tropiques from the Centre National D’etudies Spatiales (CNES) and Indian Space Research Organization (ISRO), NOAA series from the National Oceanic and Atmospheric Administration (NOAA), Suomi-NPP from NOAA-NASA, and MetOps from the European Organisation for the Exploitation of Meteorological Satellites (EUMETSAT),” NASA scientists George Huffman and Dalia Kirschbaum told me exclusively for Universe Today.
“All of the instruments (radiometers) onboard the constellation partners are intercalibrated with information from the GPM Core Observatory’s GPM Microwave Imager (GMI) and Dual-frequency Precipitation Radar (DPR). The data are gridded at 0.1°x0.1° lat./lon and provided in 30 minute time slices through morphing between satellite overpasses. The satellite estimates are then calibrated with rainfall gauge information.”
Here’s another GPM visualization of Hurricane Joaquin:
Stay tuned here for Ken’s continuing Earth and planetary science and human spaceflight news.
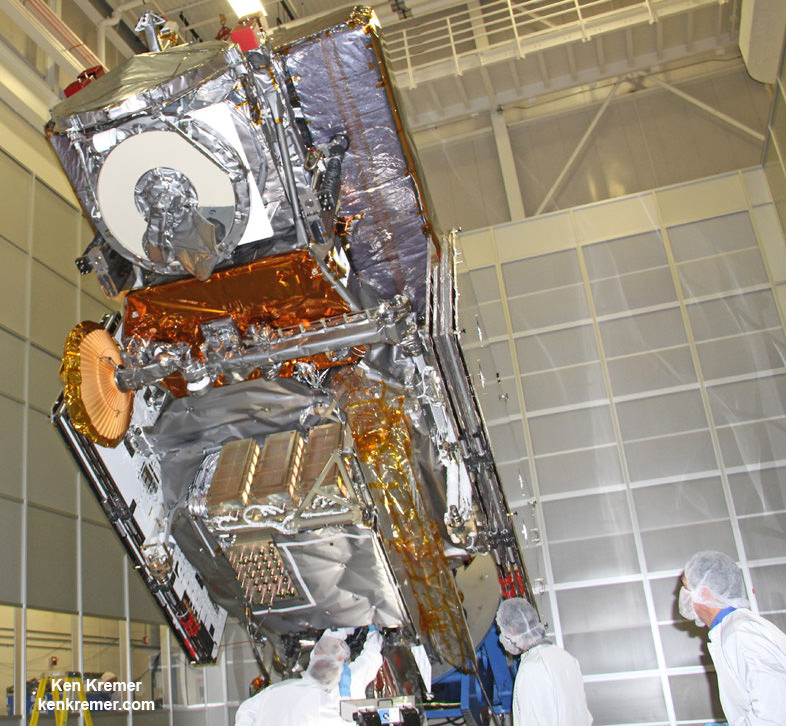
Hurricane Joaquin captured on Oct. 2, 2015 by NASA Astronaut Scott Kelly from the International Space Station. Credit: NASA/Scott Kelly NASA’s next generation Global Precipitation Measurement (GPM) observatory inside the clean room at NASA Goddard Space Flight Center, MD. Technicians at work on final processing during exclusive up-close inspection tour by Universe Today. GPM wasn successfully launched on February 27, 2014 and will provide global measurements of rain and snow every 3 hours. Credit: Ken Kremer/kenkremer.com
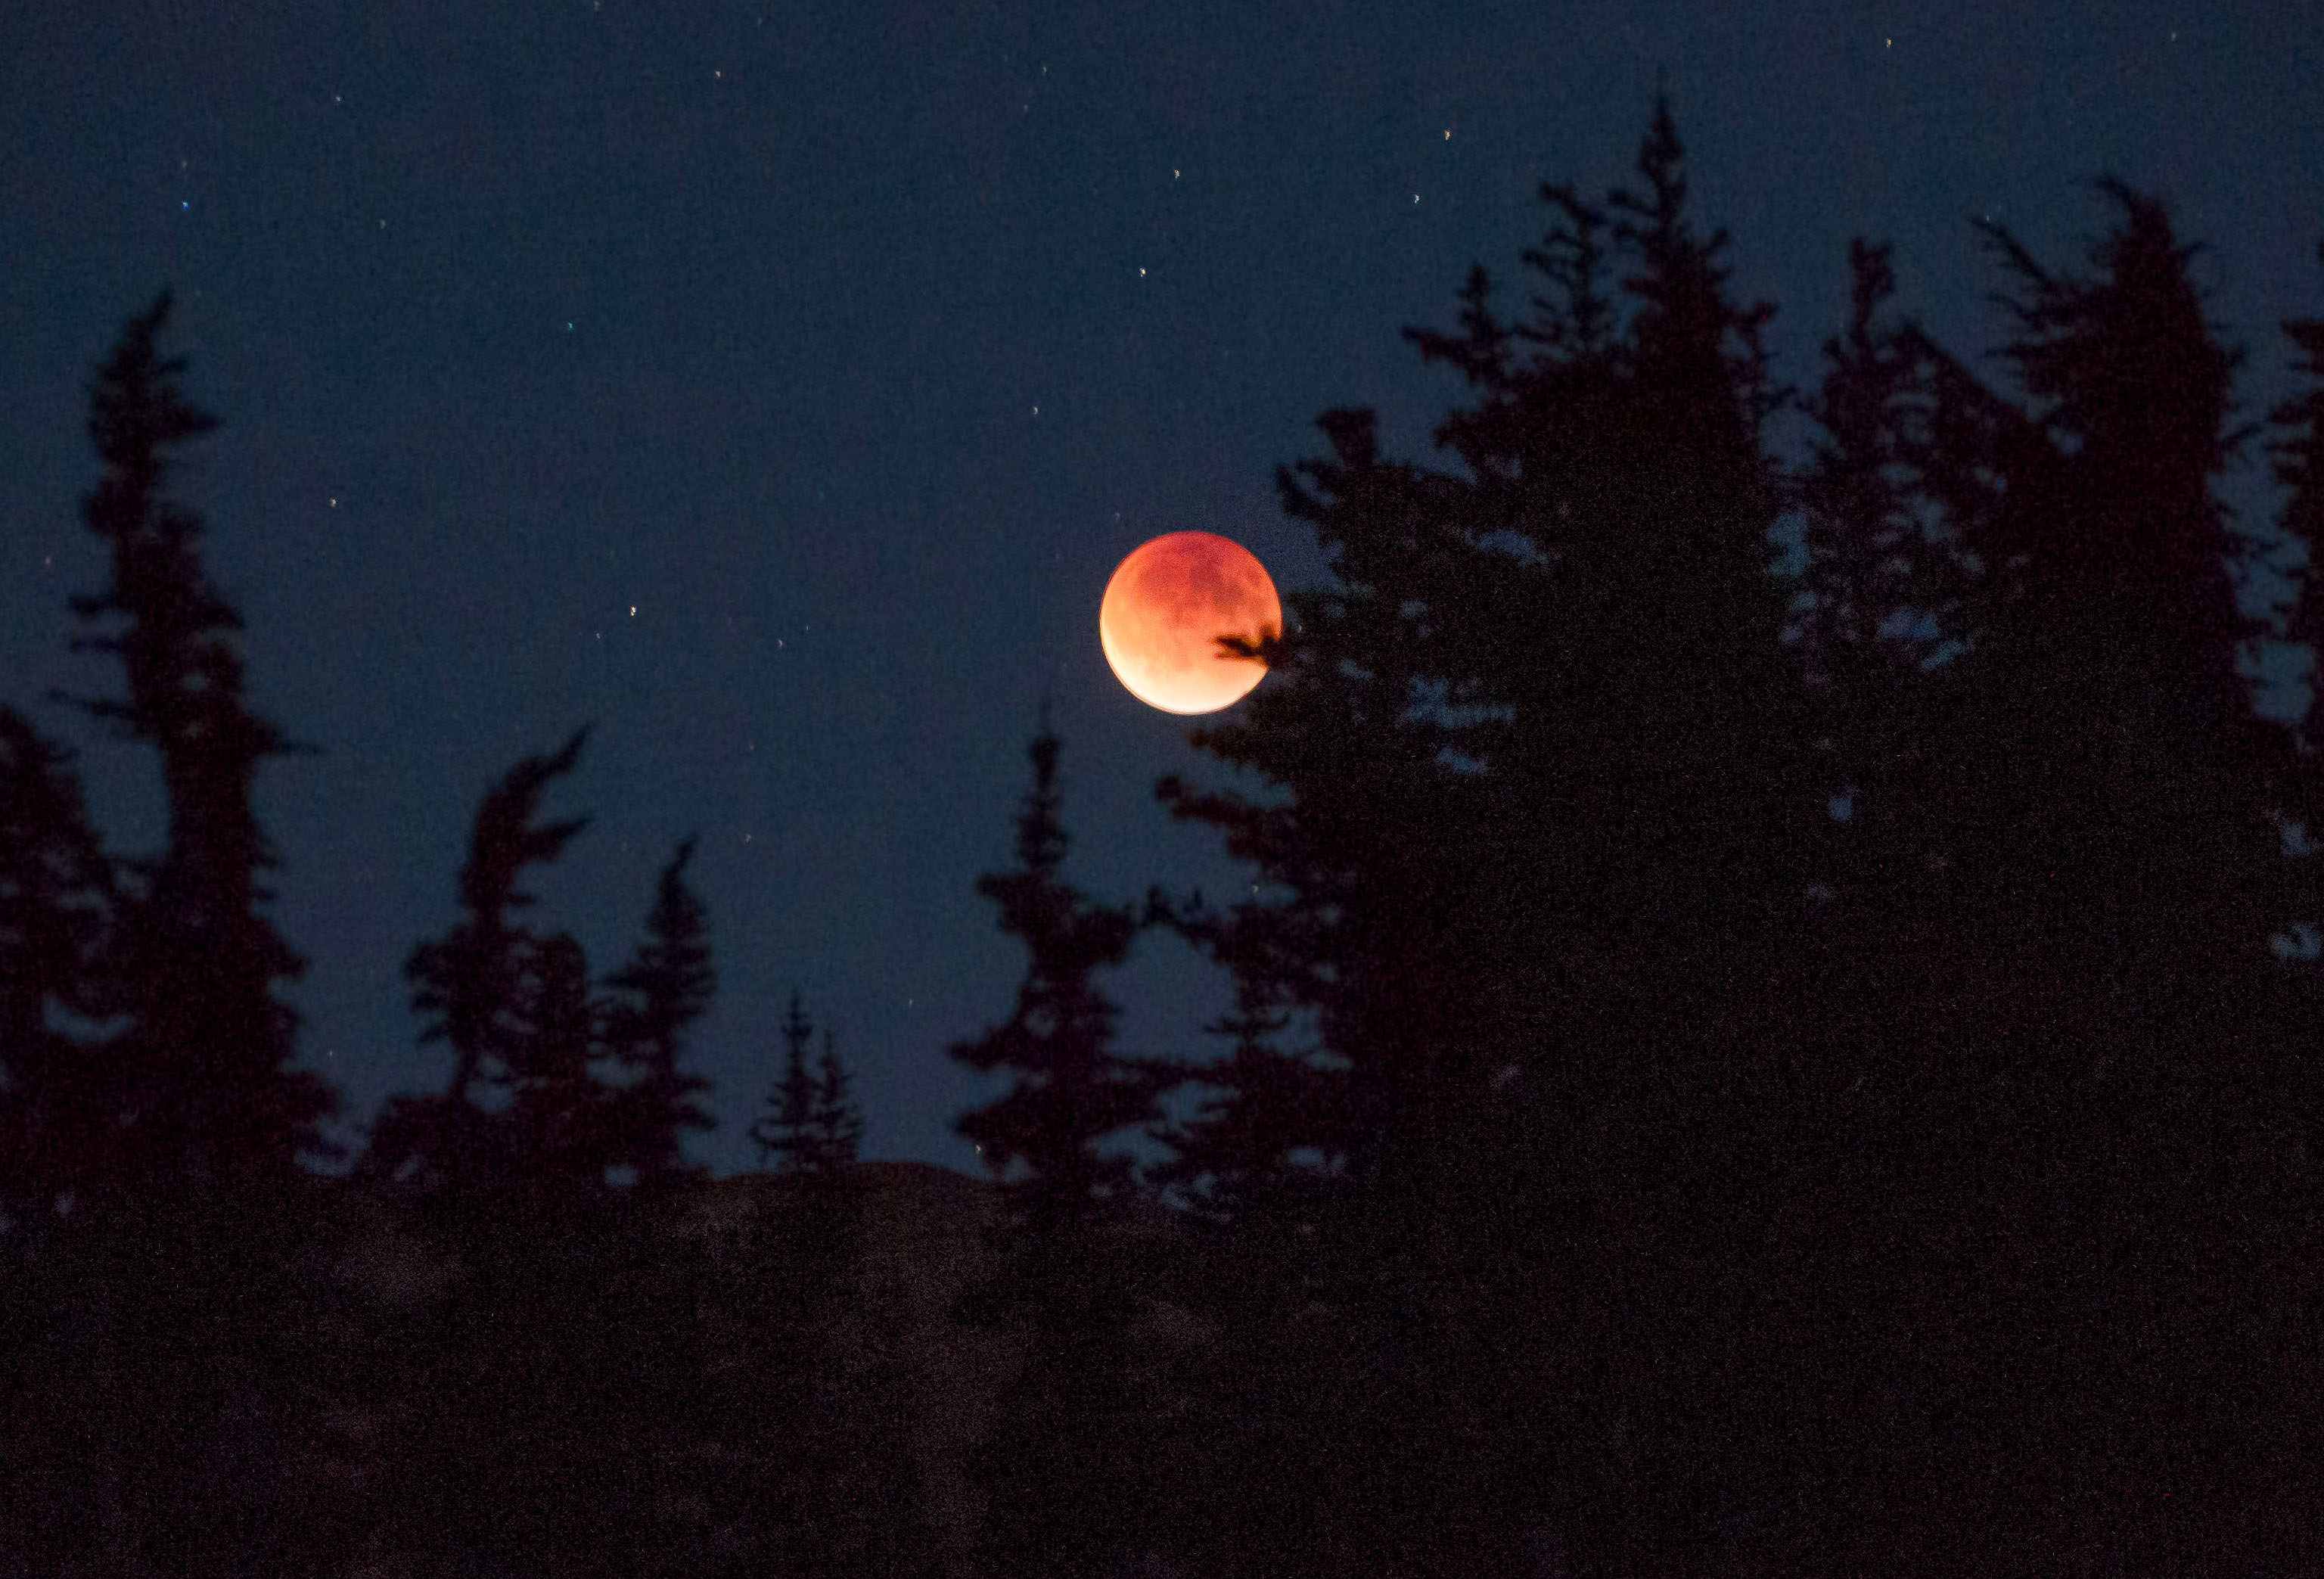
The September 17, 2015 total lunar eclipse - the last of the recent tetrad of lunar eclipses over the past 17 months - was darker than expected. Several factors described below were in play. This photo was taken in Washington's Olympic National Park. Credit: Rick Klawitter
First off, a huge thank you to everyone who made and sent their Danjon scale estimate of the totally-eclipsed Moon’s brightness to Dr. Richard Keen, University of Colorado atmospheric scientist. Your data were crucial to his study of how aerosols in Earth’s atmosphere and other factors influence the Moon’s appearance.
Grateful for your help, Keen received a total of 28 observations from 7 different countries.
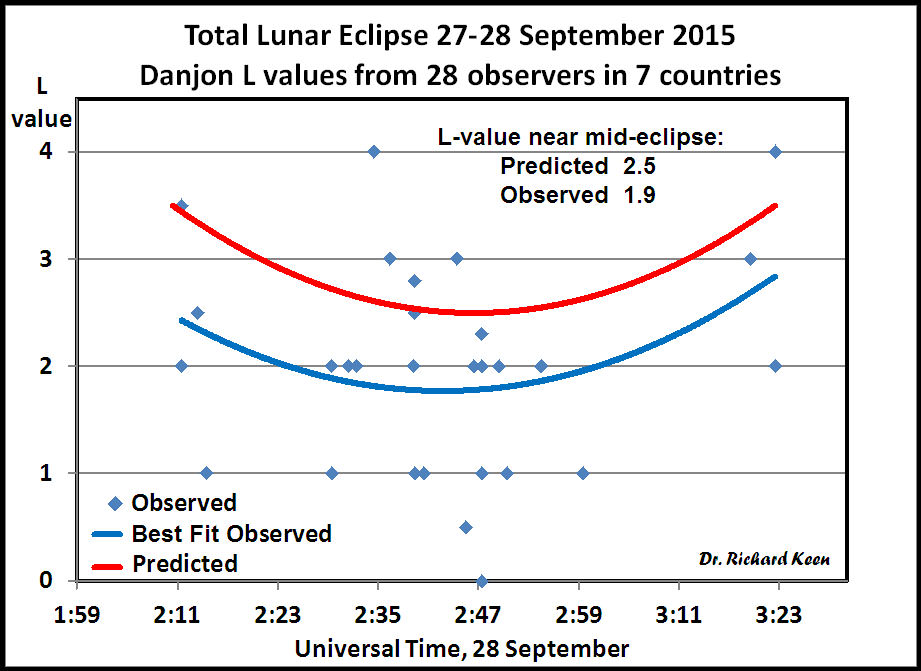
Graph created by Dr. Richard Keen plotting Danjon L values submitted by Universe Today readers and others that compare predicted values (top curve) with observed values. The Moon was about half as bright during totality as expected with L=1.9. Credit: Dr. Richard A. Keen
Using the Danjon information and estimates of the Moon’s brightness using the reverse binocular method, Keen crunched the data and concluded that the Moon was about 0.6 L (Danjon) units darker than expected and 0.4 magnitude dimmer, a brightness reduction of 33%. This agrees well with my own observation and possibly yours, too. No wonder so many stars sparkled near the Moon that night.
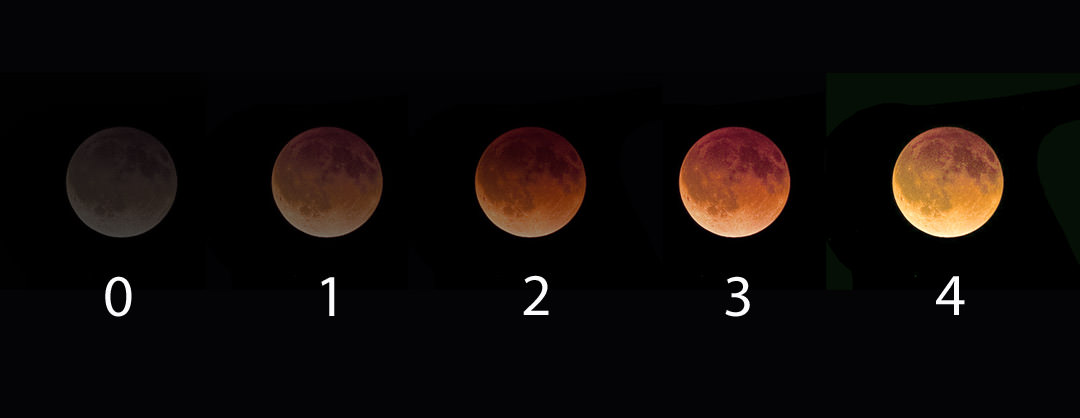
Lunar eclipse brightness is rated on the Danjon scale where “0” equals a dark gray totality and “4” a bright, coppery yellow. Credit: Bob King
I think it’s safe to say, most of us expected a normal or even bright totality. So why was it dark? Several factors were at play — one to do with the Moon’s location in Earth’s shadow, the other with a volcanic eruption and a third with long-term, manmade pollution.
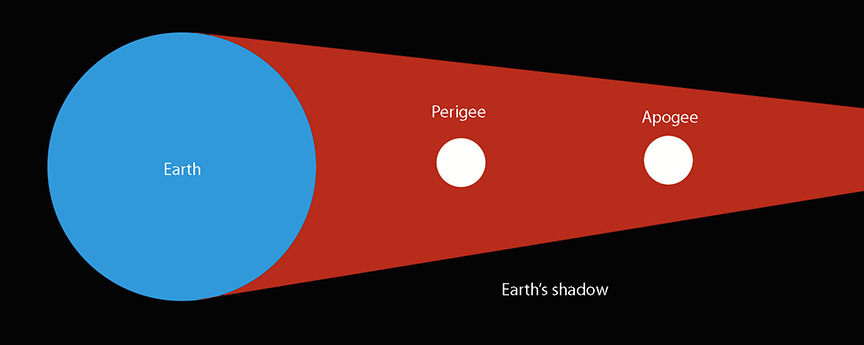
During a perigean eclipse, the Moon passes more deeply into Earth’s shadow compared to one that happens near apogee, when the moon is most distant from Earth. Moon distances not to scale and for illustration only. Credit: Bob King
You’ll recall that the eclipse occurred during lunar perigee, when the Moon swings closest to Earth in its 27-day orbit. Being closer, it also tracked deeper into Earth’s umbra or inner shadow which narrows the farther back of the planet it goes. An apogean Moon (farthest from Earth) passes through a more tapered cone of darkness closer to the penumbra, where sunlight mixes with shadow. A Moon nearer Earth would find the umbral shadow roomier with the light-leaking penumbra further off in the distance.
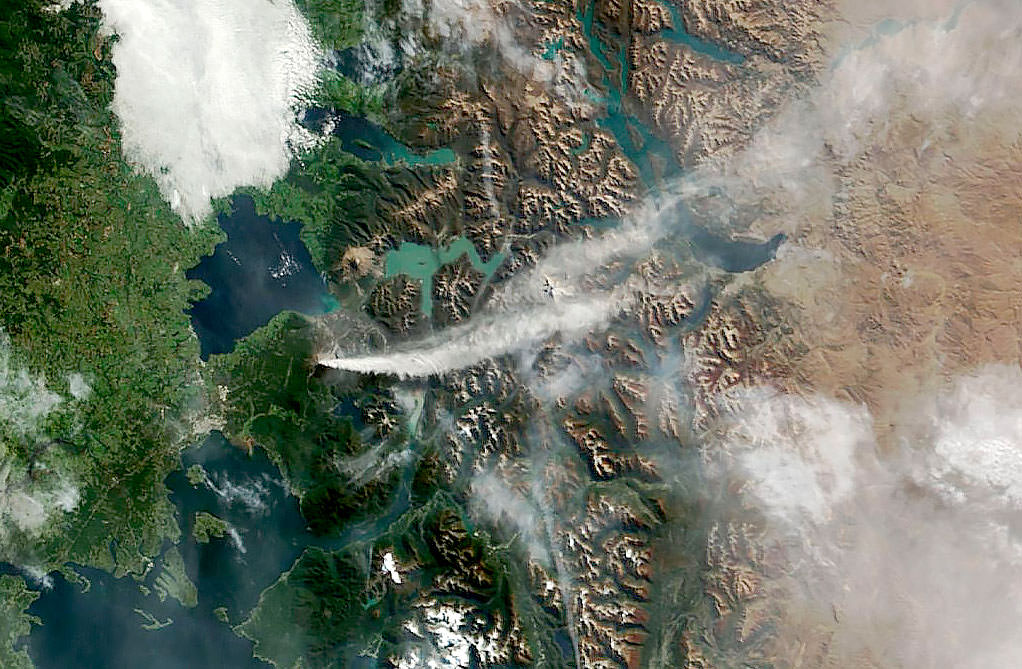
On April 24, 2015, NASA’s Terra satellite acquired this photo of the ash and gas plume from Calbuco volcano in southern Chile. Credit: NASA
But there’s more. Working independently, Steve Albersof NOAA and Brazilian astronomer Helio Vital suggested another reason: aerosols in the atmosphere. “Earth’s stratosphere is no longer completely clean of volcanic ashes,” said Vital in an e-mail communication. “In fact, lingering aerosols (ash, dust, sulfuric acid droplets) from the explosion of Calbuco five months ago may be to blame for that excessive darkening.”
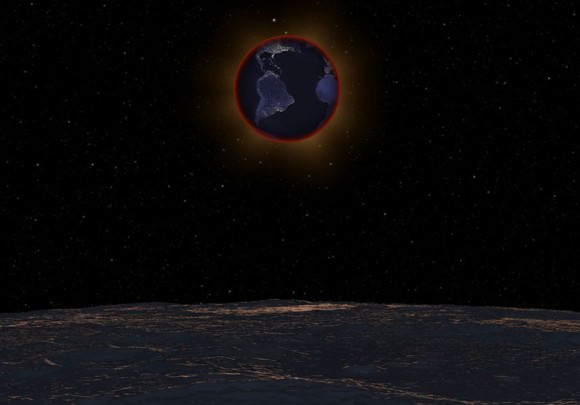
With the lunar horizon in the foreground, the Earth passes in front of the Sun on September 27, 2015 in this simulation, revealing the red ring of sunrises and sunsets along the limb of the planet responsible for illuminating the Moon during the eclipse. The clarity of the stratosphere at eclipse time can greatly affect lunar brightness during totality. The Earth and Sun are in Virgo for observers on the Moon with the bright star Beta Virginis at top. Click to see the video. Credit: NASA’s Scientific Visualization Studio
While much of the debris blasted into the stratosphere made for colorful sunsets in the southern hemisphere, some of that material has likely made its way to the northern hemisphere. Albers has noticed an increase in yellow and purple sunsets in his home town of Boulder in recent months, telltale signs of volcanic spew at play.
Forest fires that raged across the western states and Canadian provinces all spring and summer may also have contributed. Most of that smoke usually stays in the lower part of the atmosphere, but some may have found its way to the stratosphere, the very layer responsible for transmitting most of the sunlight that falls into Earth’s shadow and colors the moon.
Graph showing magnitude estimates of the Moon’s brightness during totality using the reverse binocular method. The predicted magnitude was -1.7 (a little brighter than Sirius) vs. the observed -1.3. Credit: Dr. Richard A. Keen
Sunlight has to pass through these light-absorbing minerals and chemicals on its way through the atmosphere and into Earth’s shadow. Less light means a darker moon during total eclipse. Coincidentally, much of the totally eclipsed Moon passed through the southern half of the umbra which “increased the effectiveness of the Calbuco aerosols (which are still more concentrated in the southern hemisphere than the northern) at dimming the light within the umbra,” writes Keen.
Oceanus Procellarum and Mare Imbrium are large, dark volcanic plains that contributed to the Moon’s faintness and dark-hued totality. Credit: Bob King
It also so happened that the darkest part of the moon coincided with two vast, dark volcanic plains called Oceanus Procellarum (Ocean of Storms) and Mare Imbrium, artificially enhancing the overall gloom over the northern half of the Moon.
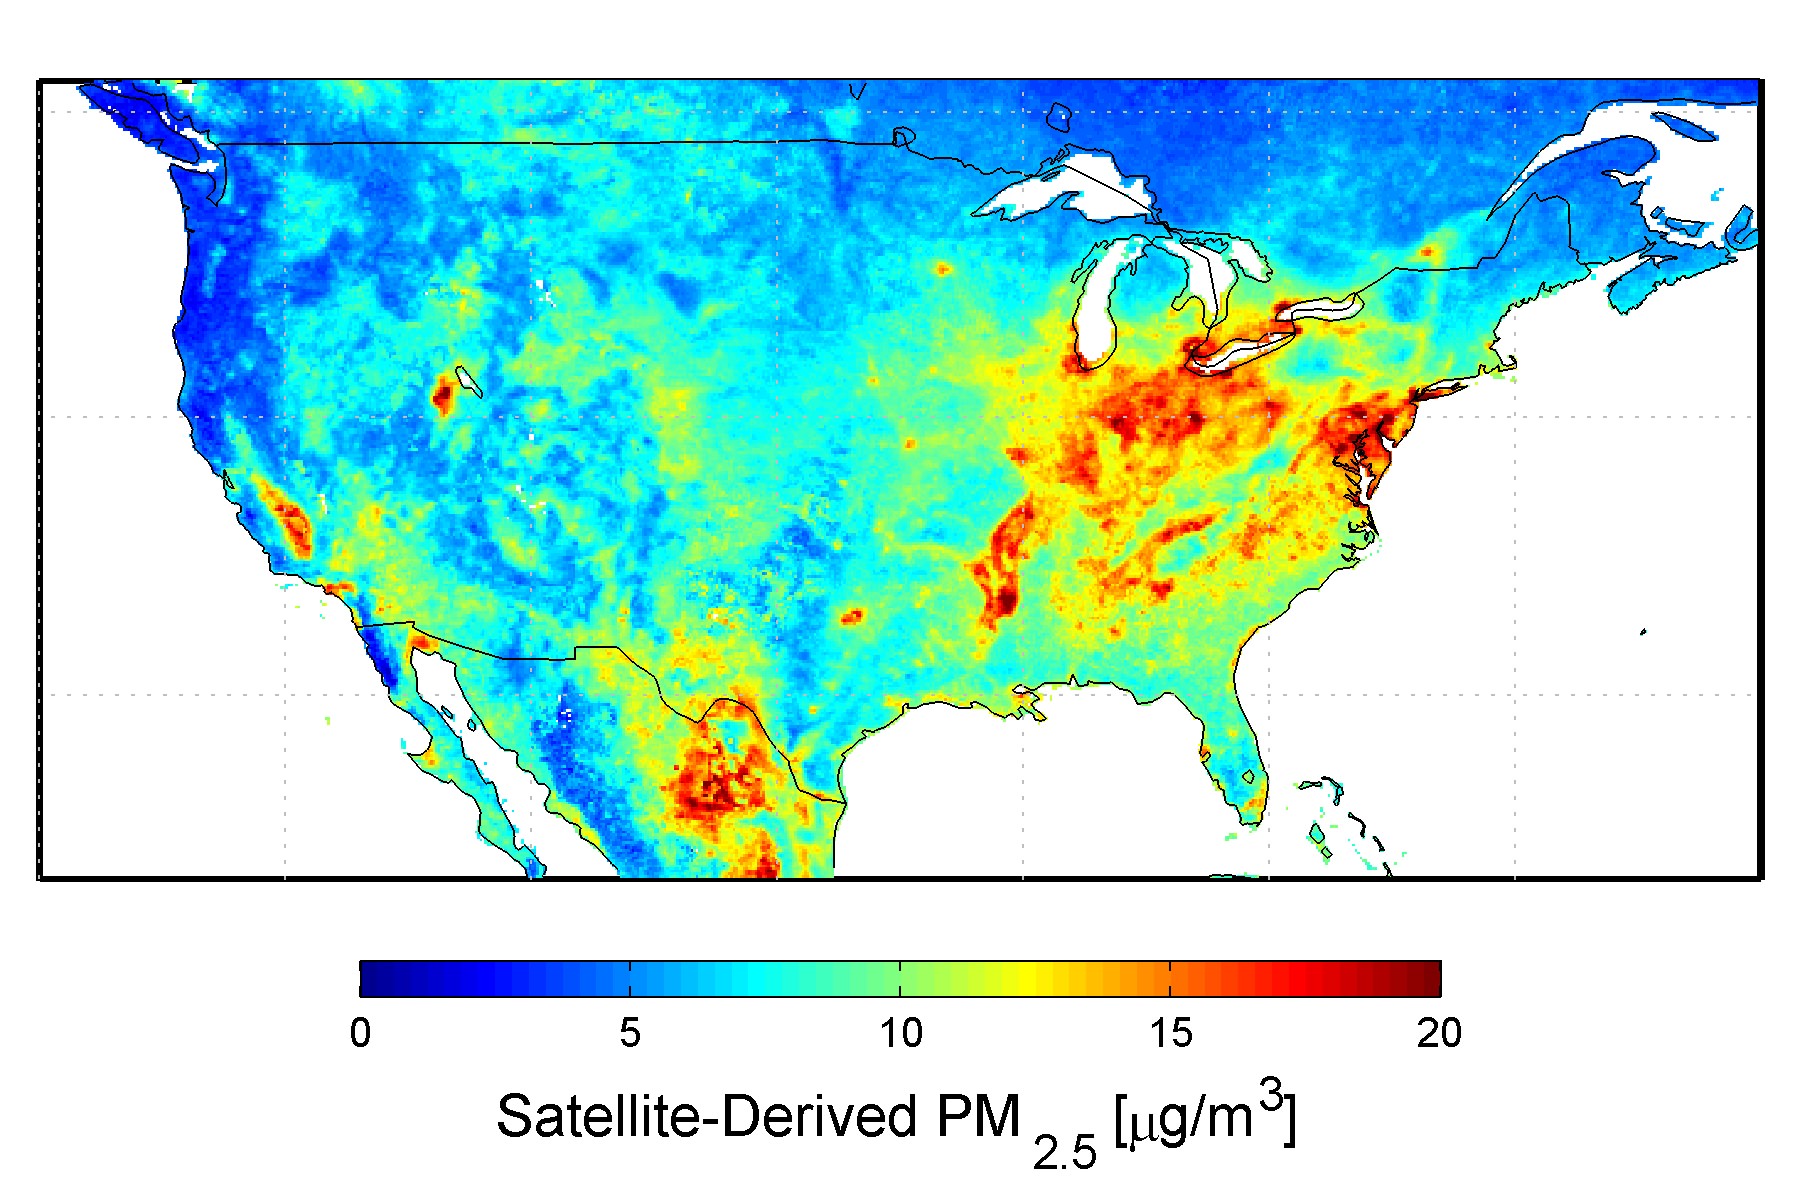
U.S. satellite-derived map of PM2.5 (fine particulate matter which includes sulfates and soot) averaged over 2001-2006. Credit: Dalhousie University, Aaron van Donkelaar
Finally, the human hand may also have played a role in lunar color and brightness. The burning of coal and oil has caused a gradual increase in the amount of human-made sulfate aerosols in the atmosphere since the start of the industrial revolution. According to NASA, at current production levels, human-made sulfate aerosols are believed to outweigh the naturally produced sulfate aerosols. No surprise that the concentration of aerosols is highest in the northern hemisphere where most industrial activity is found.
Isn’t it fascinating that one blood-red Moon can tell us so much about the air we breathe? Thank you again for your participation!
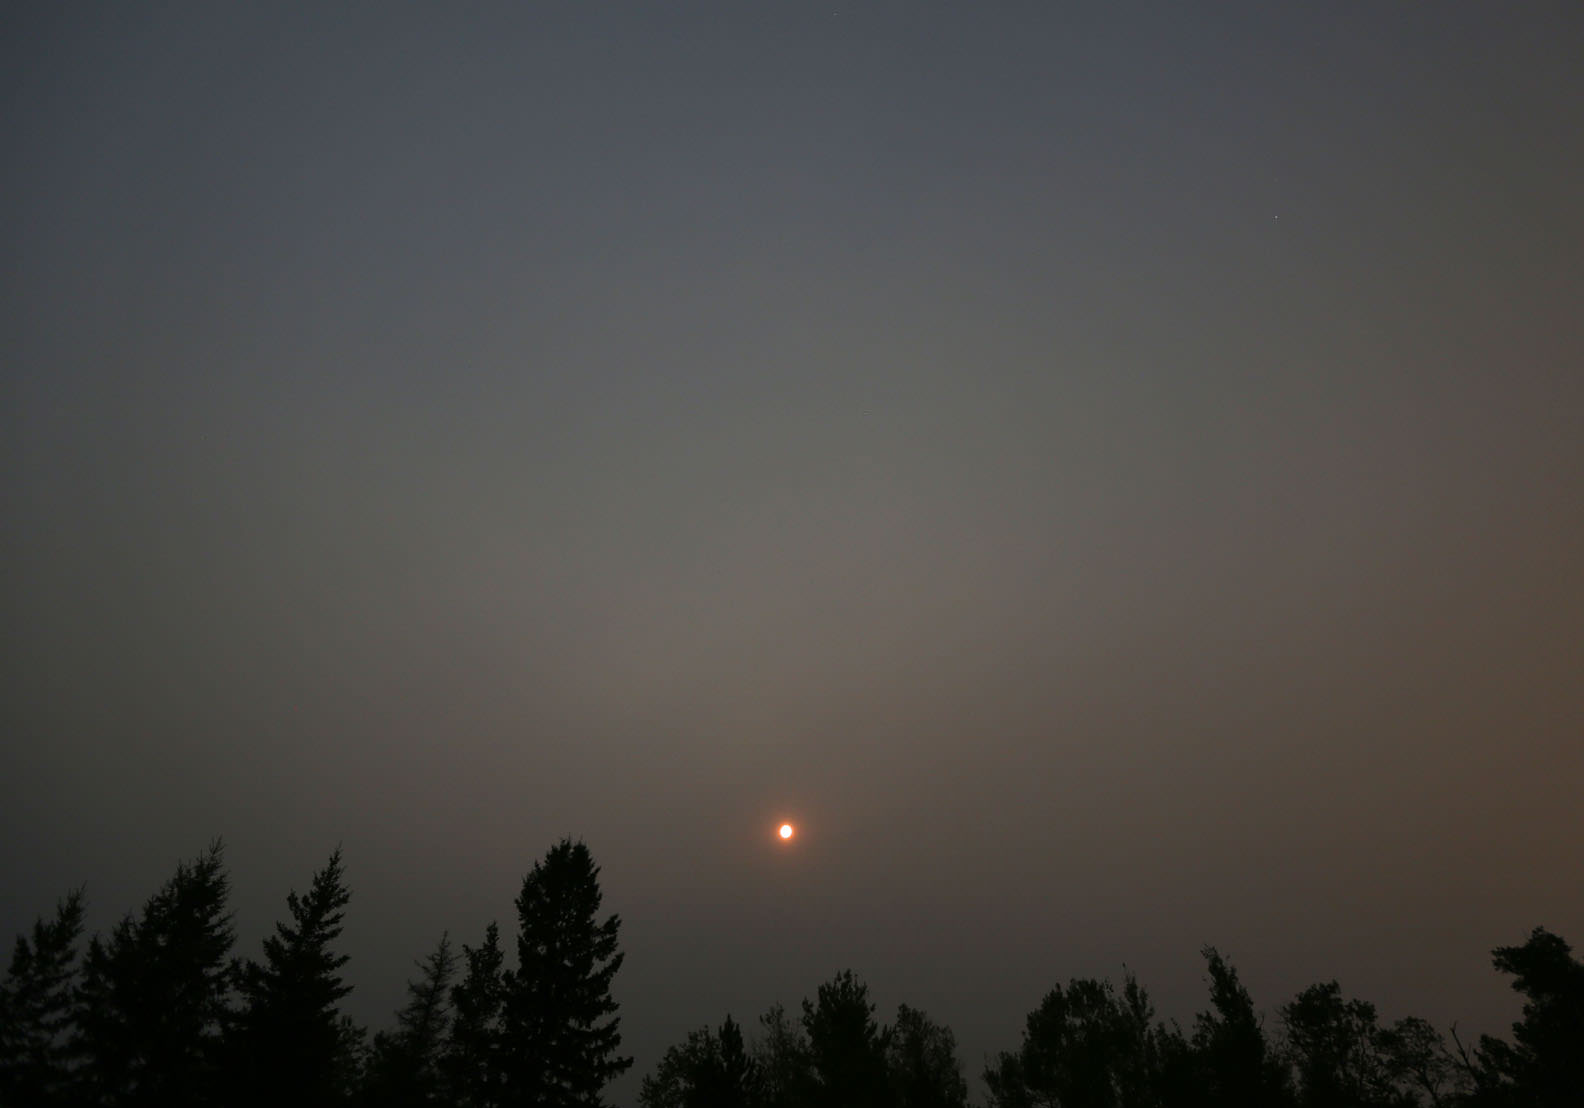
The Full Moon at 10:30 p.m. last night (Aug. 30). Even at 25 altitude, it glowed a deep, dark orange due to heavy smoke from western forest fires. Credit: Bob King
Did you see the Moon last night? I walked outside at 10:30 p.m. and was stunned to see a dark, burnt-orange Full Moon as if September’s eclipse had arrived a month early. Why? Heavy smoke from forest fires in Washington, California and Montana has now spread to cover nearly half the country in a smoky pall, soaking up starlight and muting the moonlight.
If this is what global warming has in store for us, skywatchers will soon have to take a forecast of “clear skies” with a huge grain of salt.
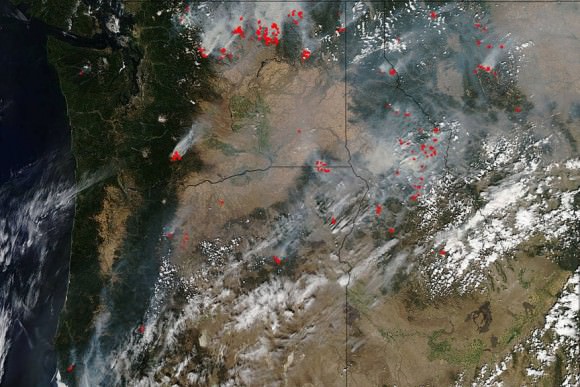
The Pacific Northwest is abundantly dotted with wildfires in Washington, Oregon, Idaho and Montana in this Aqua satellite image taken on August 25, 2015. Actively burning areas, detected by MODIS’s thermal bands, are outlined in red. Smoke from the fires has been drifting east, blanketing Midwestern skies and blotting out the stars at night. Credit: NASA image courtesy Jeff Schmaltz, MODIS Rapid Response Team
By day, the sky appears the palest of blues. By night, the stars are few if any, and the Moon appears faint, the color of fire and strangely remote. Despite last night’s clear skies, only the star Vega managed to penetrate the gloom. I never saw my shadow even at midnight when the Moon had climbed high into the southern sky.
Last night’s Full Moon seen through an 8-inch telescope at 11:30 p.m. The colors are true. Credit: Bob King
We’ve seen this smoke before. Back in July, Canadian forest fires wafted south and west and covered much of the northern half of the U.S., giving us red suns in the middle of the afternoon and leaving only enough stars to count with two hands at night. On the bright side, the Moon is fascinating to observe. I set up the telescope last night and spend a half hour watching this unexpected “eclipse”; sunsets appear positively atomic. The size of the smoke particles is just right for filtering out or scattering away blues, greens and even yellow from white light. Vivid reds, pinks and oranges remain to tint anything bright enough to penetrate the haze.
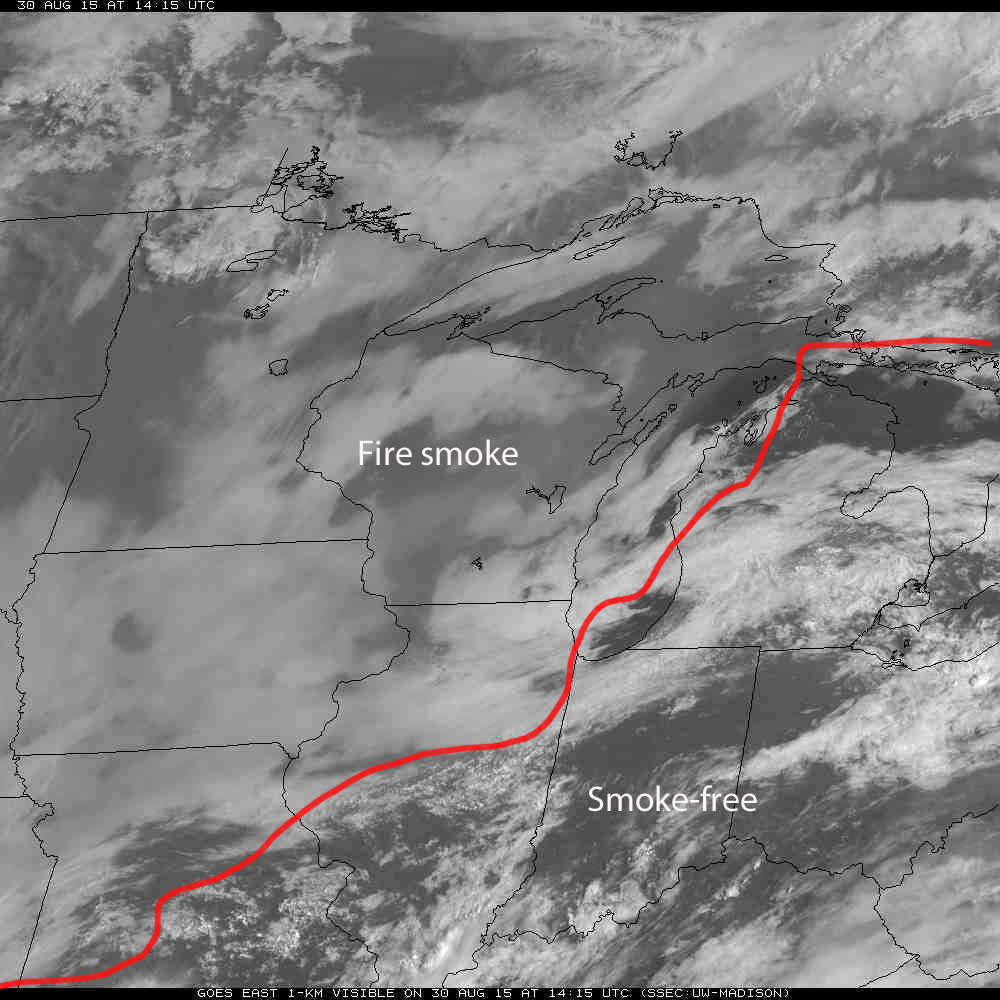
GOES-8 satellite view of the central U.S. taken at 8:15 a.m. CDT August 30, 2015 show a veil of grayish forest fire smoke covering much of the Midwest with clearer conditions to the southeast. The red line is the approximate border between the two. Credit: NOAA
But smoke can cause harm, too. Forest fire smoke contains carbon monoxide, carbon dioxide and soot. On especially smoky days, you can even smell the odor of burning trees in the air at ground level. Some may suffer from burning eyes, asthma or bronchitis on especially smoky days even a thousand miles from the source fires.
Wide-angle view of last night’s Moon. Notice that the smoke is thicker along the horizontal – left and right of the Moon. Above, at a higher elevation, we see through less smoke, so the moonlit sky is a bit brighter there. No stars are visible. Credit: Bob King
On clear, blue-sky days, I’ve watched the smoke creep in from the west. It begins a light haze and slowly covers the entire sky in a matter of several hours, often showing a banded structure in the direction of the Sun. A little smoke is OK for observing, but once it’s thick enough to redden the Moon even hours after moonrise, you can forget about using your telescope for stargazing. Sometimes, a passing thunderstorm and cold front clears the sky again. Sometimes not.
The only cures for fire soot are good old-fashioned rain and the colder weather that arrives with fall. In the meantime, many of us will spend our evenings reading about the stars instead of looking at them.
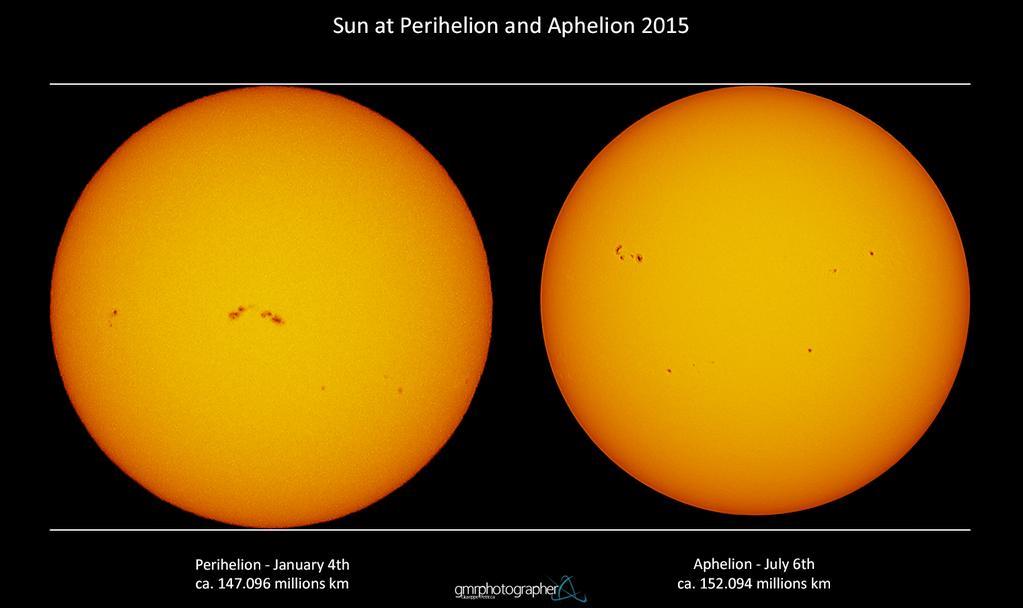
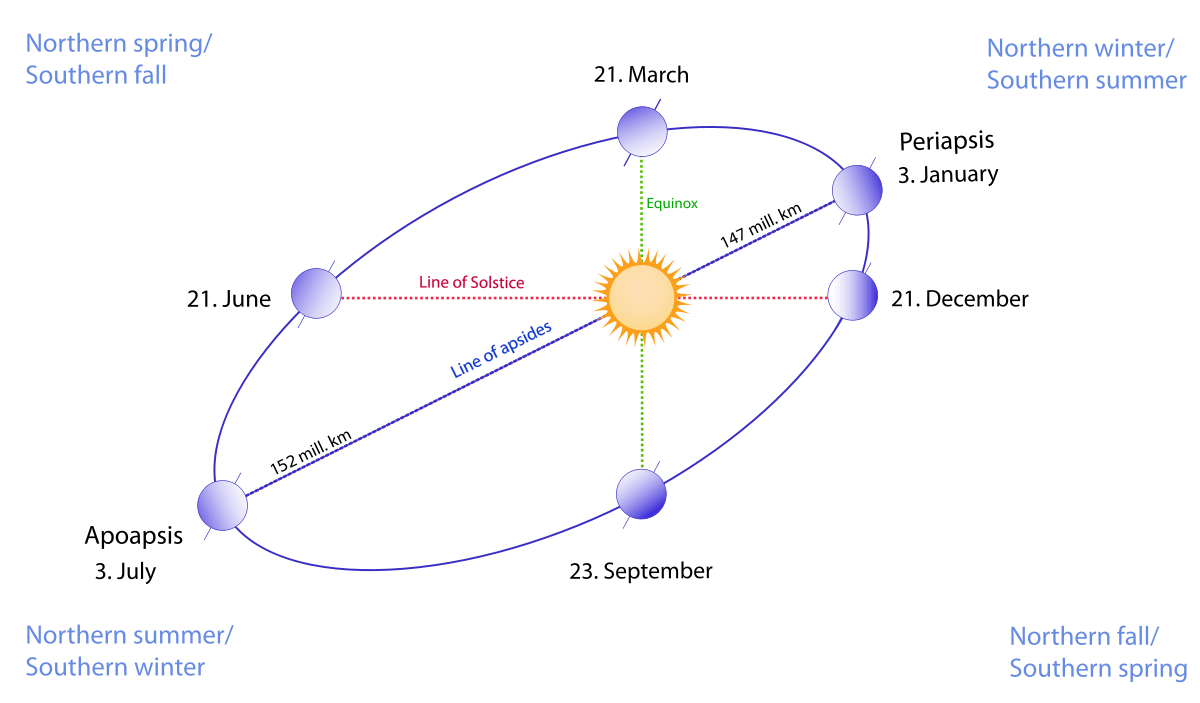
Do you feel a little… distant today? The day after the 4th of July weekend brings with it the promise of barbecue leftovers and discount fireworks. It also sees our fair planet at aphelion, or its farthest point from the Sun. In 2015, aphelion (or apoapsis) occurs at 19:40 Universal Time (UT)/3:40 PM EDT today, as we sit 1.01668 astronomical units (AU) from the Sun. This translates to 152.1 million kilometres, or 94.5 million miles. We’re actually 3.3% closer to the Sun in early January than we are today. This also the latest aphelion has occurred on the calendar year since 2007, and it won’t fall on July 6th again until 2018. The insertion of an extra day every leap year causes the date for Earth aphelion to slowly vary between July 3rd and July 6th in the current epoch.
Perihelion and aphelion versus the solstices and the equinoxes. Image credit: Gothika/Duoduoduo/Wikimedia commons 3.0 license
Aphelion sees the Earth 4.8 million kilometers farther from the Sun than perihelion in early January. The eccentricity of our orbit—that is, how much our planet’s orbit varies from circular to elliptical—currently sits at 0.017 or 1.7%.
It is ironic that we’re actually farther from the Sun in the middle of northern hemisphere summer. It sure doesn’t seem like it on a sweltering Florida summer day, right? That’s because the 23.44 degree tilt of the Earth’s rotational axis is by far the biggest driver of the seasons. But our variation in distance from the Sun does play a factor in long term climate as well. We move a bit slower farther from the Sun, assuring northern hemisphere summers are currently a bit longer (by about 4 days) than winters. The variation in solar insolation between aphelion and perihelion currently favors hot dry summers in the southern hemisphere.
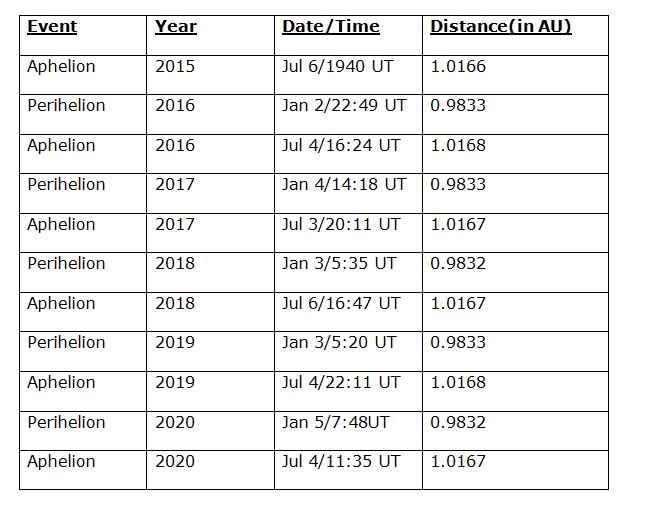
Perihelion and aphelion circumstances for the remainder of the decade. Credit: David Dickinson
The eccentricity of our orbit varies from between 0.000055 and 0.0679 over a span of a ‘beat period’ of 100,000 years. Our current trend sees eccentricity slowly decreasing.
The tilt of our rotational axis varies between 22.1 and 24.5 degrees over 41,000 years. This value is also currently on a decreasing trend towards its shallow minimum around 11,800 AD.
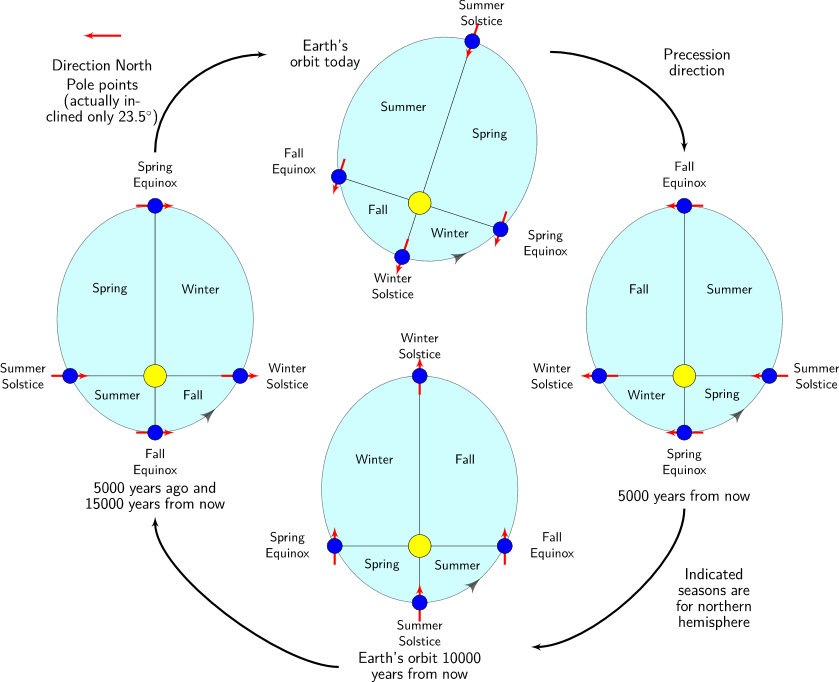
And finally, the precession of the Earth’s axis and apsidal precession combine to slowly move the date of aphelion and perihelion one time around our calendar once every 21,000 years.
The precession of the line of apsides versus the seasons. Image credit: Krishnavedala/Wikimedia commons 3.0 license.
These combine to form what are known as Milankovitch Cycles of long-term climate variation, which were first expressed by astronomer Milutin Milankovic in 1924. Anthropogenic climate change is a newcomer on the geologic scene, as human civilization does its very best to add a signal of its very own to the mix.
We also just passed the mid-point ‘pivot of the year’ on July 2nd. More than half of 2015 is now behind us.
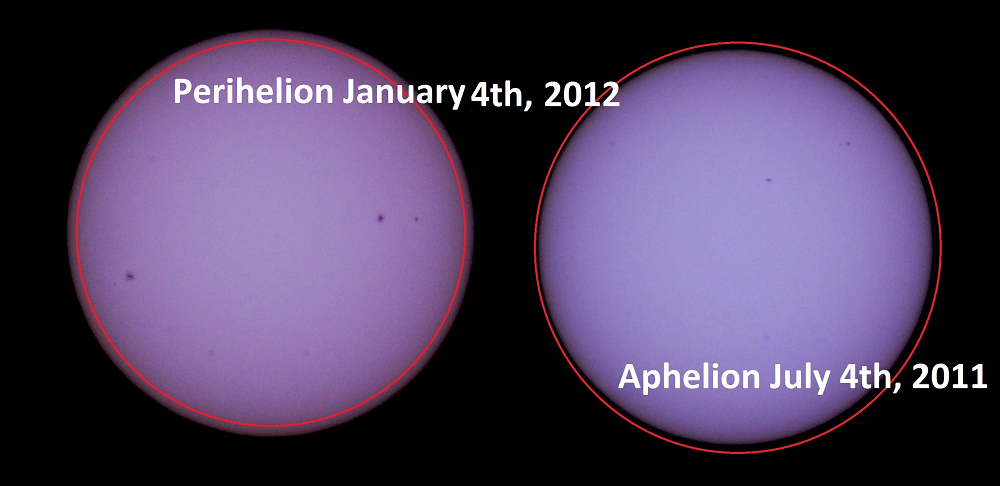
Want to observe the aphelion and perihelion of the Earth for yourself? If you have a filtered rig set to photograph the Sun, try this: take an image of the Sun today, and take another on perihelion next year on January 2nd. Be sure to use the same settings, so that the only variation is the angular size of the Sun itself. The disk of the Sun varies from 33’ to 31’ across. This is tiny but discernible. Such variations in size between the Sun and the Moon can also mean the difference between a total solar and annular eclipse.
A perihelion versus aphelion day Sol. Image credit: David Dickinson
Should we term the aphelion Sun a #MiniSol? Because you can never have too many internet memes, right?
And did you know: the rotational axis of the Sun is inclined slightly versus the plane of the ecliptic to the tune of 7.25 degrees as well. In 2015, the Sun’s north pole was tipped our way on March 7th, and we’ll be looking at the south pole of our Sun on September 9th.
And of course, seasons on other planets are much more extreme. We’re just getting our first good looks at Pluto courtesy of New Horizons as it heads towards its historic flyby on July 14th. Pluto reached perihelion in 1989, and is headed towards aphelion 49 AU from the Sun on the far off date in 2114 AD. Sitting on Pluto, the Sun would shine at -19th magnitude—about the equivalent of the twilight period known as the ‘Blue Hour’ here on Earth—and the Sun would appear a scant one arc minute across, just large enough to show a very tiny disk.
All thoughts to consider as we start the long swing inward towards perihelion next January.
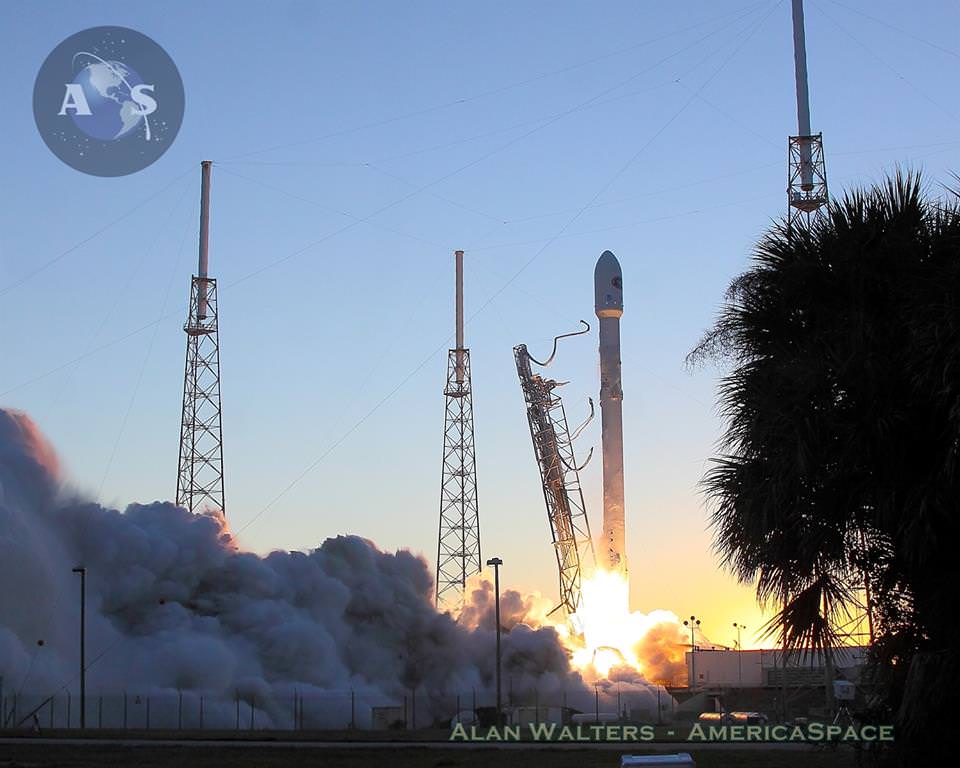
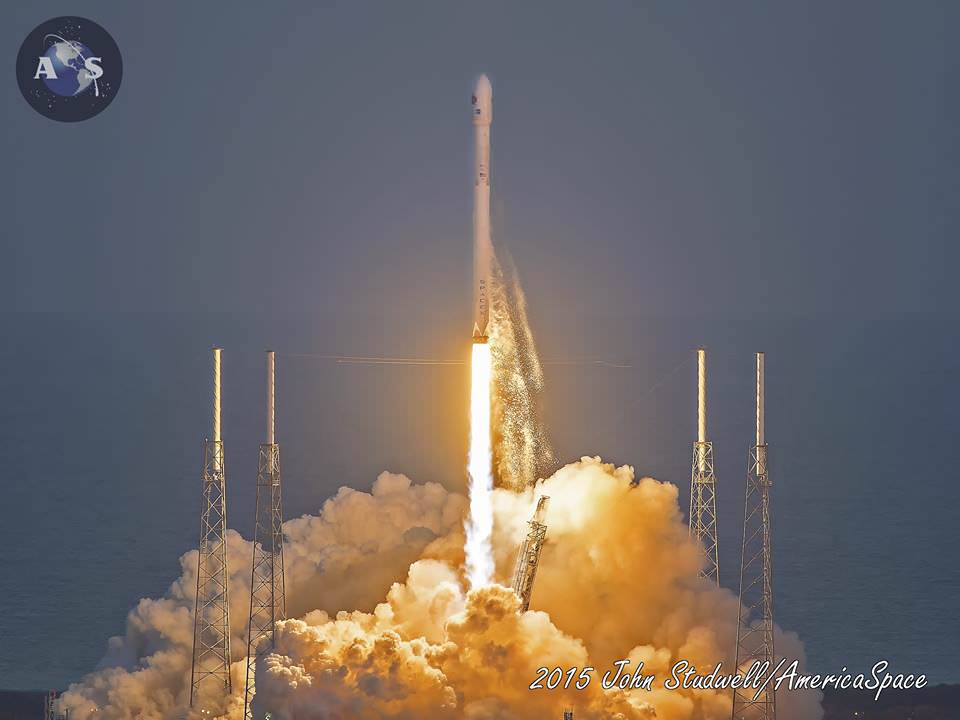
NOAA's DSCOVR satellite launches from Cape Canaveral Air Force Station on Feb. 11, 2015. DSCOVR will provide NOAA space weather forecasters more reliable measurements of solar wind conditions, improving their ability to monitor potentially harmful solar activity. Credit: Alan Walters/AmericaSpace
After a 17 year long wait, a new American mission to monitor intense solar storms and warn of impeding space weather disruptions to vital power grids, telecommunications satellites and public infrastructure was launched atop a SpaceXFalcon 9 on Wednesday, Feb. 11, from Cape Canaveral, Florida, to start a million mile journey to its deep space observation post.
The third time proved to be the charm when the Deep Space Climate Observatory, or DSCOVR science satellite lifted off at 6:03 p.m. EST Wednesday from Space Launch Complex 40 at Cape Canaveral Air Force Station in Florida.
The spectacular sunset blastoff came after two scrubs this week forced by a technical problem with the Air Force tracking radar and adverse weather on Sunday and Tuesday.
The $340 million DSCOVR has a critical mission to monitor the solar wind and aid very important forecasts of space weather at Earth at an observation point nearly a million miles from Earth. It will also take full disk color images of the sunlit side of Earth at least six times per day that will be publicly available and “wow” viewers.
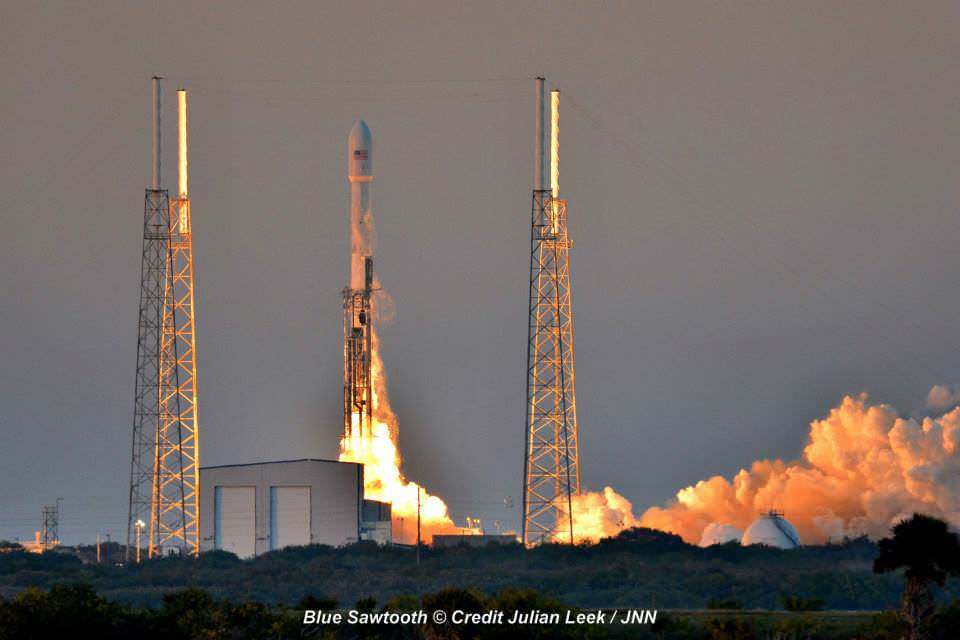
Launch of NOAA DSCOVR satellite from Cape Canaveral Air Force Station on Feb. 11, 2015 to monitor solar storms and space weather. Credit: Julian Leek
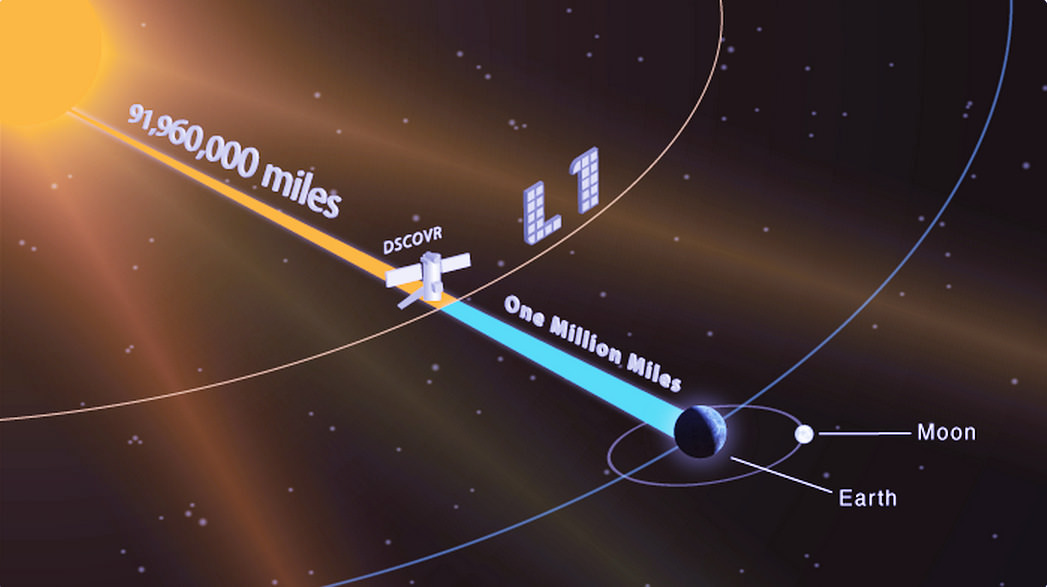
The couch sized probe was targeted to the L1 Lagrange Point, a neutral gravity point that lies on the direct line between Earth and the sun located 1.5 million kilometers (932,000 miles) sunward from Earth. At L1 the gravity between the sun and Earth is perfectly balanced and the satellite will orbit about that spot just like a planet.
L1 is a perfect place for the science because it lies outside Earth’s magnetic environment. The probe will measure the constant stream of solar wind particles from the sun as they pass by.
The DSCOVR spacecraft (3-axis stabilized, 570 kg) will be delivered to the Sun-Earth L1 point, 1.5 million km (1 million miles) from the Earth, directly in front of the Sun. A Halo (Lissajous) orbit will stabilize the craft’s position around the L1 point while keeping it outside the radio noise emanating from the Sun. (Illustratin Credit: NASA)
DSCOVR is a joint mission between NOAA, NASA, and the U.S Air Force (USAF) that will be managed by NOAA. The satellite and science instruments are provided by NASA and NOAA. The rocket was funded by the USAF.
The mission is vital because its solar wind observations are crucial to maintaining accurate space weather forecasts to protect US infrastructure such as power grids, aviation, planes in flight, all types of Earth orbiting satellites for civilian and military needs, telecommunications, ISS astronauts and GPS systems.
It will take about 150 days to reach the L1 point and complete satellite and instrument checkouts.
DSCOVR will then become the first operational space weather mission to deep space and function as America’s primary warning system for solar magnetic storms.
It will replace NASA’s aging Advanced Composition Explorer (ACE) satellite which is nearly 20 years old and far beyond its original design lifetime.
“DSCOVR is the latest example of how NASA and NOAA work together to leverage the vantage point of space to both understand the science of space weather and provide direct practical benefits to us here on Earth,” said John Grunsfeld, associate administrator of NASA’s Science Mission Directorate in Washington.
DSCOVR was first proposed in 1998 by then US Vice President Al Gore as the low cost ‘Triana’ satellite to take near continuous views of the Earth’s entire globe to feed to the internet as a means of motivating students to study math and science. It was eventually built as a much more capable Earth science satellite that would also conduct the space weather observations.
But Triana was shelved for purely partisan political reasons and the satellite was placed into storage at NASA Goddard and the science was lost until now.
DSCOVR mission logo. Credit: NOAA/NASA/U.S. Air Force
DSCOVR is equipped with a suite of four continuously operating solar science and Earth science instruments from NASA and NOAA.
It will make simultaneous scientific observations of the solar wind and the entire sunlit side of Earth.
The 750-kilogram (1250 pound) DSCOVR probe measures 54 inches by 72 inches.
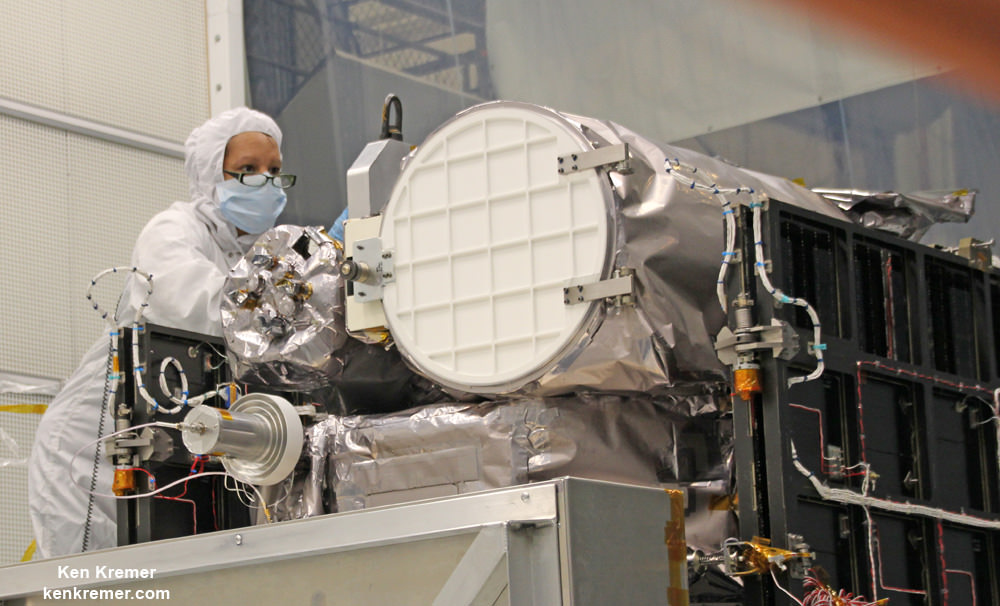
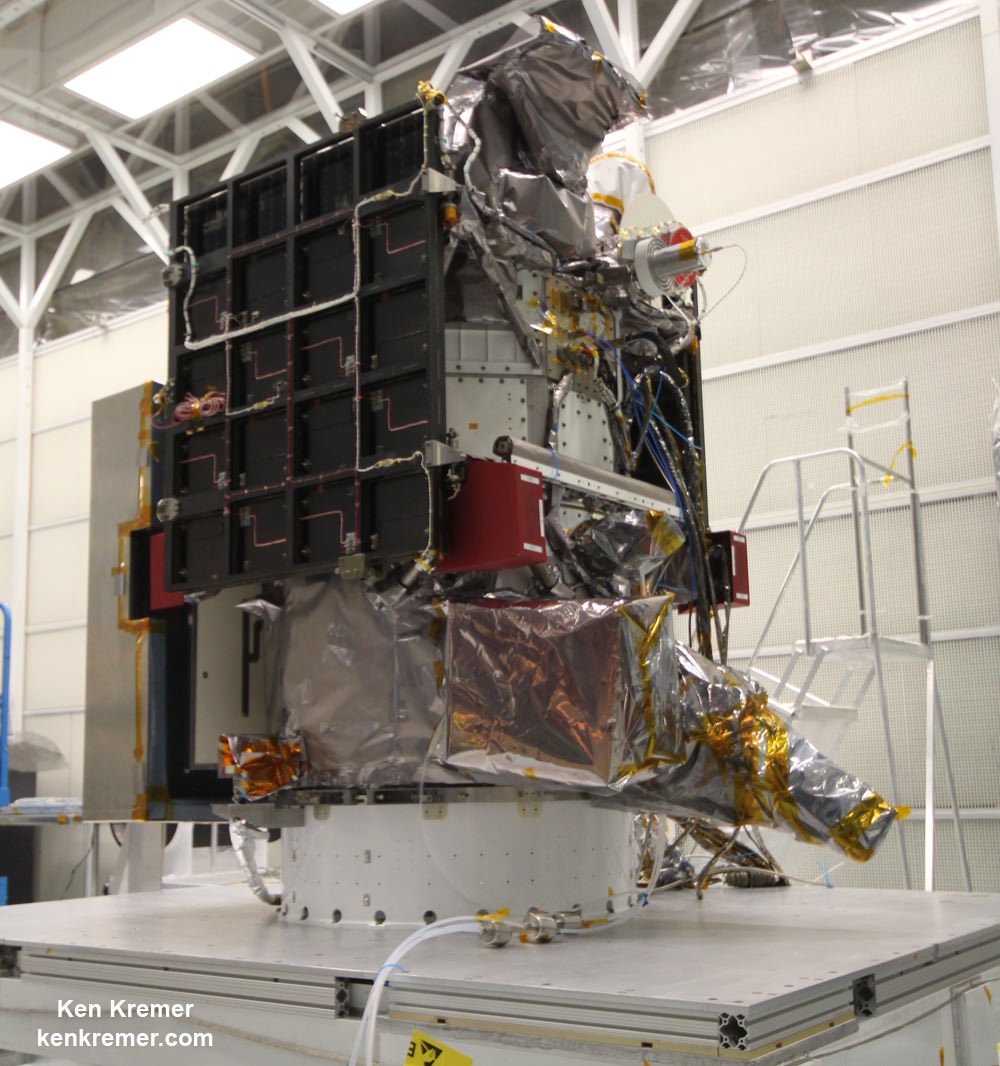
Technician works on NASA Earth science instruments and Earth imaging EPIC camera (white circle) housed on NOAA/NASA Deep Space Climate Observatory (DSCOVR) inside NASA Goddard Space Flight Center clean room in November 2014. Credit: Ken Kremer/kenkremer.com/AmericaSpace
The two Earth science instruments from NASA are the Earth Polychromatic Imaging Camera (EPIC) and the National Institute of Standards and Technology Advanced Radiometer (NISTAR).
EPIC will provide true color spectral images of the entire sunlit face of Earth at least six times per day, as viewed from an orbit around L1. They will be publically available within 24 hours via NASA Langley.
It will view the full disk of the entire sunlit Earth from sunrise to sunset and collect a variety of science measurements including on ozone, aerosols, dust and volcanic ash, vegetation properties, cloud heights and more.
Listen to my post launch interview with the BBC about DSCOVR and ESA’s successful IXV launch on Feb. 11.
NOAA/NASA Deep Space Climate Observatory (DSCOVR) undergoes processing in NASA Goddard Space Flight Center clean room. Solar wind instruments at right. DSCOVER will launch in February 2015 atop SpaceX Falcon 9 rocket. Credit: Ken Kremer/kenkremer.com/AmericaSpaceLaunch of NOAA DSCOVR satellite from Cape Canaveral Air Force Station on Feb. 11, 2015 to monitor solar storms and space weather. Credit: John StudwellPrelaunch view of SpaceX rocket on Cape Canaveral launch pad taken from LC-39 at the Kennedy Space Center. Credit: Chuck Higgins
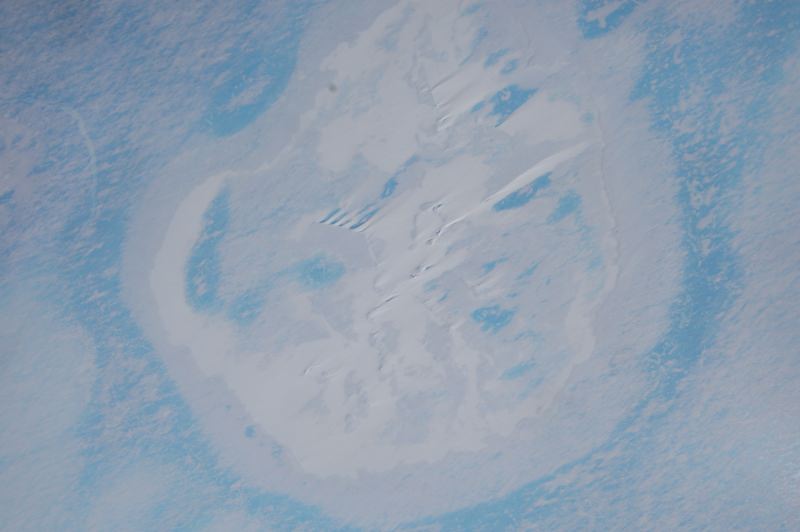
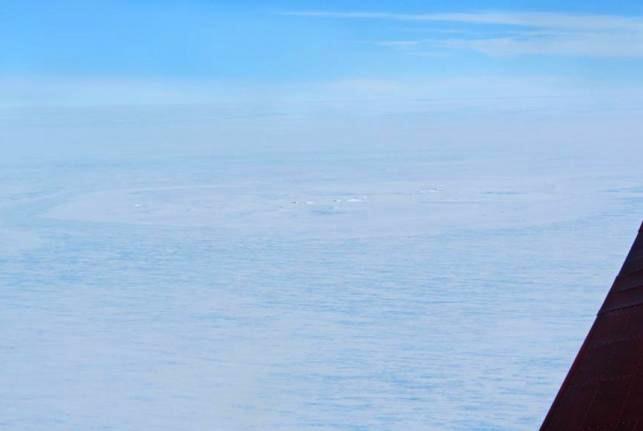
Aerial photo of the crater site, taken with the Polar 6 board camera, while the aircraft was flying 7000 feet above the ice shelf. Credit: Alfred-Wegener-Institut
Ever since its discovery was announced earlier this year, the 3 km-wide ring structure discovered on the of Antarctica has been a source of significant interest and speculation. Initially, the discovery was seen as little more than a happy accident that occurred during a survey of East Antarctica by a WEGAS (West-East Gondwana Amalgamation and its Separation) team from the Alfred Wegener Institute.
However, after the team was interviewed by the Brussels-based International Polar Foundation, news of the find and its possible implication spread like wildfire. Initial theories for the possible origin of the ring indicated that it could be the result of the impact of a large meteor. However, since the news broke, team leader Olaf Eisen has offered an alternative explanation: that the ring structure is in fact the result of other ice-shelf processes.
As Eisen indicated in a new entry on the AWI Ice Blog: “Doug MacAyeal, glaciologist from the University of Chicago, put forward the suggestion that the ring structure could be an ice doline.” Ice dolines are round sinkholes that are caused by a pool of melt water formed within the shelf ice. They are formed by the caving in of ice sheets or glaciers, much in the same way that sinkholes form over caves.
“If the melt water drains suddenly,” he wrote, “like it often does, the surface of the glacier is destabilised and does collapse, forming a round crater. Ice depressions like this have been observed in Greenland and on ice shelves of the Antarctic Peninsula since the 1930s.”
Aerial photo of the ringed formation that the AWI researchers found on the Antarctic ice shelf. Credit: Tobias Binder, AWI
However, in glaciers, these cavities form much more rapidly, as the meltwater created by temperature variations causes englacial lakes or water pockets to from which then drains through the ice sheet. Such dolines have been observed for decades, particularly in Greenland and the Antarctic Peninsula where the ice melts during the summertime.
Initial analysis of satellite images appear to confirm this, as they indicate that the feature could have been present before the supposed impact took place around 25 years ago. In addition, relying on data from Google Maps and Google Earth, the WEGAS (West-East Gondwana Amalgamation and its Separation) team observed that the 3 km ring is accompanied by other, smaller rings.
Such formations are inconsistent with meteorite impacts, which generally leave a single crater with a raised center. And as a general rule, these craters also measure between ten to twenty times the size of the meteorite itself – in this case, that would mean a meteorite 200 meters in diameter. This would mean that, had the ring structure been caused by a meteorite, it would have been the largest Antarctic meteor impact on record.
It is therefore understandable why the announcement of this ring structure triggered such speculation and interest. Meteorite impacts, especially record-breaking ones are nothing if not a hot news item. Too bad this does not appear to be the case.
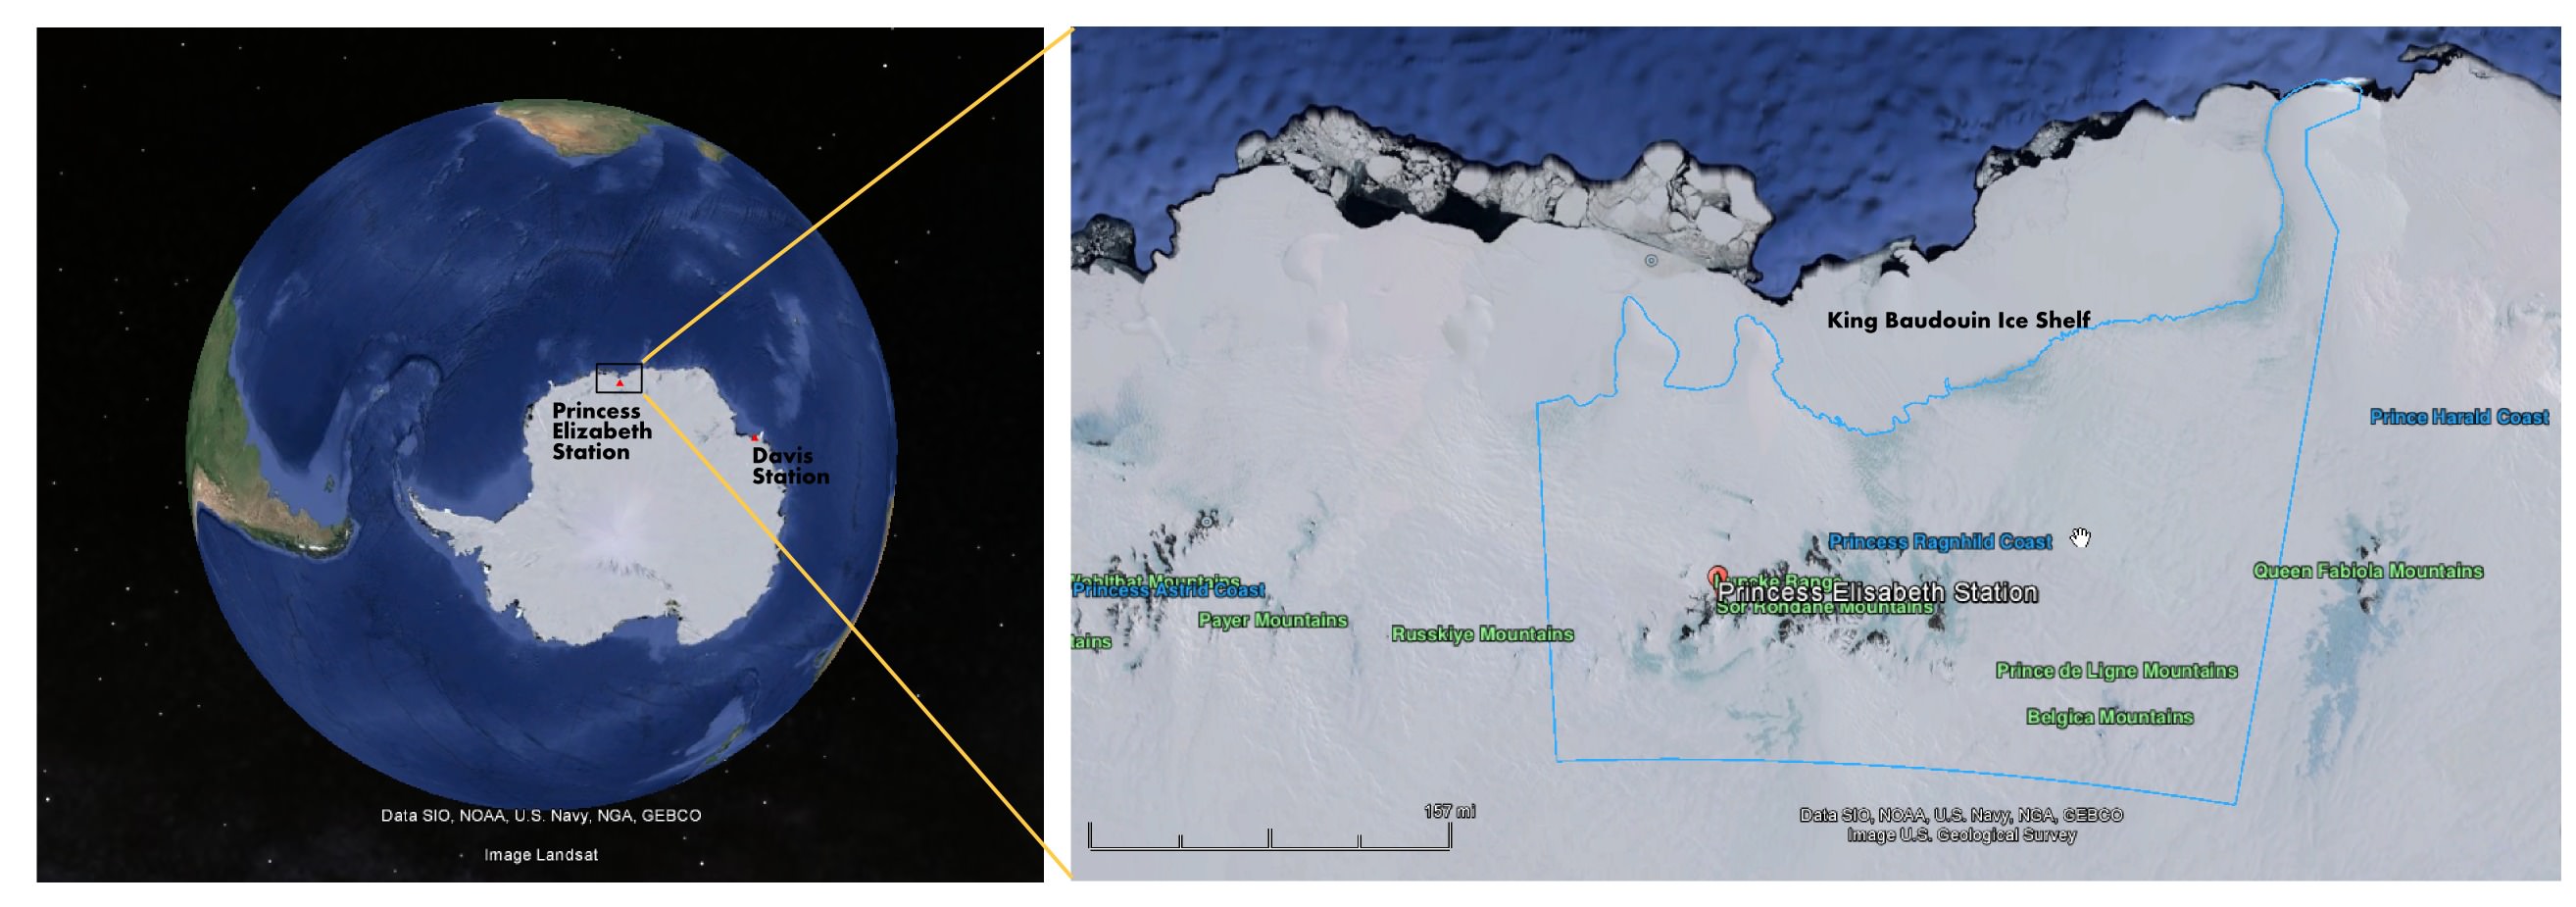
Location of the ring formation on the King Baudouin Ice Shelf off the Antarctic continent. Credit: Google Maps, NOAA
However, the possibility that the ring structure is the result of an ice doline raises a new host of interesting questions. For one, it would indicate that dolines are much more common in East Antarctica than previously thought. Ice dolines were first noticed in the regions of West Antarctica and the Antarctic Peninsula, where rapid warming is known to take place.
East Antarctica, by contrast, has long been understood to be the coldest, windiest and driest landmass on the planet. Knowing that such a place could produce rapid warming that would lead to the creation of a significant englacial lake would certainly force scientists to rethink what they know about this continent.
“To form an ice doline this size, it would need a considerable reservoir of melt water,” Eisen said. “Therefore we would need to ask, where did all this melt water come from? Which melting processes have caused such an amount of water and how does the melting fit into the climate pattern of East Antarctica?”
In the coming months, Eisen and the AWI scientists plant to analyze the data from the Polar 6 (Eisen’s mission) measurements thoroughly, in the hopes of getting all the facts straight. Also, Jan Lenaerts – a Belgian glaciologist with AWI – is planning an land-based expedition to the site; which unfortunately due to the short Antarctic summer season and the preparation time needed won’t be taking place until the end of 2015.
AWI’s Polar 6 aircraft takes off from the runway at the Princess Elisabeth Antarctica research station. Credit: International Polar Foundation / Jos Van Hemelrijck
But what is especially interesting, according to Eisen, is the rapid pace at which the debate surrounding the ring structure occurred. Within days of their announcement, the WEGAS team was astounded by the nature of the debate taking place in the media and on the internet (particularly Facebook), bringing together glaciologists from all around the world.
As Eisen put it in his blog entry, “For the WEGAS team, however, our experience of the last few days has shown that modern scientific discussion is not confined to the ivory towers of learned meetings, technical papers, and lecture halls, but that the public and social media play a tremendous role. For us, cut off from the modern world amongst the eternal ice, this new science seems to have happened at an almost breathtaking pace.”
This activity brought the discussion about the nature of the ring structure forward by several weeks, he claims, focusing attention on the true causes of the surprise discovery itself and comparing and contrasting possible theories.
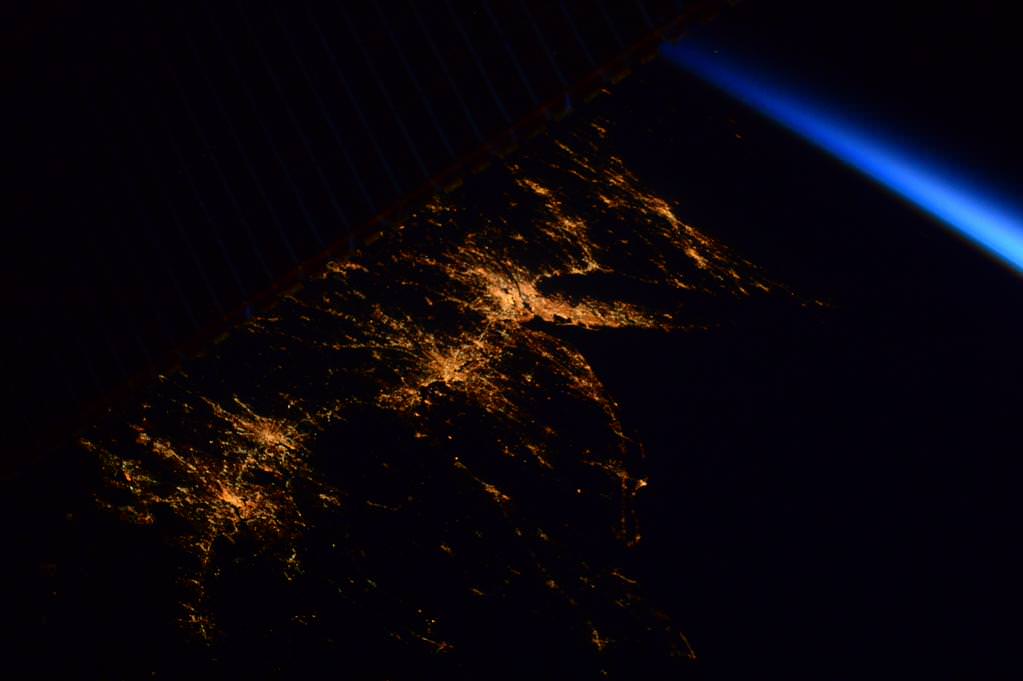
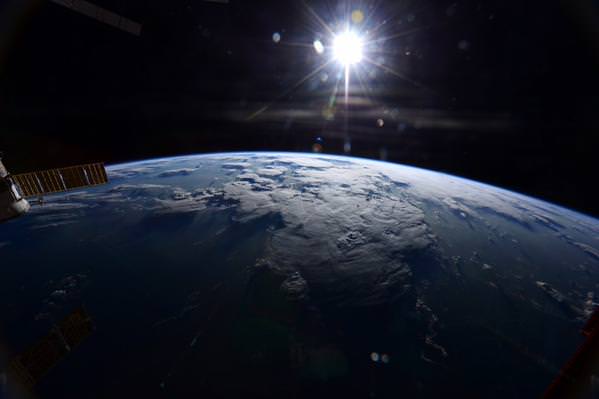
Here’s a collection of a few of the newest sunrises, auroras, landscapes, nightlights, and more snapshots from the multinational crew of six astronauts and cosmonauts living and working aboard the ISS orbiting some 250 miles (400 kilometers) overhead.
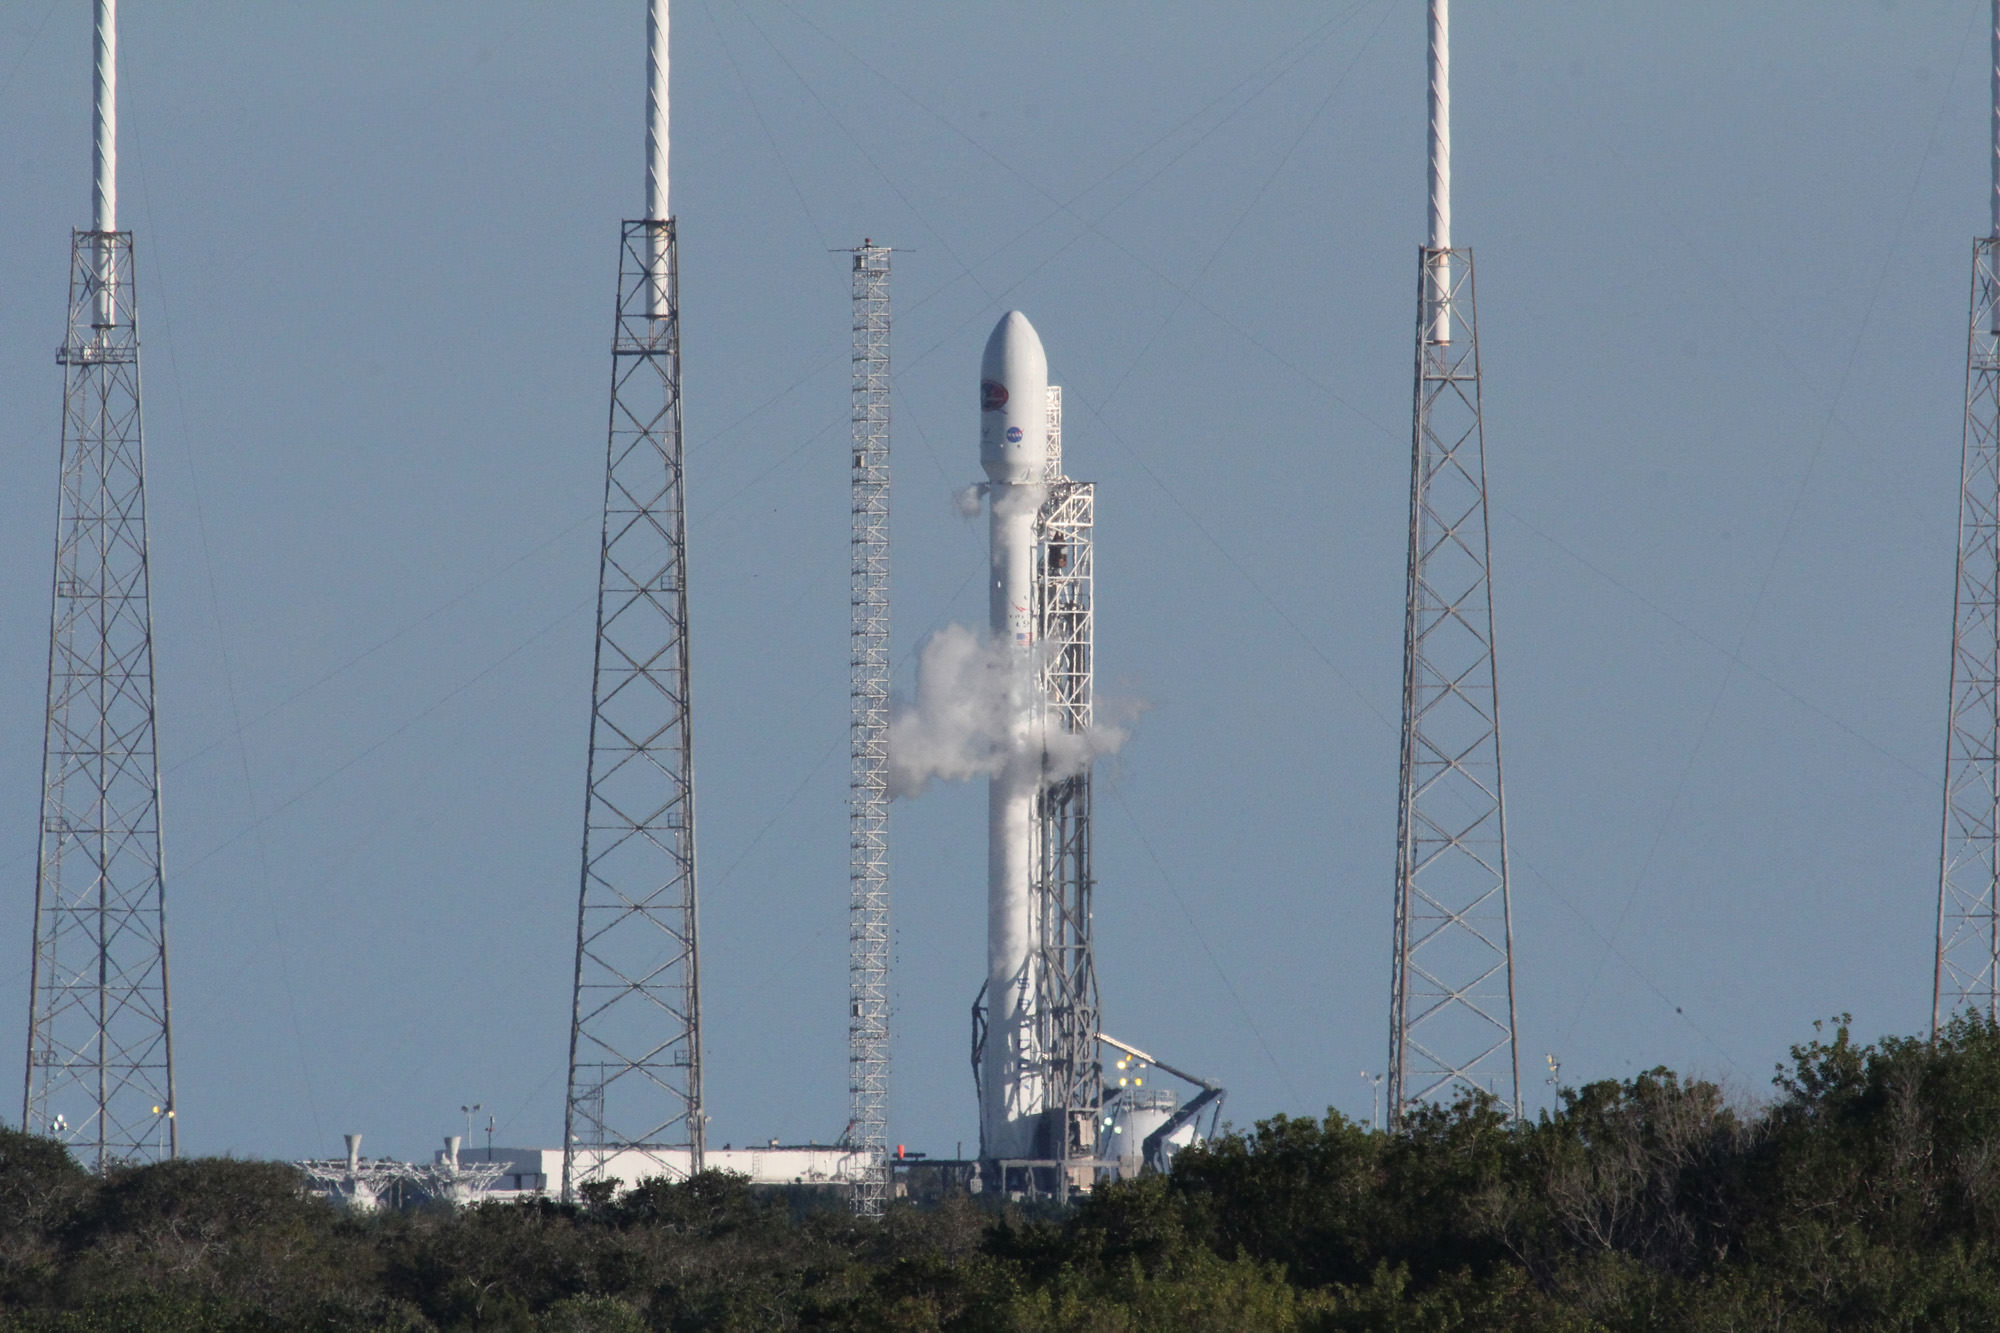
And don’t forget that at sunset tonight (Feb. 8), a SpaceXFalcon 9 rocket is due to blastoff at 6:10 p.m., EST, if all goes well carrying the DSCOVR space weather satellite about a million miles (1.5 million kilometers) away to the L1 Lagrange point.
The Falcon 9 will blastoff from Cape Canaveral, Florida, pictured below:
From Key West to the Gulf of Mexico and #Atlanta, a very nice, clear, half moonlit night. Credit: NASA/Terry Virts. KSC and Cape Canaveral launch pads along Florida east coast at right.
Tens of millions of you are included in the lead sunrise photo of the U.S. East Coast – taken by ESA astronaut Samantha Cristoforetti perched aboard the orbiting lab complex.
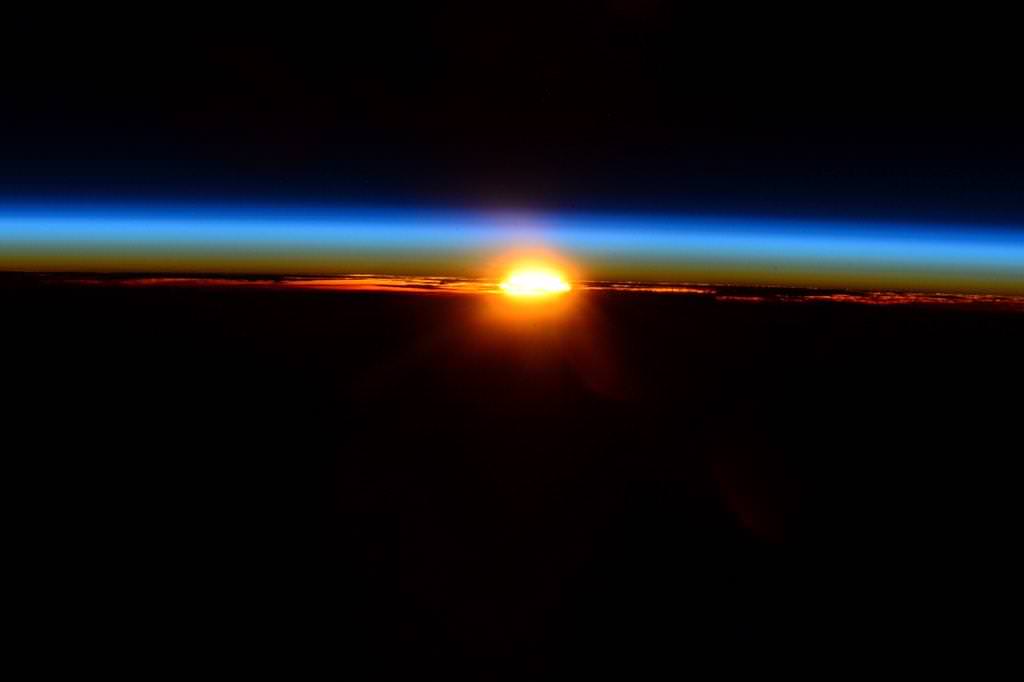
And here’s a “speechless sunrise” taken today by NASA astronaut Terry Virts. We agree!
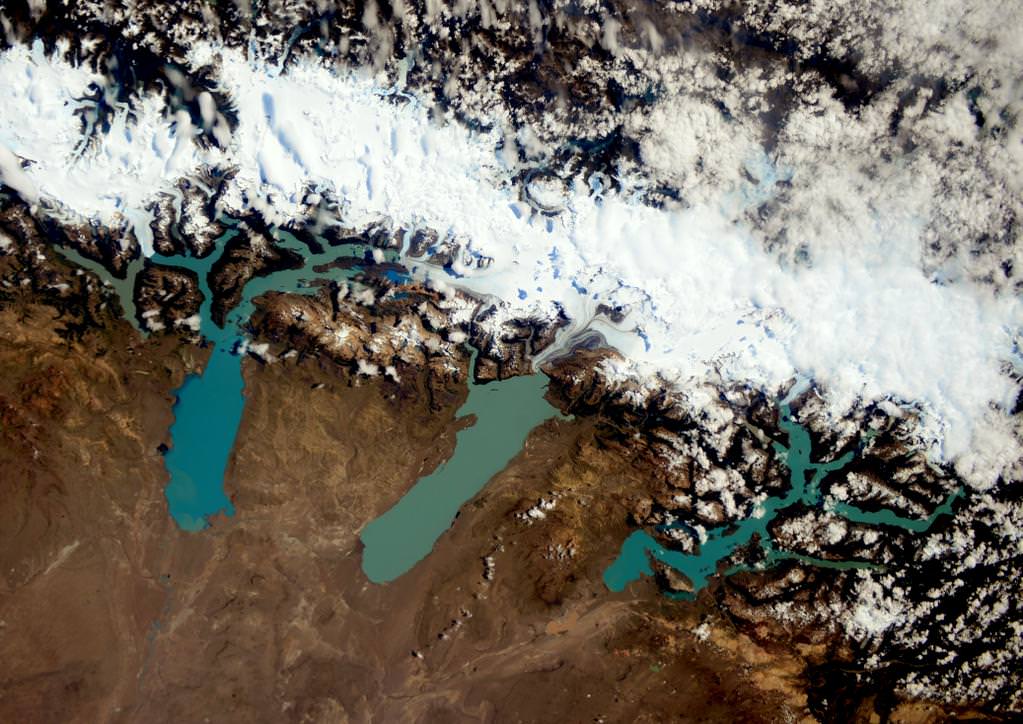
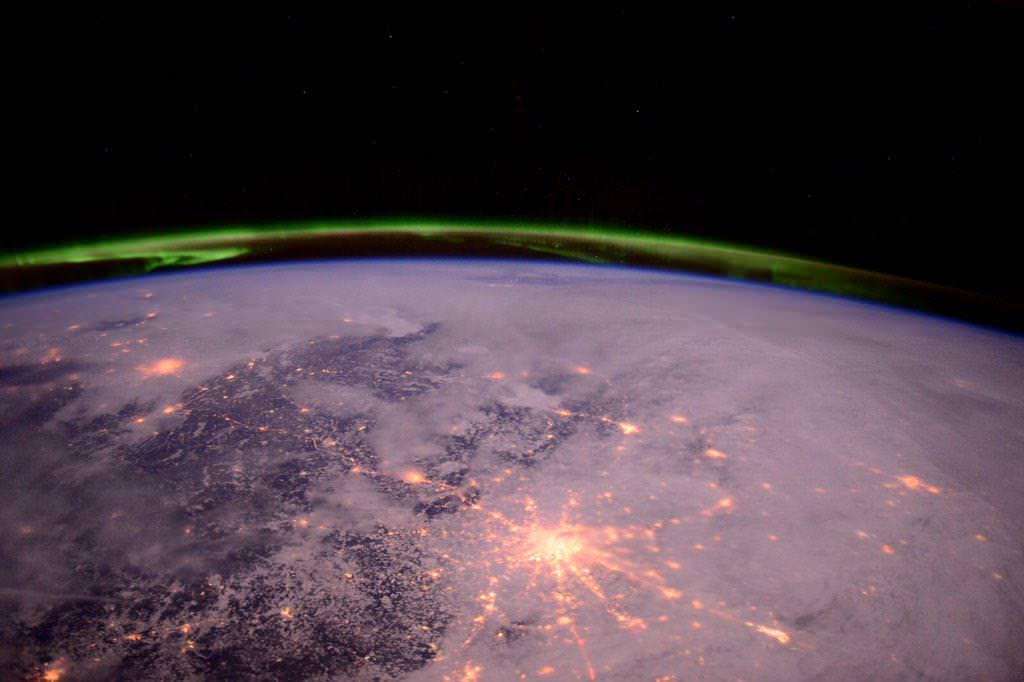
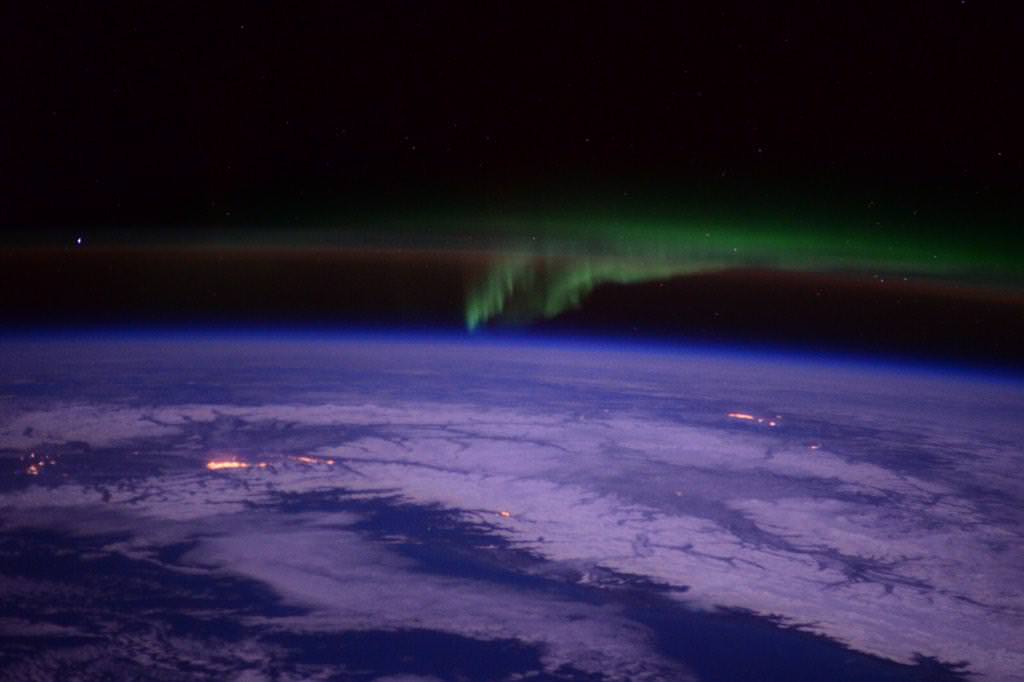
#speechless from this #sunrise. Credit: NASA/Terry VirtsAlways happy to see this lovely sight that has become familiar in #Patagonia. Credit: NASA/ESA/Samantha CristoforettiThis, on the contrary, I’ve seen only once: the Strait of Magellan and la Tierra del Fuego free of clouds! Credit: NASA/ESA/Samantha Cristoforetti#Moscow shining like a bright star under the aurora. Credit: NASA/Terry Virts#aurora over Anchorage and Fairbanks #Alaska. Credit: NASA/Terry Virts
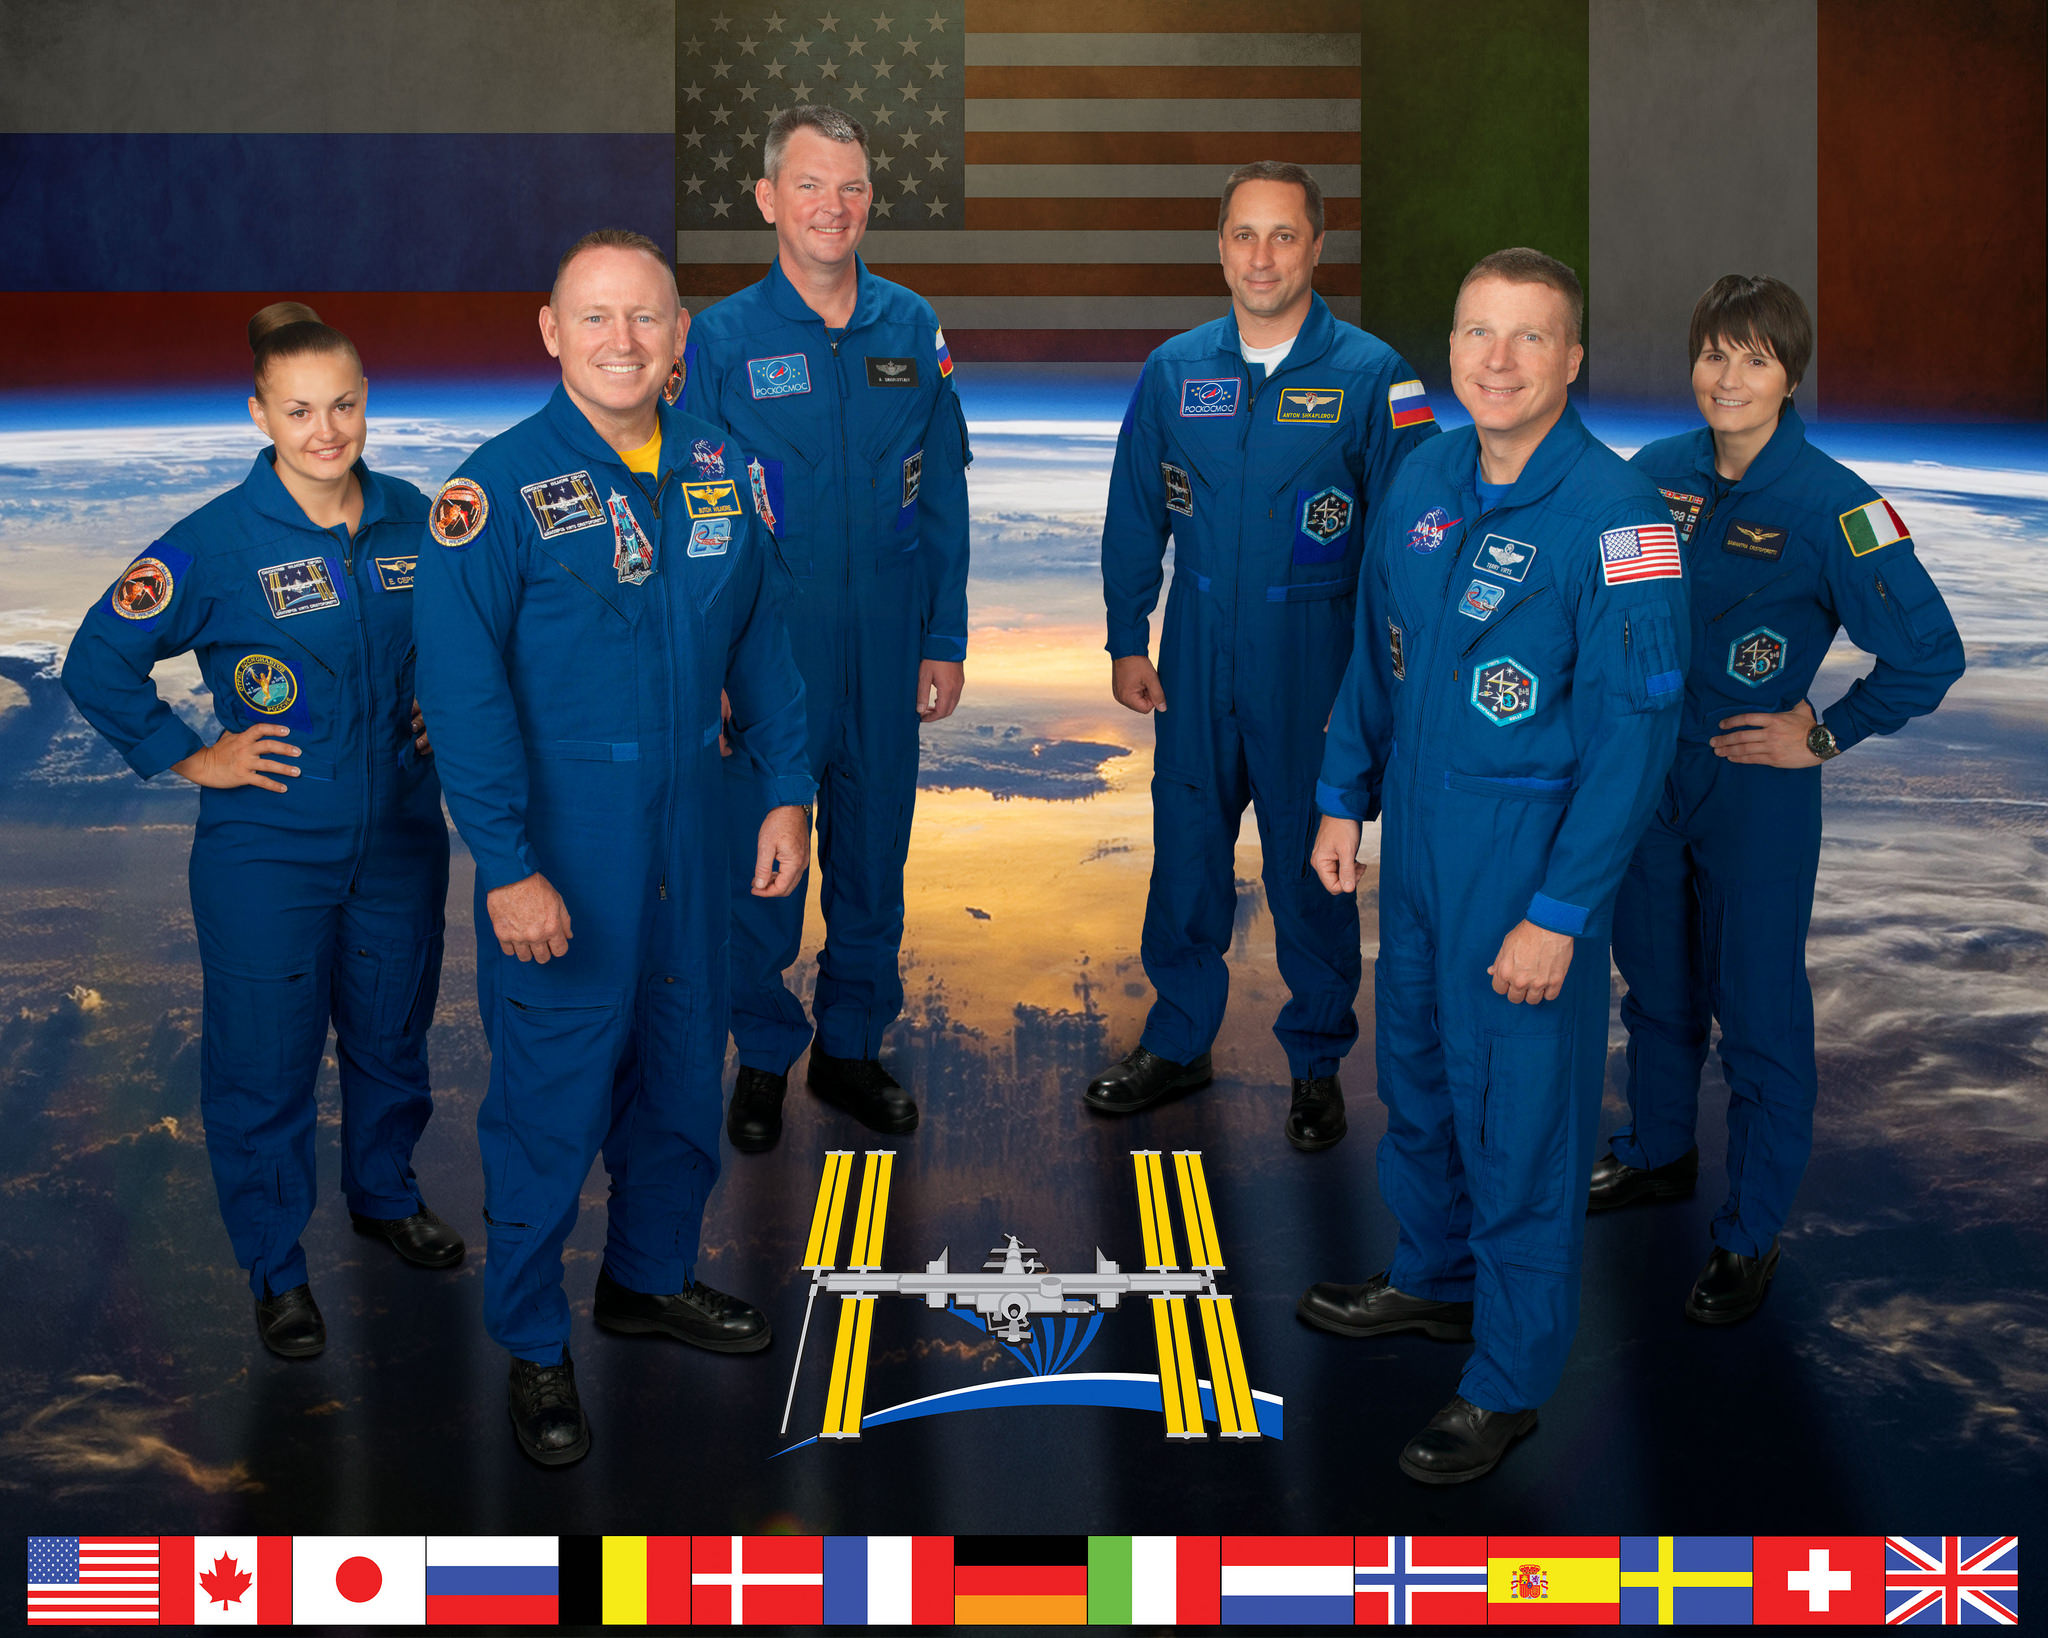
The current six person crew includes astronauts and cosmonauts from three nations; America, Russia and Italy including four men and two women serving aboard the massive orbiting lab complex.
They comprise Expedition 42 Commander Barry “Butch” Wilmore and Terry Virts from NASA, Samantha Cristoforetti from the European Space Agency (ESA) and cosmonauts Aleksandr Samokutyayev, Yelena Serova, and Anton Shkaplerov from Russia.
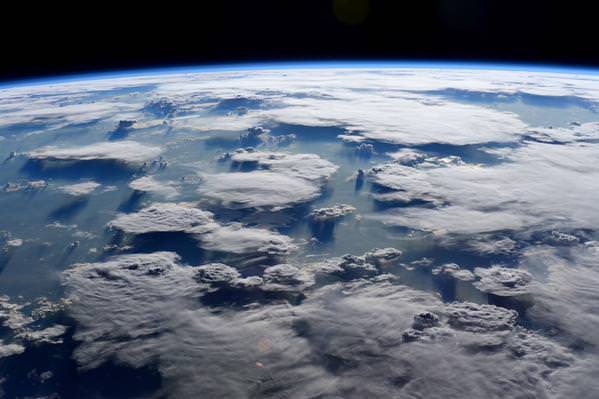
Brazilian clouds showing off their #majesty. Credit: NASA/Terry VirtsL+72/73: Logbook. Wow, this has been a busy week! But we can still catch up a little bit… ESA astronaut Samantha Cristoforetti
L+72/73: Logbook. Wow, this has been a busy week! But we can still catch up a little bit… ESA astronaut Samantha Cristoforetti
….https://plus.google.com/app/basic/stream/z12iczzoqovhfdo2z23odnbwmz3cir0ox04?cbp=1hmsp4t51xmr3&sview=27&cid=5&soc-app=115&soc-platform=1&spath=%2Fapp%2Fbasic%2F%2BSamanthaCristoforetti%2Fposts …
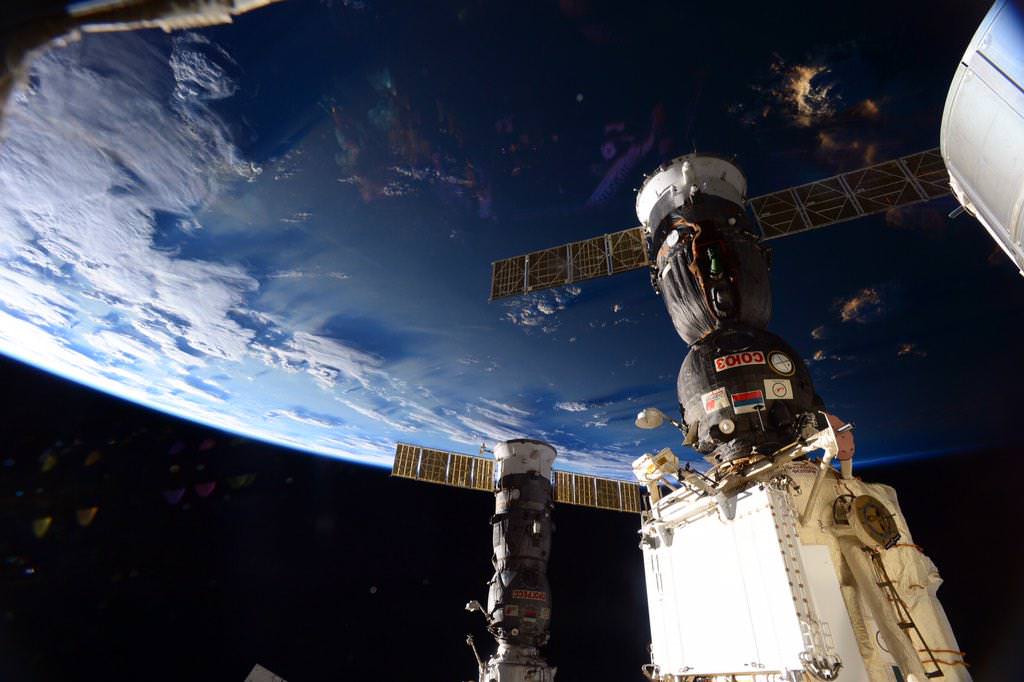
Soyuz- everyone’s ride to space and back!
#soyuz #earth #beauty. Credit: NASA/Terry Virts
Stay tuned here for Ken’s continuing Earth and planetary science and human spaceflight news.