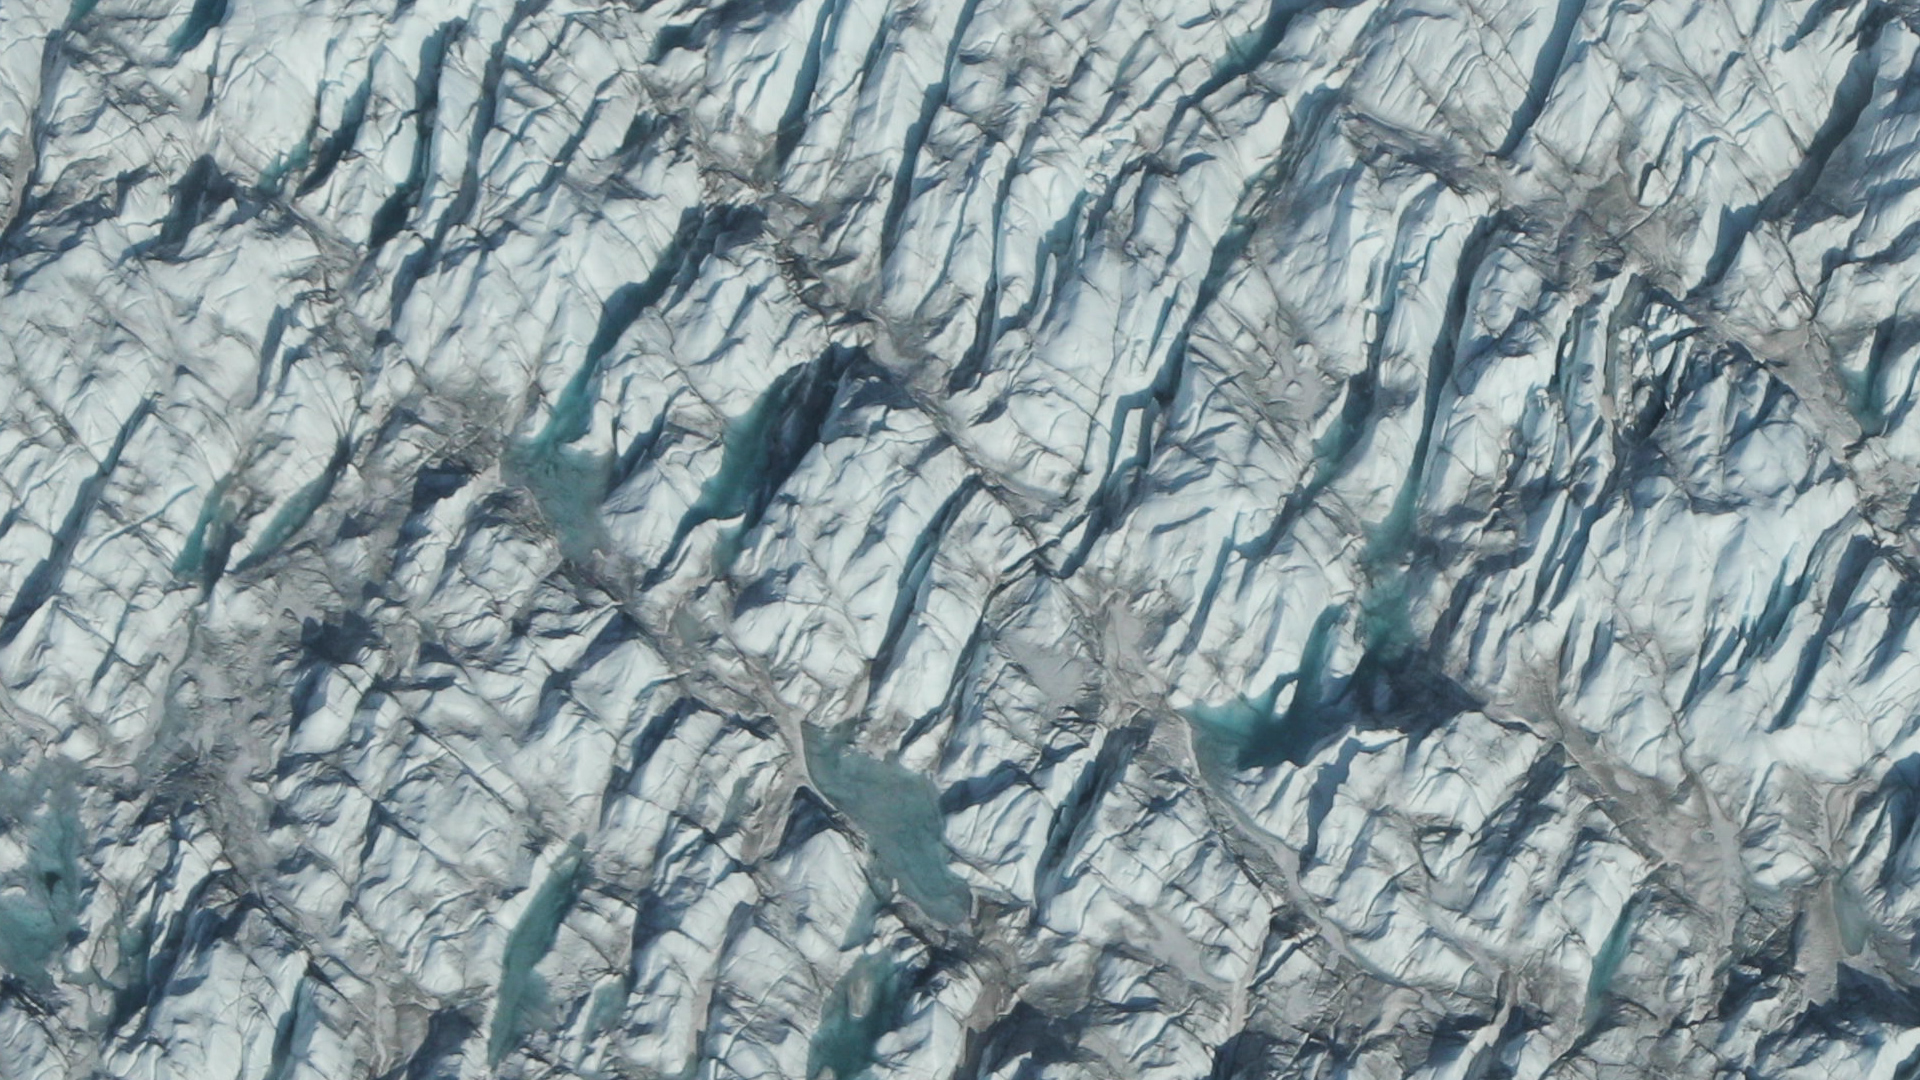
The Greenland ice sheet could be gone in a thousand years. Don't buy waterfront property. Image Credit: NASA
Great news! Humankind’s greatest-ever engineering project is nearing completion. Soon we will have warmed the Earth enough to get rid of all those pesky ice sheets and other frozen areas. The finish line is in sight.
If we all work together for the next thousand years, we’ll finally reach our goal!
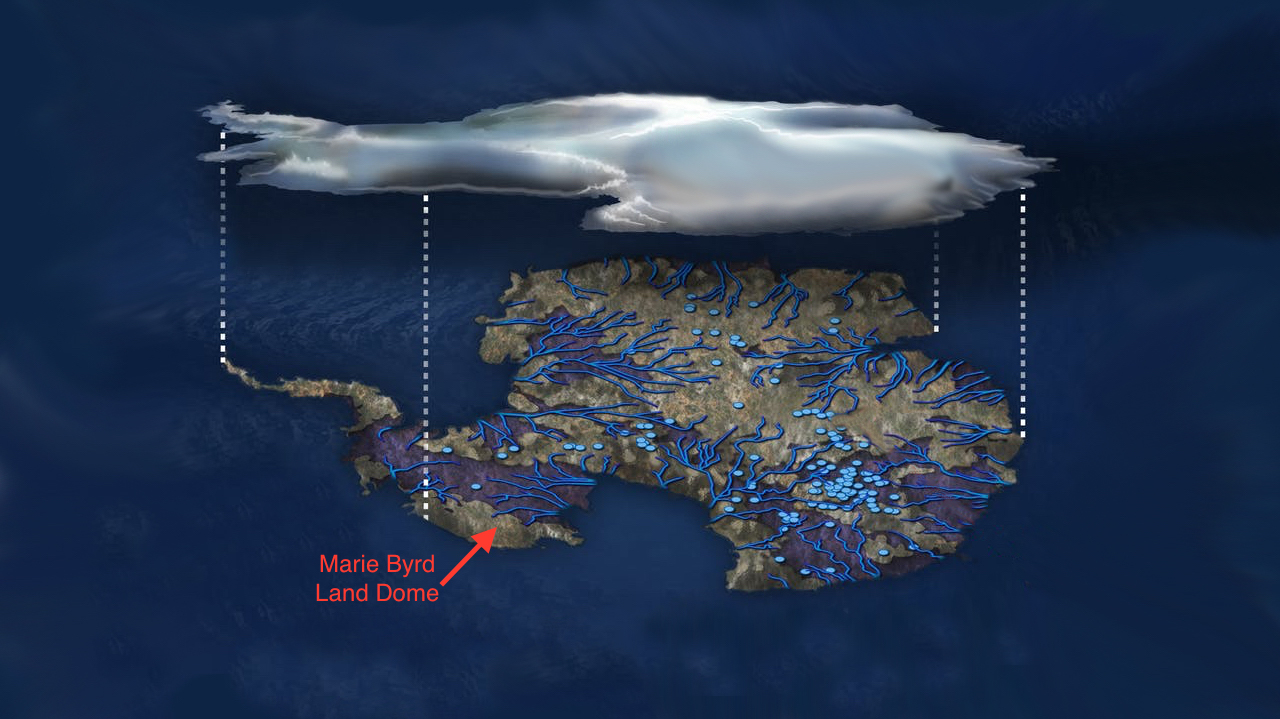
Illustration of flowing water under the Antarctic ice sheet. Blue dots indicate lakes, lines show rivers. Marie Byrd Land is part of the bulging "elbow" leading to the Antarctic Peninsula, left center. Credits: NSF/Zina Deretsky
Beneath the Antarctic ice sheet, there lies a continent that is covered by rivers and lakes, the largest of which is the size of Lake Erie. Over the course of a regular year, the ice sheet melts and refreezes, causing the lakes and rivers to periodically fill and drain rapidly from the melt water. This process makes it easier for Antarctica’s frozen surface to slide around, and to rise and fall in some places by as much as 6 meters (20 feet).
According to a new study led by researchers from NASA’s Jet Propulsion Laboratory, there may be a mantle plume beneath the area known as Marie Byrd Land. The presence of this geothermal heat source could explain some of the melting that takes place beneath the sheet and why it is unstable today. It could also help explain how the sheet collapsed rapidly in the past during previous periods of climate change.
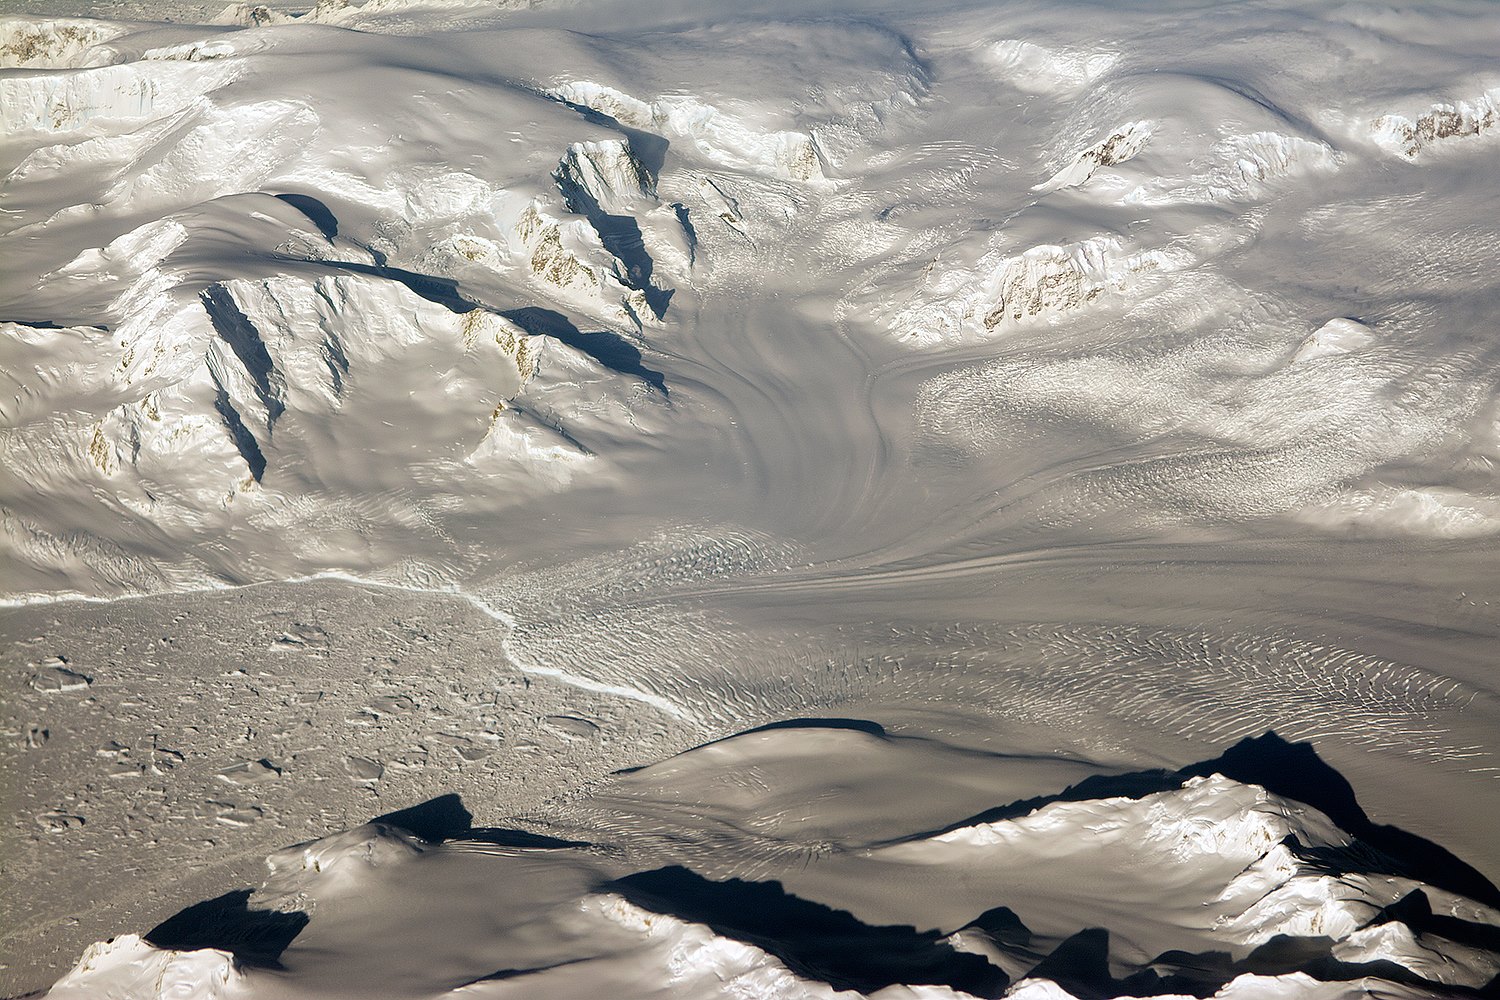
Glaciers seen during NASA’s Operation IceBridge research flight to West Antarctica on Oct. 29, 2014. Credit: NASA/Michael Studinger
The motion of Antarctica’s ice sheet over time has always been a source of interest to Earth scientists. By measuring the rate at which the ice sheet rises and falls, scientists are able to estimate where and how much water is melting at the base. It is because of these measurements that scientists first began to speculate about the presence of heat sources beneath Antarctica’s frozen surface.
The proposal that a mantle plume exists under Marie Byrd Land was first made 30 years ago by Wesley E. LeMasurier, a scientist from the University of Colorado Denver. According to the research he conducted, this constituted a possible explanation for regional volcanic activity and a topographic dome feature. But it was only more recently that seismic imaging surveys offered supporting evidence for this mantle plume.
However, direct measurements of the region beneath Marie Byrd Land is not currently possible. Hence why Seroussi and Erik Ivins of the JPL relied on the Ice Sheet System Model (ISSM) to confirm the existence of the plume. This model is essentially a numerical depiction of the physics of the ice sheet, which was developed by scientists at the JPL and the University of California, Irvine.
To ensure that the model was realistic, Seroussi and her team drew on observations of changes in altitude of the ice sheet made over the course of many years. These were conducted by NASA’s Ice, Clouds, and Land Elevation Satellite (ICESat) and their airborne Operation IceBridge campaign. These missions have been measuring the Antarctic ice sheet for years, which have led tot he creation of very accurate three-dimensional elevation maps.
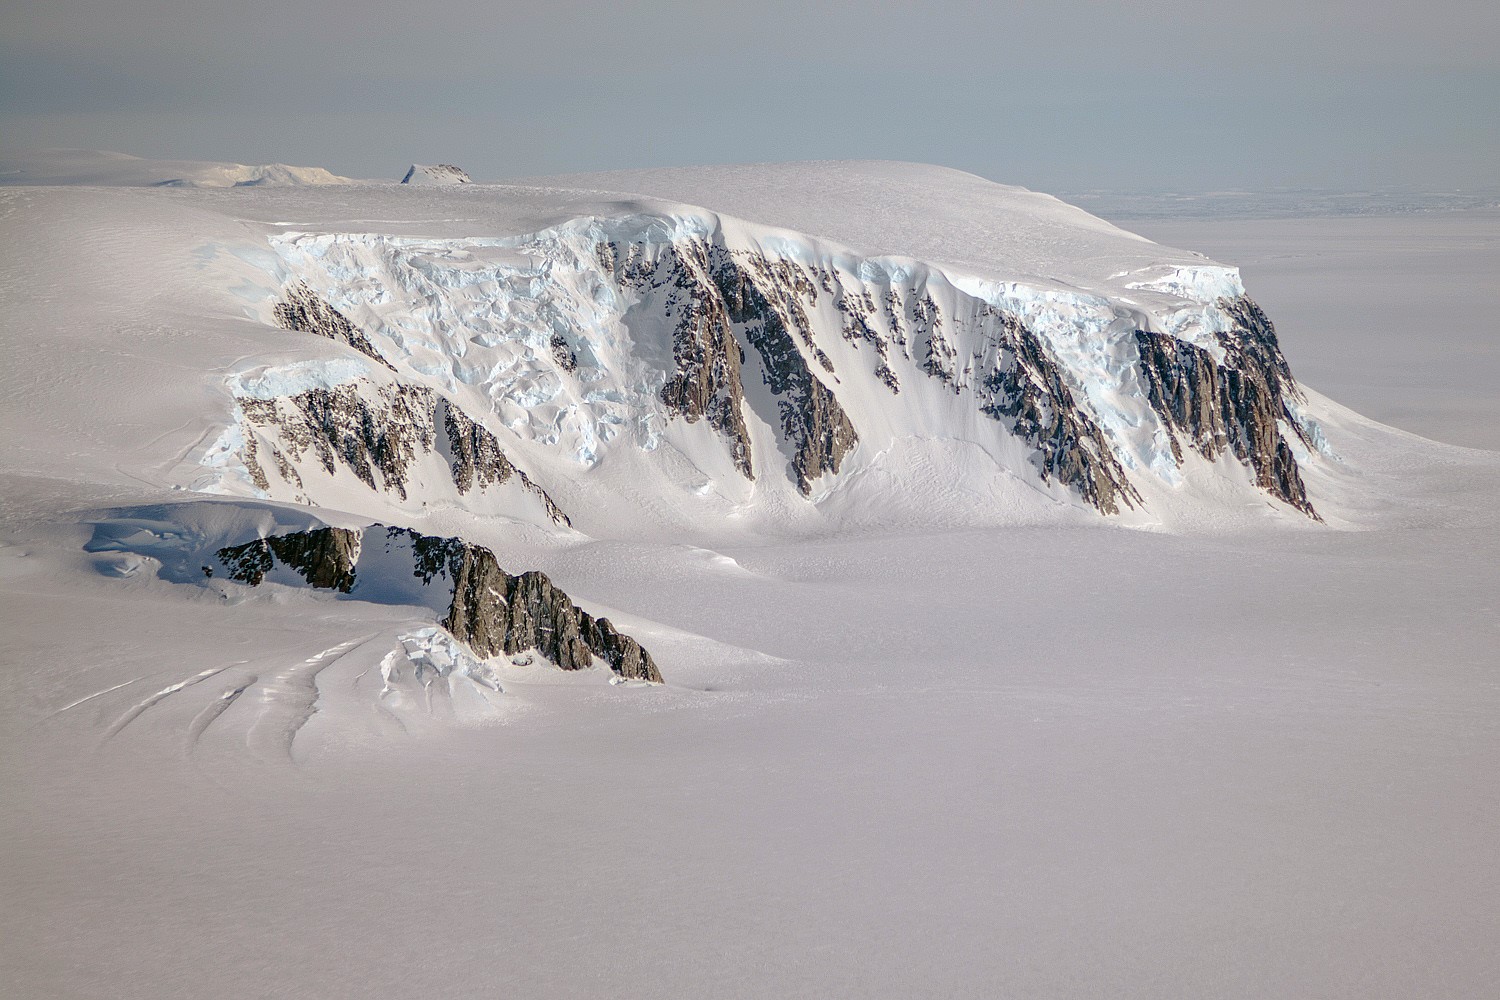
A view of mountains and glaciers in Antarctica’s Marie Byrd Land seen during the Nov. 2nd, 2014, IceBridge survey flight. Credit: NASA / Michael Studinger
Seroussi also enhanced the ISSM to include natural sources of heating and heat transport that result in freezing, melting, liquid water, friction, and other processes. This combined data placed powerful constrains on the allowable melt rates in Antarctica, and allowed the team to run dozens of simulations and test a wide range of possible locations for the mantle plume.
What they found was that the heat flux caused by the mantle plume would not exceed more than 150 milliwatts per square meter. By comparison, regions where there is no volcanic activity typically experience a feat flux of between 40 and 60 milliwatts, whereas geothermal hotspots – like the one under Yellowstone National Park – experience an average of about 200 milliwatts per square meter.
Where they conducted simulations that exceeded 150 millwatts per square meter, the melt rate was too high compared to the space-based data. Except in one location, which was an area inland of the Ross Sea, which is known to experience intense flows of water. This region required a heat flow of at least 150 to 180 milliwatts per square meter to align with its observed melt rates.
In this region, seismic imaging has also shown that heating might reach the ice sheet through a rift in the Earth’s mantle. This too is consistent with a mantle plume, which are thought to be narrow streams of hot magma rising through the Earth’s mantle and spreading out under the crust. This viscous magma then balloons under the crust and causes it to bulge upward.
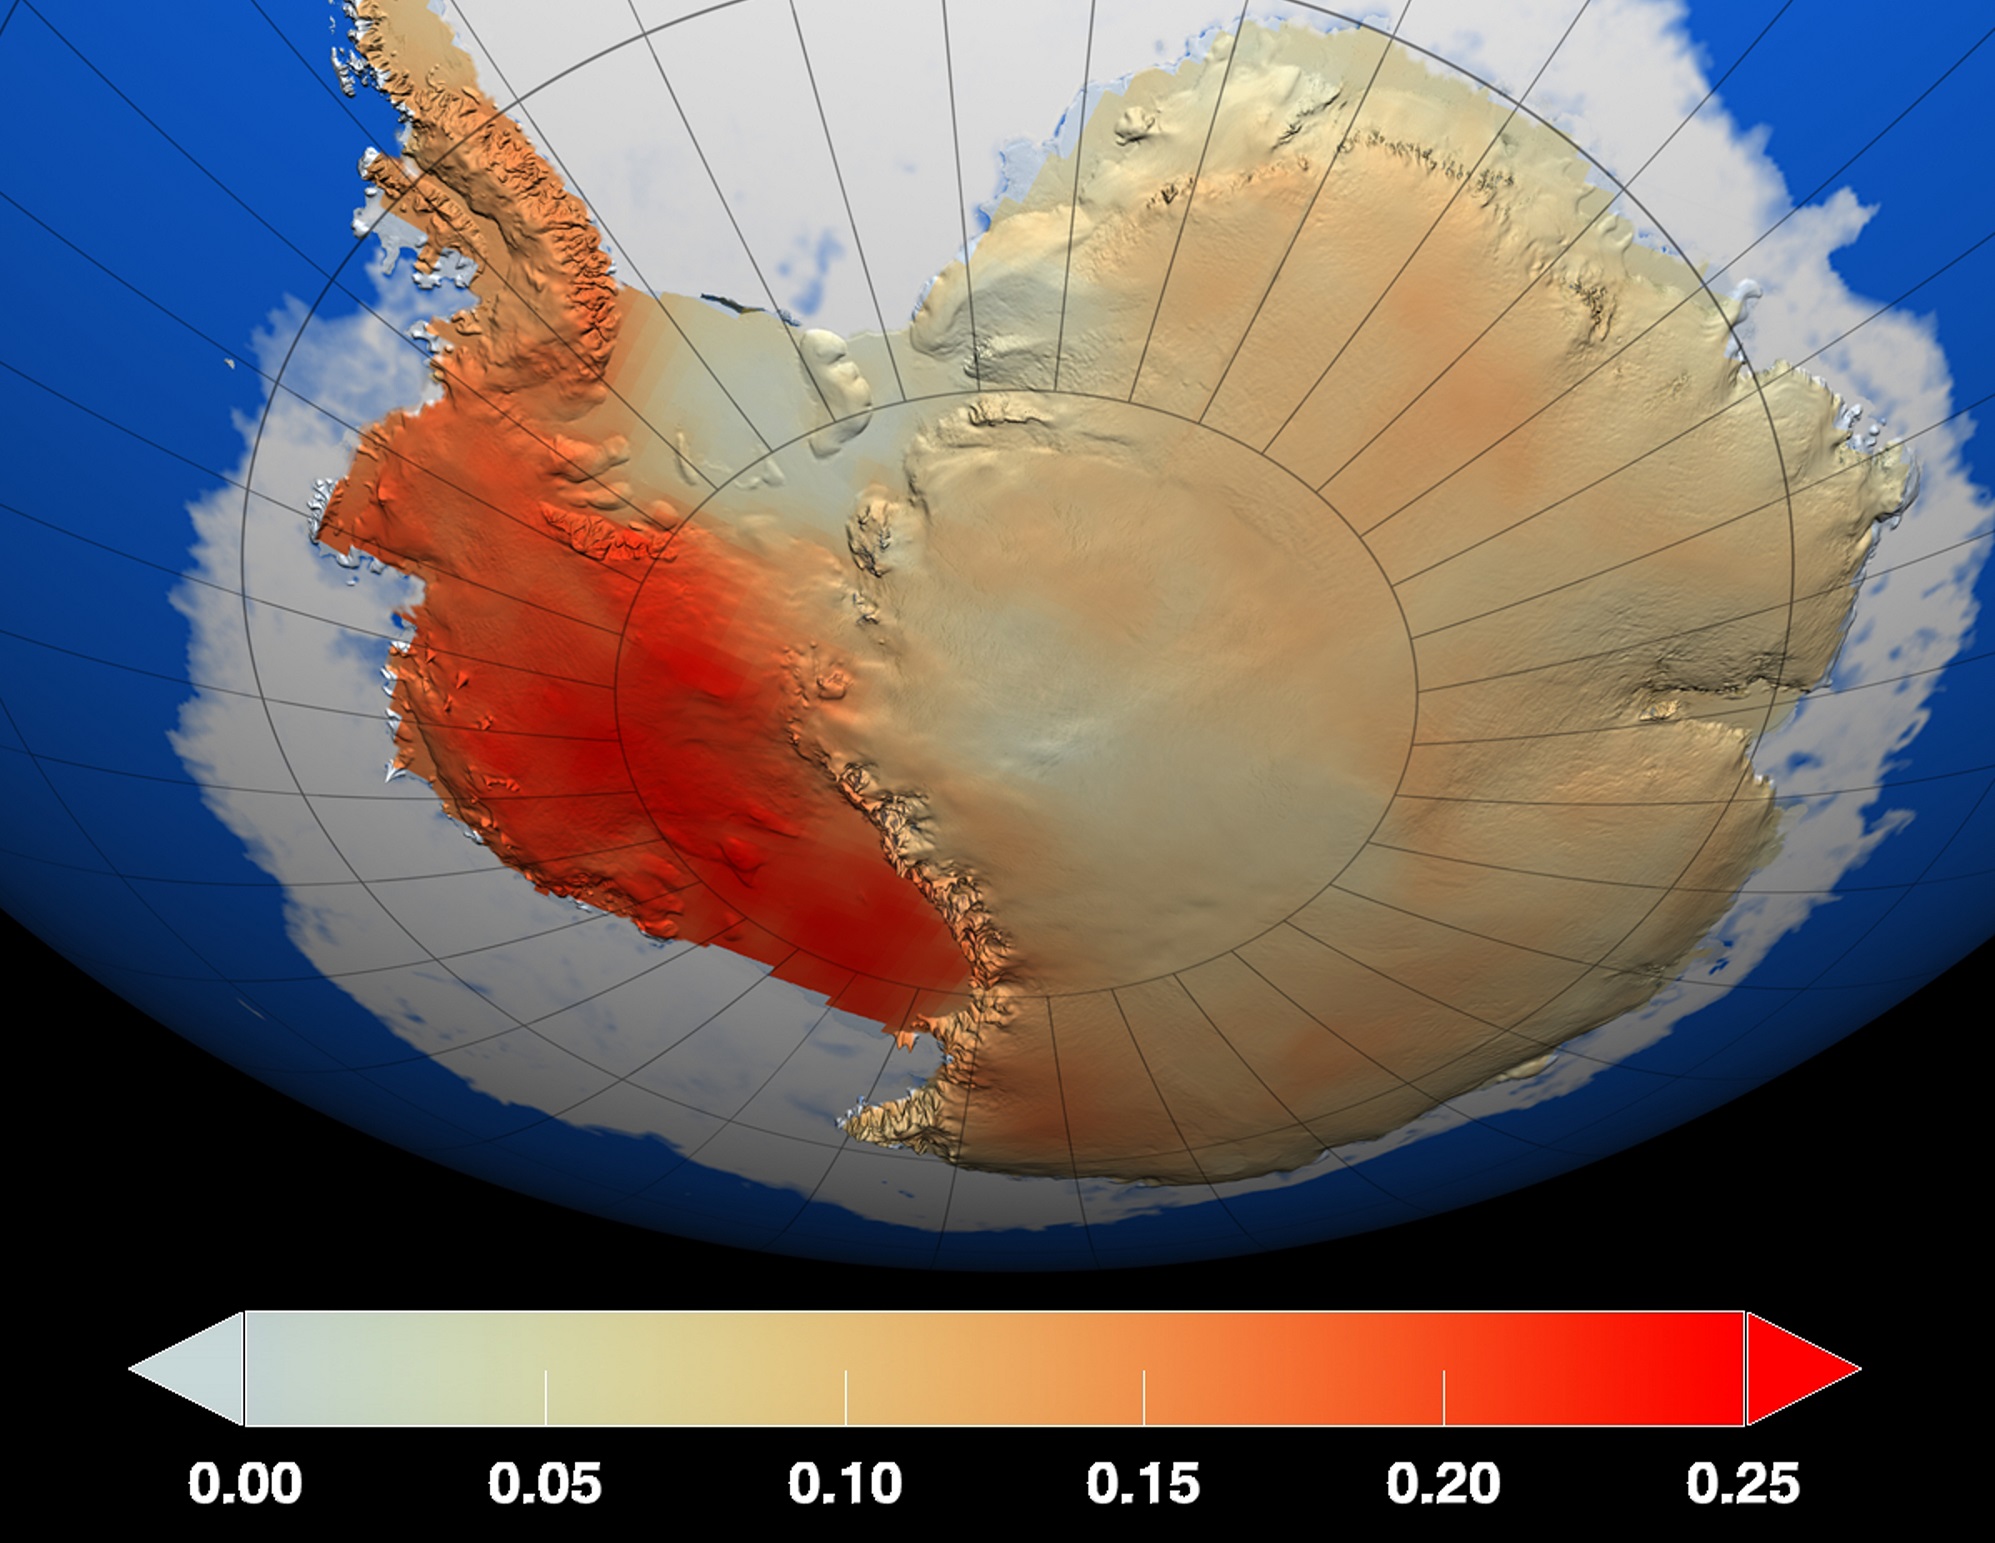
Temperature changes in the Antarctic ice sheet over the last 50 years, measured in degrees Celsius. Credit: NASA/GSFC Scientific Visualization Studio
Where ice lies over top of the plume, this process transfers heat into the ice sheet, triggering significant melting and runoff. In the end, Seroussi and her colleagues provide compelling evidence – based on a combination of surface and seismic data – for a surface plume beneath the ice sheet of West Antarctica. They also estimate that this mantle plume formed roughly 50 to 110 million years ago, long before the West Antarctic ice sheet came into existence.
Roughly 11,000 years ago, when the last ice age ended, the ice sheet experienced a period of rapid, sustained ice loss. As global weather patterns and rising sea levels began to change, warm water was pushed closer to the ice sheet. Seroussi and Irvins study suggests that the mantle plume could be facilitating this kind of rapid loss today, much as it did during the last onset of an inter-glacial period.
Understanding the sources of ice sheet loss under West Antarctica is important as far as estimating the rate at which ice may be lost there, which is essentially to predicting the effects of climate change. Given that Earth is once again going through global temperature changes – this time, due to human activity – it is essential to creating accurate climate models that will let us know how rapidly polar ice will melt and sea levels will rise.
It also informs our understanding of how our planet’s history and climate shifts are linked, and what effect these had on its geological evolution.
New topography map of Antarctica by the British Antarctic Survey's Bedmap2 (NASA/GSFC)
Although it sits isolated at the “bottom of the world” Antarctica is one of the most influential continents on Earth, affecting weather, climate, and ocean current patterns over the entire planet. But Antarctica is also one of the most enigmatic landmasses too, incredibly remote, extremely harsh, and covered by a layer of ice over 2 km thick. And as Earth’s global temperature continues to climb steadily higher, the future of ice in Antarctica — a continent half again as large as the contiguous United States — is a big concern for scientists… but in order to know exactly how its ice will behave to changing conditions, they need to know what’s under it.
This is where the British Antarctic Survey — using data gathered by NASA’s ICESat and Operation IceBridge missions — comes in, giving us a better view of what lies beneath the southern continent’s frozen veil.
A new dataset called Bedmap2 gives a clearer picture of Antarctica from the ice surface down to the bedrock below. Bedmap2 is a significant improvement on the previous collection of Antarctic data — known as Bedmap — that was produced more than 10 years ago. The product was a result of work led by the British Antarctic Survey, where researchers compiled decades worth of geophysical measurements, such as surface elevation measurements from NASA’s Ice, Cloud and Land Elevation Satellite (ICESat) and ice thickness data collected by Operation IceBridge.
Bedmap2, like the original Bedmap, is a collection of three datasets—surface elevation, ice thickness and bedrock topography. Both Bedmap and Bedmap2 are laid out as grids covering the entire continent, but with a tighter grid spacing Bedmap2 includes many surface and sub-ice features too small to be seen in the previous dataset. Additionally, the extensive use of GPS data in more recent surveys improves the precision of the new dataset.
Improvements in resolution, coverage and precision will lead to more accurate calculations of ice volume and potential contribution to sea level rise.
Ice sheet researchers use computer models to simulate how ice sheets will respond to changes in ocean and air temperatures. An advantage of these simulations is that they allow testing of many different climate scenarios, but the models are limited by how accurate the data on ice volume and sub-ice terrain are.
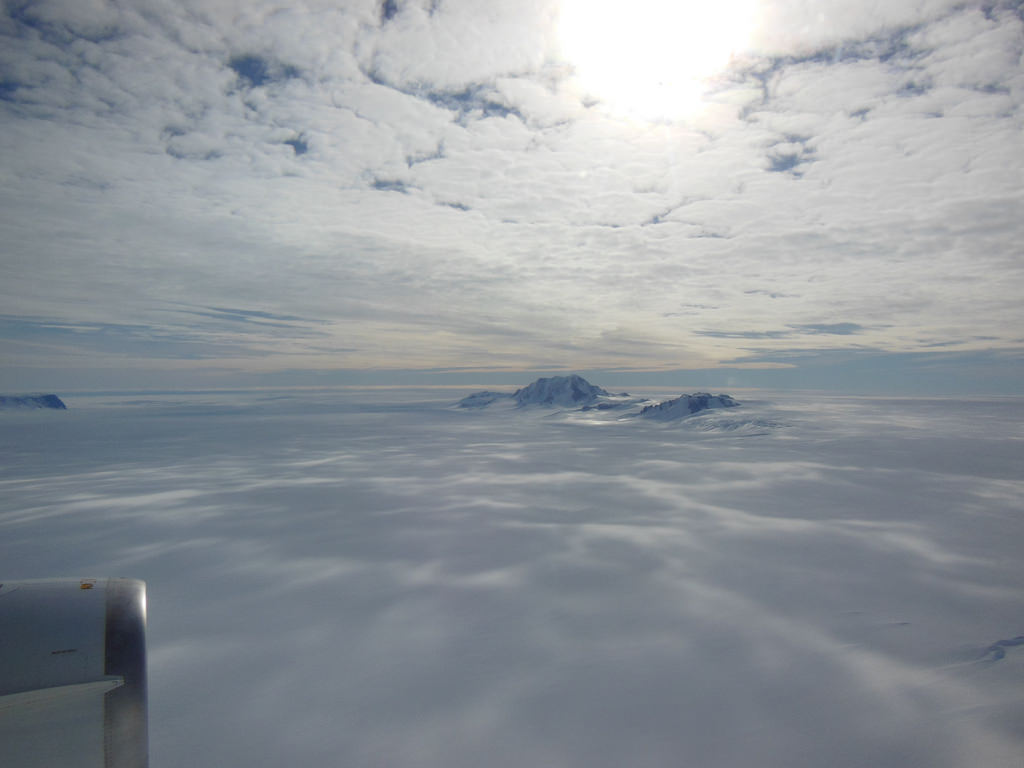
Only the tips of many of Antarctica’s mountains are visible above thousands of feet of ice. (Oct. 2012 IceBridge photo. Credit: NASA / Christy Hansen)
“In order to accurately simulate the dynamic response of ice sheets to changing environmental conditions, such as temperature and snow accumulation, we need to know the shape and structure of the bedrock below the ice sheets in great detail,” said Michael Studinger, IceBridge project scientist at NASA Goddard.
Knowing what the bedrock looks like is important for ice sheet modeling because features in the bed control the ice’s shape and affect how it moves. Ice will flow faster on a downhill slope, while an uphill slope or bumpy terrain can slow an ice sheet down or even hold it in place temporarily. “The shape of the bed is the most important unknown, and affect how ice can flow,” said Nowicki. “You can influence how honey spreads on your plate, by simply varying how you hold your plate.” The vastly improved bedrock data included in Bedmap2 should provide the level of detail needed for models to be realistic.
Bedmap2 data of Antarctica’s bedrock. Verical elevation has been exaggerated by 17x. (NASA/GSFC)
“It will be an important resource for the next generation of ice sheet modelers, physical oceanographers and structural geologists,” said Peter Fretwell, BAS scientist and lead author.
The BAS’ work was published recently in the journal The Cryosphere. Read more on the original release by George Hale here.
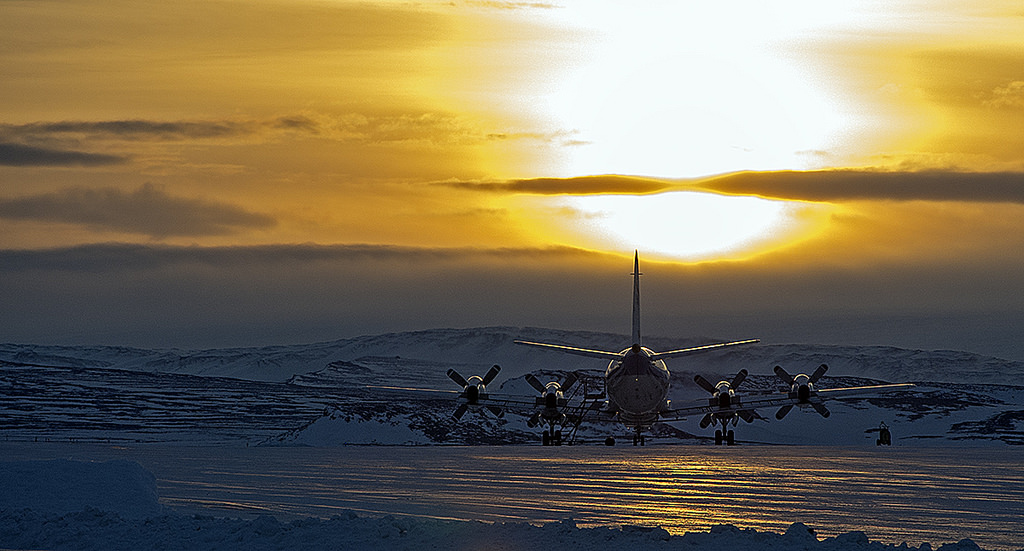
NASA P-3B waits outside the hangar at Thule Air Base with the Greenland Ice sheet in the background. The aircraft is set to begin the 2013 season of NASA’s Operation IceBridge mission to survey Earth's polar ice sheets in unprecedented three-dimensional detail. The plane just arrived from NASA Wallops Flight Facility in Virginia - see my P-3B photos below. Credit: NASA/Goddard/Michael Studinger
NASA’s Operation IceBridge has begun the 2013 research season of Ice Science flights in Greenland and the Arctic to survey the regions ice sheets and land and sea ice using a specially equipped P-3B research aircraft from NASA’s Wallops Flight Facility in Wallops Island, Va.
Operation IceBridge began in 2009 as part of NASA’s six-year long effort to conduct the largest airborne survey of Earth’s polar ice ever flown.
The goal is to obtain an unprecedented three-dimensional, multi-instrument view of the behavior of Greenland, Arctic and Antarctic ice sheets, ice shelves and sea ice which have been undergoing rapid and dramatic changes and reductions.
“We’re starting to see how the whole ice sheet is changing,” said Michael Studinger, IceBridge project scientist at NASA’s Goddard Space Flight Center in Greenbelt, Md. “Thinning at the margins is now propagating to the interior.”
The P-3 exiting the hanger pre-flight in Thule. Credit: NASA
The airborne campaign was started in order to maintain a continuous record of measurements in changes in polar ice after NASA’s Earth orbiting ICESat (Ice, Cloud and Land Elevation Satellite) probe stopped collecting data in 2009.
ICESat-2 won’t be launched until 2016, so NASA’s IceBridge project and yearly P-3 airborne campaigns will fill in the science data gap in the interval.
The P-3B Orion just arrived from NASA’s Wallops Flight Facility in Virginia where I visited it before departure – see my P-3B photos herein.
NASA IceBridge P-3B research aircraft prepares for departure from runway at NASA Wallops Flight Facility in Virginia to Thule Air Base in Greenland. Credit: Ken Kremer (kenkremer.com)
IceBridge is operating out of airfields in Thule and Kangerlussuaq, Greenland, and Fairbanks, Alaska.
The P-3B survey flights over Greenland and the Arctic will continue until May. They are conducted over Antarctica during October and November.
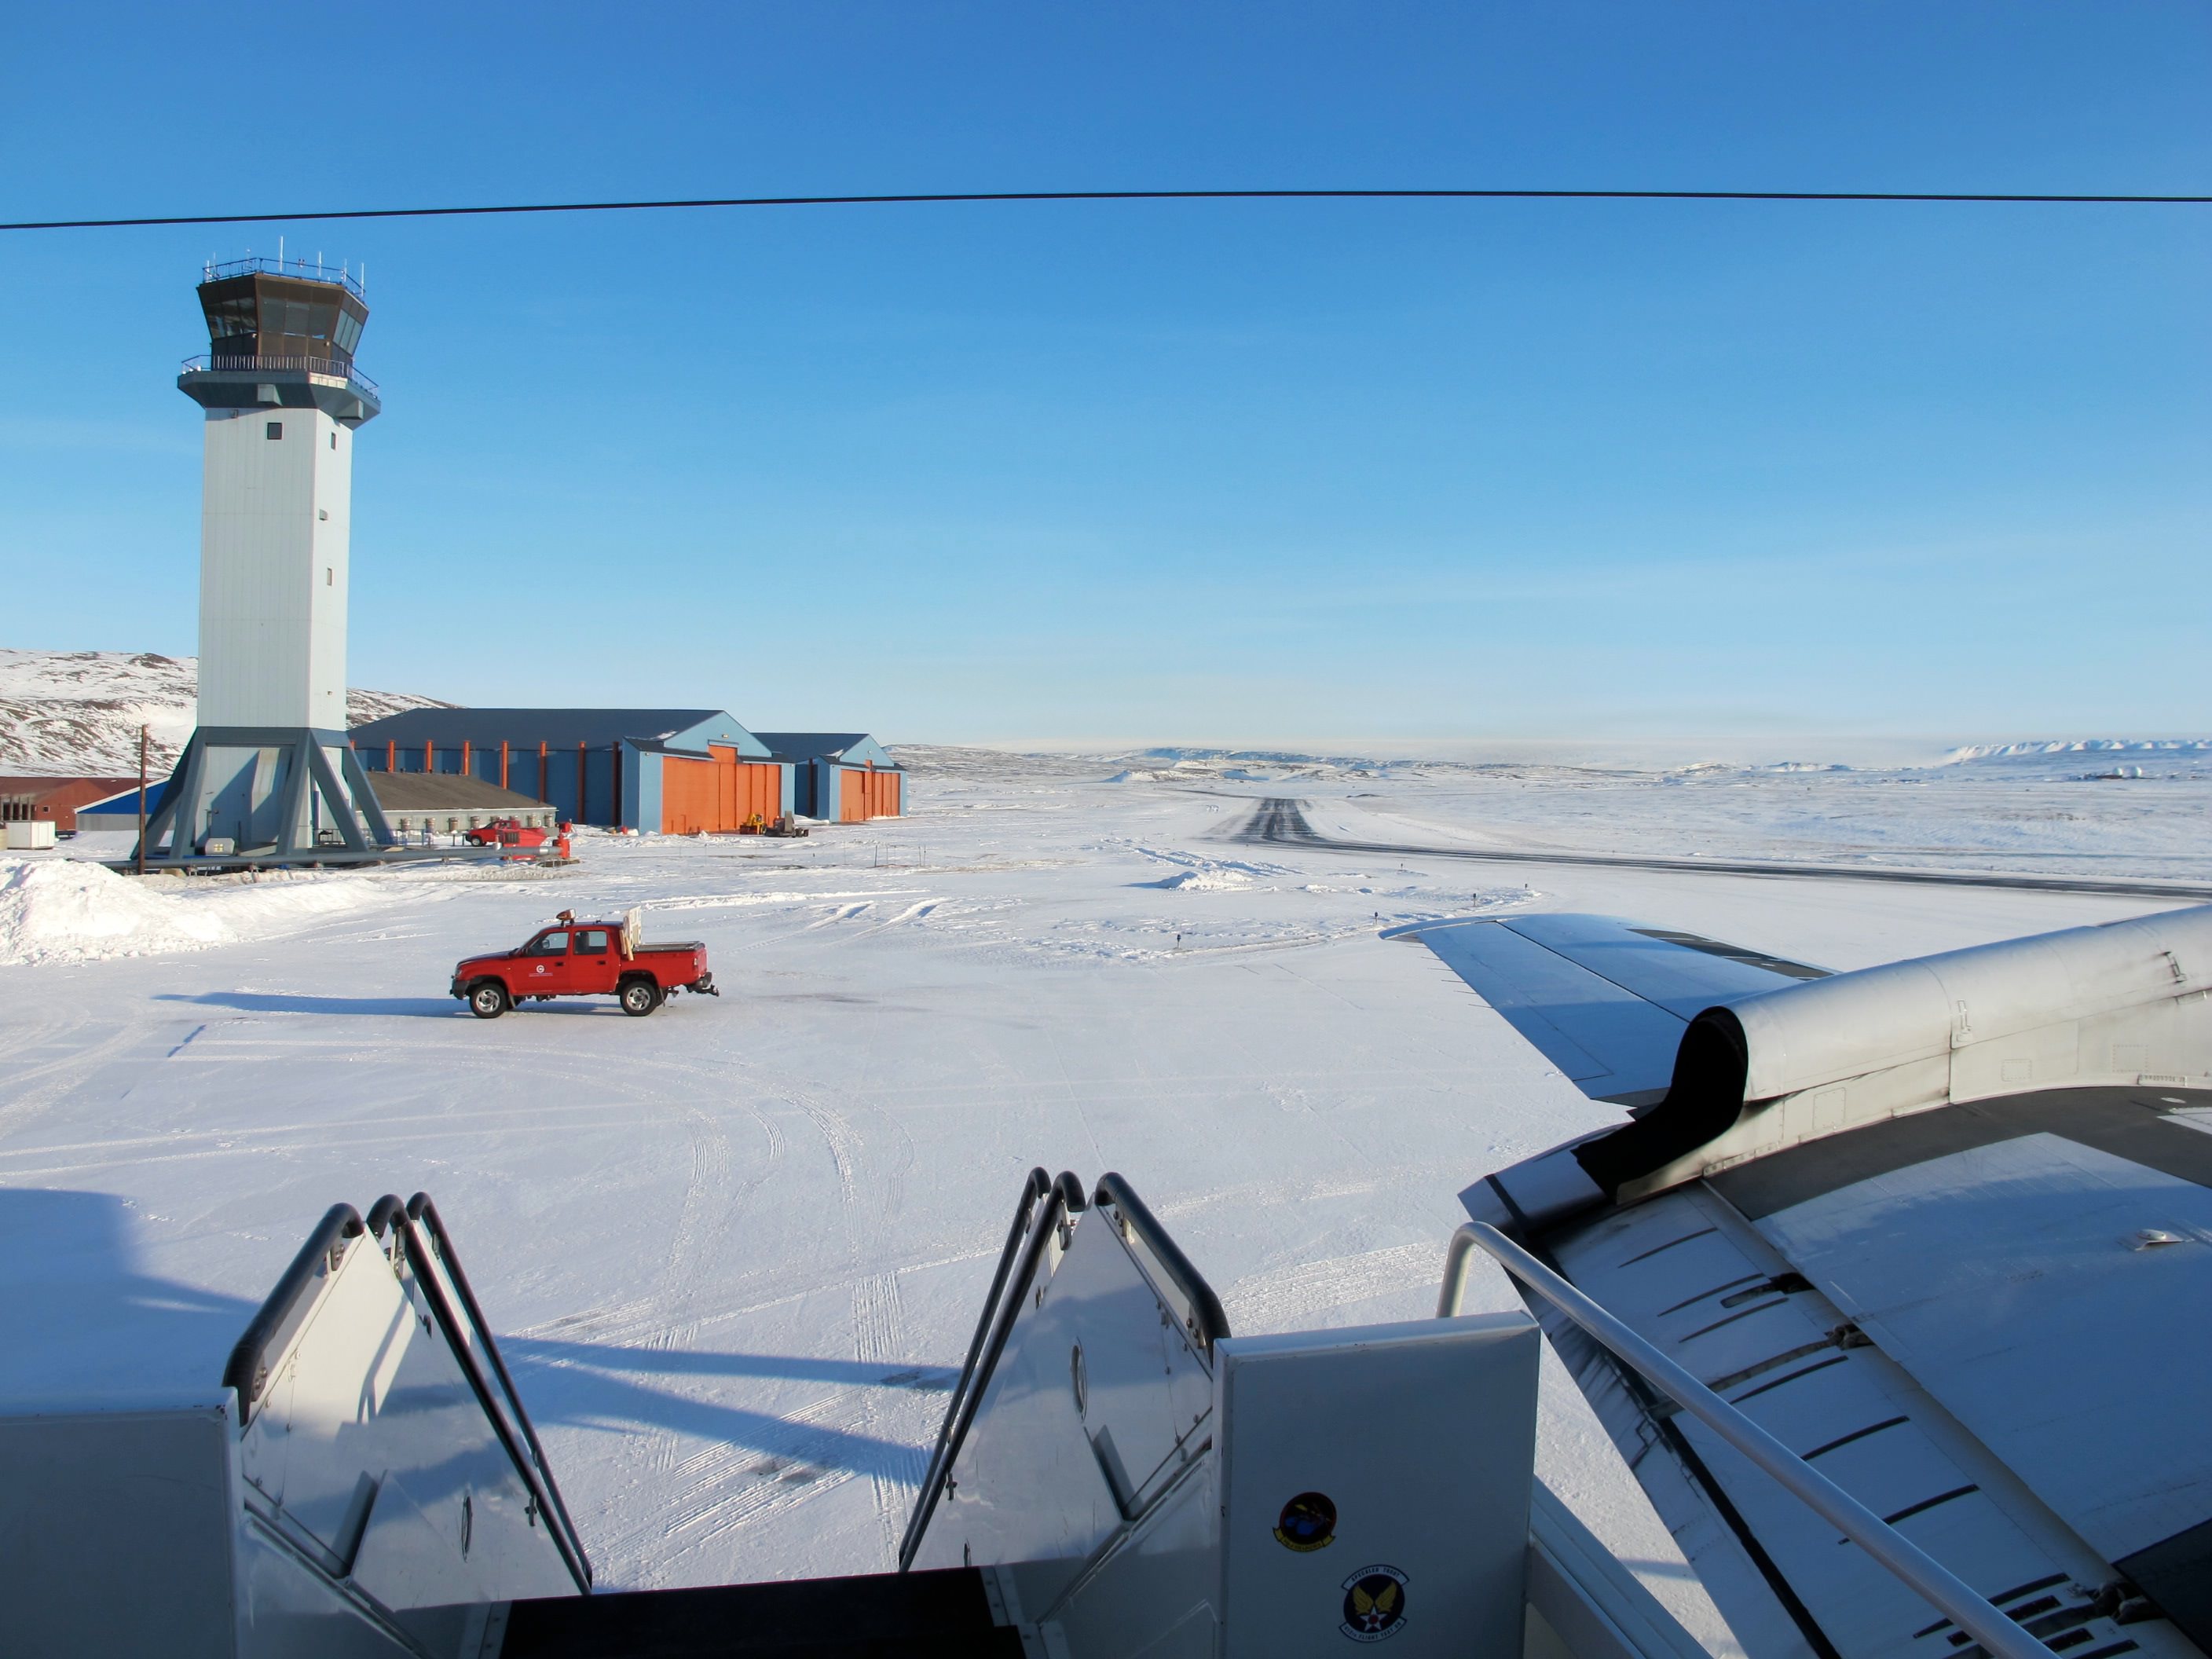
A sunny view of the ramp at Thule Air Base, Greenland, shortly after the NASA P-3B research aircraft arrived on Mar. 18, 2013. Credit: NASA / Jim Yungel
The measurements collected by IceBridge instruments will characterize the annual changes in thickness of sea ice, glaciers, and ice sheets. The data are used to help predict how climate change affects Earth’s polar ice and the resulting rise in sea-levels.
Researchers with the U.S. Army Corps of Engineers are collaborating with the IceBridge project to collect snow depth measurements near Barrow , Alaska. High school science teachers from the US, Denmark and Greenland will fly along on the P-3B survey flights to learn about polar science.
NASA Wallops has a wide ranging research and development mission and is home to the Virginia launch pad for the new Antares/Cygnus commercial ISS resupply rocket set for its maiden launch in mid April 2013; detailed in see my new story – here.
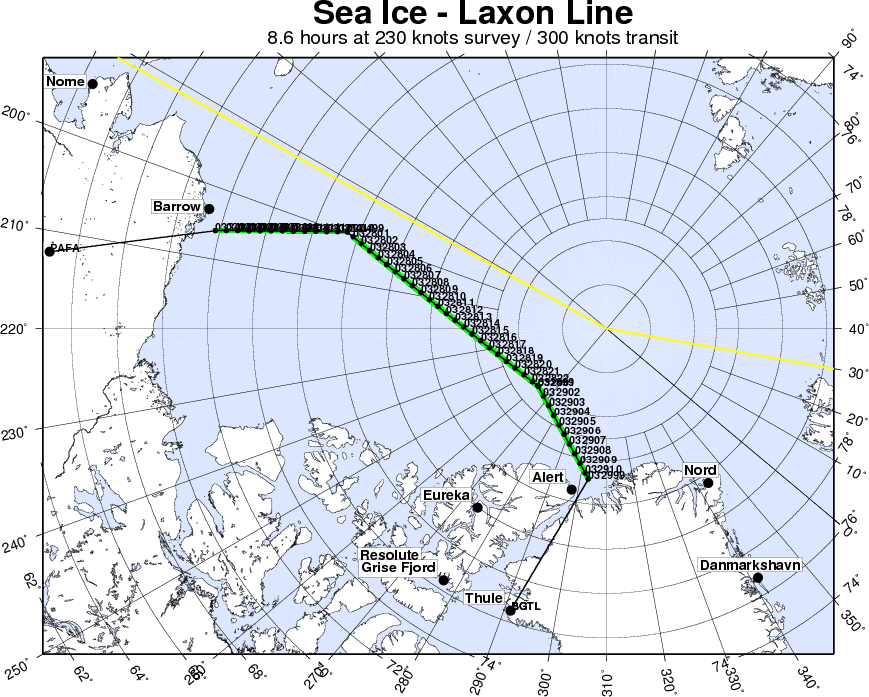
Sea ice in the southern Beaufort Sea. Credit: NASA
IceBridge departing to Fairbanks to start their sea ice flights that will cover the Beauford and Chukchi seas – via the Laxon sea ice route for the transit. Credit: NASA
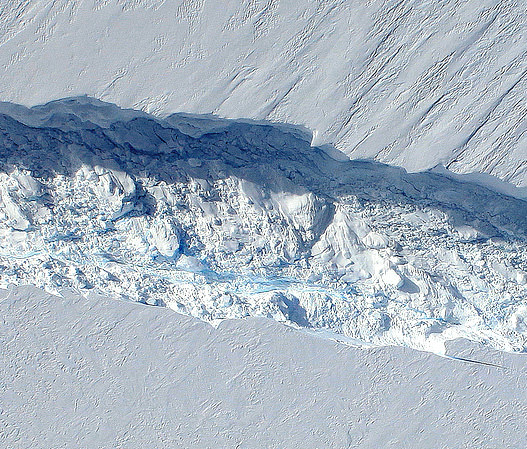
The 820-foot-wide crack in Antarctica's Pine Island Glacier, seen from DC-8 during Operation IceBridge (Credit: NASA/DMS)
Data collected from a NASA ice-watching satellite reveal that the vast ice shelves extending from the shores of western Antarctica are being eaten away from underneath by ocean currents, which have been growing warmer even faster than the air above.
The animation above shows the circulation of ocean currents around the western Antarctic ice shelves. The shelf thickness is indicated by the color; red is thicker (greater than 550 meters), while blue is thinner (less than 200 meters).
Launched in January 2003, NASA’s ICESat (Ice, Cloud and land Elevation Satellite) studied the changing mass and thickness of Antarctica’s ice from its location in polar orbit. An international research team used over 4.5 million surface height measurements collected by ICESat’s GLAS (Geoscience Laser Altimeter System) instrument from Oct. 2005 to 2008. They concluded that 20 of the 54 shelves studied — nearly half — were losing thickness from underneath.
[/caption]
Most of the melting ice shelves are located in west Antarctica, where the flow of inland glaciers to the sea has also been accelerating — an effect that can be compounded by thinning ice shelves which, when grounded to the offshore seabed, serve as dams to hold glaciers back.
Melting of ice by ocean currents can occur even when air temperature remains cold, maintaining a steady process of ice loss — and eventually increased sea level rise.
“We can lose an awful lot of ice to the sea without ever having summers warm enough to make the snow on top of the glaciers melt,” said Hamish Pritchard of the British Antarctic Survey in Cambridge and the study’s lead author . “The oceans can do all the work from below.”
The study also found that Antarctica’s winds are shifting in response to climate change.
“This has affected the strength and direction of ocean currents,” Pritchard said. “As a result warm water is funnelled beneath the floating ice. These studies and our new results suggest Antarctica’s glaciers are responding rapidly to a changing climate.”
ICESat completed operations in 2010 and was decommissioned in August of that year. Its successor ICESat-2 is anticipated to launch in 2016.
NASA’s Ice, Cloud, and land Elevation (ICESat) mission is now on ice, so to speak, or perhaps we should say, it ultimately became an inferno. The satellite was intentionally deorbited and burned up in the atmosphere on August 30, after completing a very productive seven-year scientific stint in orbit. And talk about the ultimate high-stakes, high-adventure, hands-on student project: students at the University of Colorado Boulder conducted the final maneuvers to send the spacecraft to its fiery death.
ICESat’s science mission ended in February 2010 when its primary instrument failed. NASA lowered the satellite’s orbit this summer and then decommissioned the spacecraft in preparation for re-entry. The satellite largely burned up, (NASA calculated that no more than 90 kg (200 pounds) of the ICESat’s original 900 kg (2,000 pounds) would survive re-entry) with pieces of debris falling into the Barents Sea, part of the Arctic Ocean north of Norway and Russia.
Originally a slated for 3 year mission, it continued for seven years and 15 laser-operations campaigns. While the GLAS instrument failed, the spacecraft itself remained in operating condition, so NASA could fire its thrusters to lower its orbit. This began in June, and reduced the lowest point of the spacecraft’s orbit to 125 miles (200 km) above Earth’s surface. The orbit then naturally decayed, but the final maneuvering was controlled by a group of students from the University of Colorado, working at the school’s Laboratory for Atmospheric and Space Physics (LASP). They sent it successfully plummeting through Earth’s atmosphere at just the right moment so that the satellite’s remains would land in the chilly – and uninhabited — seas north of Norway and Russia.
“They ran calculations to determine where the spacecraft was located,” said Darrin Osborne, flight director for ICESat.
The student operators provide a lower cost to NASA, and CU students at LASP receive hands-on training and experience that helps position them for a future in space-related careers.
“It’s amazing for an undergraduate like me to get hands-on experience controlling multimillion-dollar NASA satellites,” said third-year aerospace engineering sciences student Katelynn Finn, quoted in an article in The Register. ICESat orbital image. Credit: NASA
ICESat was launched in January, 2003, and was the first mission of its kind, designed to study Earth’s polar regions with a space-based laser altimeter called the Geoscience Laser Altimeter System, or GLAS. ICESat has helped in our understanding of ice sheet and sea ice dynamic, leading to scientific advances in measuring changes in the mass of the Greenland and Antarctic ice sheets, polar sea ice thickness, vegetation-canopy heights, and the heights of clouds and aerosols. Using ICESat data, scientists identified a network of lakes beneath the Antarctic ice sheet. ICESat introduced new capabilities, technology and methods such as the measurement of sea ice freeboard – or the amount of ice and snow that protrudes above the ocean surface – for estimating sea ice thickness.
A final eulogy for the satellite was offered by NASA’s Earth Science Mission Operations office: “The ICESat mission operations team is commended for its exceptional performance, working tirelessly for the past eleven years (four years of preparation and seven years of operations), overcoming several obstacles in the early years of the mission, and closing out the mission with a flawless series of orbital maneuvers before final decommissioning. The positive control maintained over the mission right to the end shows the quality and effort that went into designing, building, qualifying, launching, and operating a tremendously successful mission such as ICESat.”