Jeff Kargel is a Senior Scientist at the Planetary Science Institute in Tucson, Arizona. He is a geologist, a glaciologist, and a planetary scientist. Climate change is a major thread, and that is what he is here today to talk about.
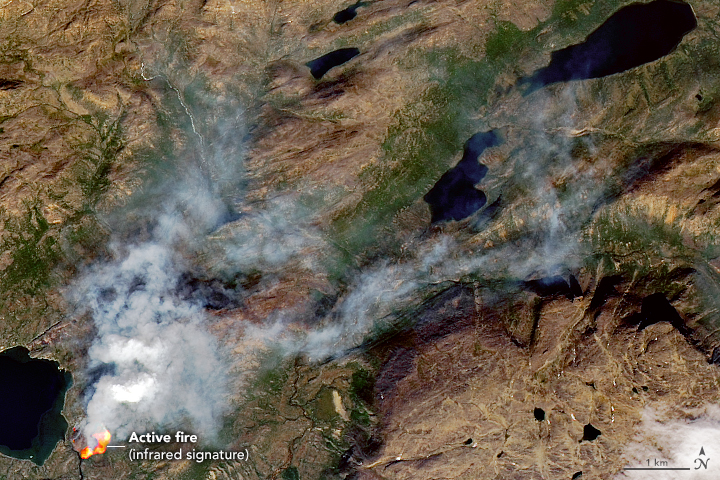
This fire in Greenland is near Sisimiut, in Western Greenland. It was likely caused by a hiker. Image Credit: NASA Earth Observatory
As global warming ramps up, expect to see Greenland in the news a lot. That’s because its ice sheet is under threat of melting. But that’s not the only reason. The other reason is fire.
A commercial airliner produces a condensation trail in the skies over California. Credit: Mick West
To the scientifically uninitiated, it might seem like a frivolous idea: That those slight, wispy clouds that trail behind jet aircraft at such high altitudes could contribute to climate change. But they do.
Scientists love to measure things, and when they measured these contrails, which is short for condensation trails, they found bad news. Though they look kind of beautiful and ephemeral on a summer day, they pack an oversize punch when it comes to their warming effect.
This illustration shows the percentage of marine animals that went extinct during Earth's worst extinction at the end of the Permian era by latitude, from the model (black line) and from the fossil record (blue dots).A greater percentage of marine animals survived in the tropics than at the poles. The color of the water shows the temperature change, with red being most severe warming and yellow less warming. At the top is the supercontinent Pangaea, with massive volcanic eruptions emitting carbon dioxide. The images below the line represent some of the 96 percent of marine species that died during the event. [Includes fossil drawings by Ernst Haeckel/Wikimedia; Blue crab photo by Wendy Kaveney/Flickr; Atlantic cod photo by Hans-Petter Fjeld/Wikimedia; Chambered nautilus photo by John White/CalPhotos.]Justin Penn and Curtis Deutsch/University of Washington
Everyone knows about the extinction of the dinosaurs. A cataclysmic asteroid strike about 66 million years ago (mya) caused the Death of the Dinosaurs. But there’ve been several mass extinctions in the Earth’s history, and they didn’t involve killer asteroids. The worst extinction was caused by a rapid rise in temperature.
Earth’s most severe extinction occurred long before the killer asteroid impact that wiped out the dinosaurs. It happened some 252 mya, and it marked the end of what’s called the Permian Period. The extinction is known as the Permian-Triassic Extinction Event, the End-Permian Extinction, or more simply, “The Great Dying.” Up to 70% of terrestrial vertebrates and up to 96% of all marine species were extinguished during The Great Dying.
A case study of the inhabitants of Easter Island served in part as the basis for a mathematical model showing the ways a technologically advanced population and its planet might develop or collapse together. Credit: University of Rochester illustration / Michael Osadciw
In the 1950s, famed physicist Enrico Fermi posed the question that encapsulated one of the toughest questions in the Search for Extra-Terrestrial Intelligence (SETI): “Where the heck is everybody?” What he meant was, given the age of the Universe (13.8 billion years), the sheer number of galaxies (between 1 and 2 trillion), and the overall number of planets, why has humanity still not found evidence of extra-terrestrial intelligence?
This question, which has come to be known as the “Fermi Paradox”, is something scientists continue to ponder. In a new study, a team from the University of Rochester considered that perhaps Climate Change is the reason. Using a mathematical model based on the Anthropocene, they considered how civilizations and planet systems co-evolve and whether or not intelligent species are capable of living sustainability with their environment.
Today, Climate Change is one of the most pressing issues facing humanity. Thanks to changes that have taken place in the past few centuries – i.e. the industrial revolution, population growth, the growth of urban centers and reliance on fossil fuels – humans have had a significant impact on the planet. In fact, many geologists refer to the current era as the “Anthropocene” because humanity has become the single greatest factor affecting planetary evolution.
In the future, populations are expected to grow even further, reaching about 10 billion by mid-century and over 11 billion by 2100. In that time, the number of people who live within urban centers will also increase dramatically, increasing from 54% to 66% by mid-century. As such, the quesiton of how billions of people can live sustainably has become an increasingly important one.
Prof. Frank, who is also the author of the new book Light of the Stars: Alien Worlds and the Fate of the Earth (which draws on this study), conducted this study with his colleagues in order to address the issue Climate Change in an astrobiological context. As he explained in a University of Rochester press release:
“Astrobiology is the study of life and its possibilities in a planetary context. That includes ‘exo-civilizations’ or what we usually call aliens. If we’re not the universe’s first civilization, that means there are likely to be rules for how the fate of a young civilization like our own progresses.”
Using the Anthropocene as an example, one can see how civilization-planet systems co-evolve, and how a civilization can endanger itself through growth and expansion – in what is known as a “progress trap“. Basically, as civilizations grow, they consume more of the planet’s resources, which causes changes in the planet’s conditions. In this sense, the fate of a civilization comes down to how they use their planet’s resources.
In order to illustrate this process Frank and his collaborators developed a mathematical model that considers civilizations and planets as a whole. As Prof. Frank explained:
“The point is to recognize that driving climate change may be something generic. The laws of physics demand that any young population, building an energy-intensive civilization like ours, is going to have feedback on its planet. Seeing climate change in this cosmic context may give us better insight into what’s happening to us now and how to deal with it.”
The model was also based on case studies of extinct civilizations, which included the famous example of what became of the inhabitants of Rapa Nui (aka. Easter Island). According to archaeological studies, the people of the South Pacific began colonizing this island between 400 and 700 CE and its population peaked at 10,000 sometime between 1200 and 1500 CE.
Professor Adam Frank, who led the study in how civilization-planet systems evolve. Credit: University of Rochester photo / J. Adam Fenster
By the 18th century, however, the inhabitants had depleted their resources and the population declined to just 2000. This example raises the important concept known as “carrying capacity”, which is the maximum number of species an environment can support. As Frank explained, Climate Change is essentially how the Earth responds to the expansion of our civilization:
“If you go through really strong climate change, then your carrying capacity may drop, because, for example, large-scale agriculture might be strongly disrupted. Imagine if climate change caused rain to stop falling in the Midwest. We wouldn’t be able to grow food, and our population would diminish.”
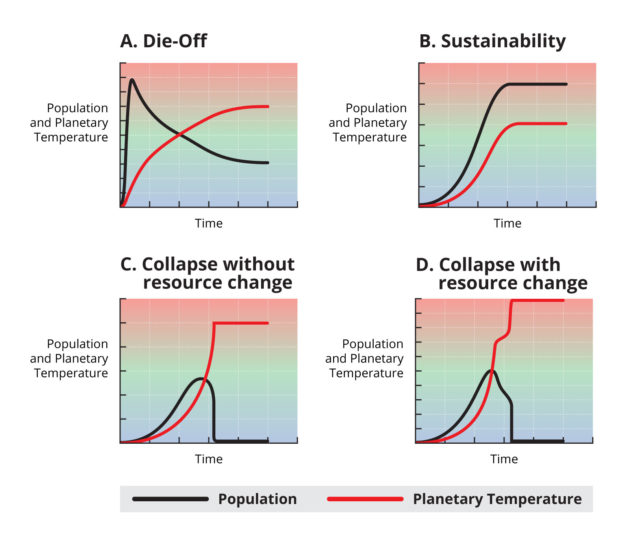
Using their mathematical model, the team identified four potential scenarios that might occur on a planet. These include the Die-Off scenario, the Sustainability scenario, the Collapse Without Resource Change scenario, and the Collapse With Resource Change scenario. In the Die-Off scenario, the population and the planet’s state (for example, average temperatures) rise very quickly.
This would eventually lead to a population peak and then a rapid decline as changing planetary conditions make it harder for the majority of the population to survive. Eventually, a steady population level would be achieved, but it would only be a fraction of what the peak population was. This scenario occurs when civilizations are unwilling or unable to change from high-impact resources (i.e. oil, coal, clear-cutting) to sustainable ones (renewable energy).
Four scenarios for the fate of civilizations and their planets, based on mathematical models developed by Adam Frank and his collaborators. Credit: University of Rochester illustration / Michael Osadciw
In the Sustainability scenario, the population and planetary conditions both rise, but eventually come to together with steady values, thus avoiding any catastrophic effects. This scenario occurs when civilizations recognize that environmental changes threaten their existence and successfully make the transition from high-impact resources to sustainable ones.
The final two scenarios – Collapse Without Resource Change and Collapse With Resource Change – differ in one key respect. In the former, the population and temperature both rise rapidly until the population reaches a peak and begins to drop rapidly – though it is not clear if the species itself survives. In the latter, the population and temperature rise rapidly, but the populations recognizes the danger and makes the transition. Unfortunately, the change comes too late and the population collapses anyway.
At present, scientists cannot say with any confidence which of these fates will be the one humanity faces. Perhaps we will make the transition before it is too late, perhaps not. But in the meantime, Frank and his colleagues hope to use more detailed models to predict how planets will respond to civilizations and the different ways they consume energy and resources in order to grow.
From this, scientists may be able to refine their predictions of what awaits us in this century and the next. It is during this time that crucial changes will be taking place, which include the aforementioned population growth, and the steady rise in temperatures. For instance, based on two scenarios that measured CO2 increases by the year 2100, NASA indicated that global temperatures could rise by either 2.5 °C (4.5 °F) or 4.4 °C (8 °F).
In the former scenario, where CO2 levels reached 550 ppm by 2100, the changes would be sustainable. But in the latter scenario, where CO2 levels reached 800 ppm, the changes would cause widespread disruption to systems that billions of humans depends upon for their livelihood and survival. Worse than that, life would become untenable in certain areas of the world, leading to massive displacement and humanitarian crises.
In addition to offering a possible resolution for the Fermi Paradox, this study offers some helpful advice for human beings. By thinking of civilizations and planets as a whole – be they Earth or exoplanets – researchers will be able to better predict what changes will be necessary for human civilization to survive. As Frank warned, it is absolutely essential that humanity mobilize now to ensure that the worst-case scenario does not occur here on Earth:
“If you change the earth’s climate enough, you might not be able to change it back. Even if you backed off and started to use solar or other less impactful resources, it could be too late, because the planet has already been changing. These models show we can’t just think about a population evolving on its own. We have to think about our planets and civilizations co-evolving.”
And be sure to enjoy this video that addresses Prof. Frank and his team’s research, courtesy of the University of Rochester:
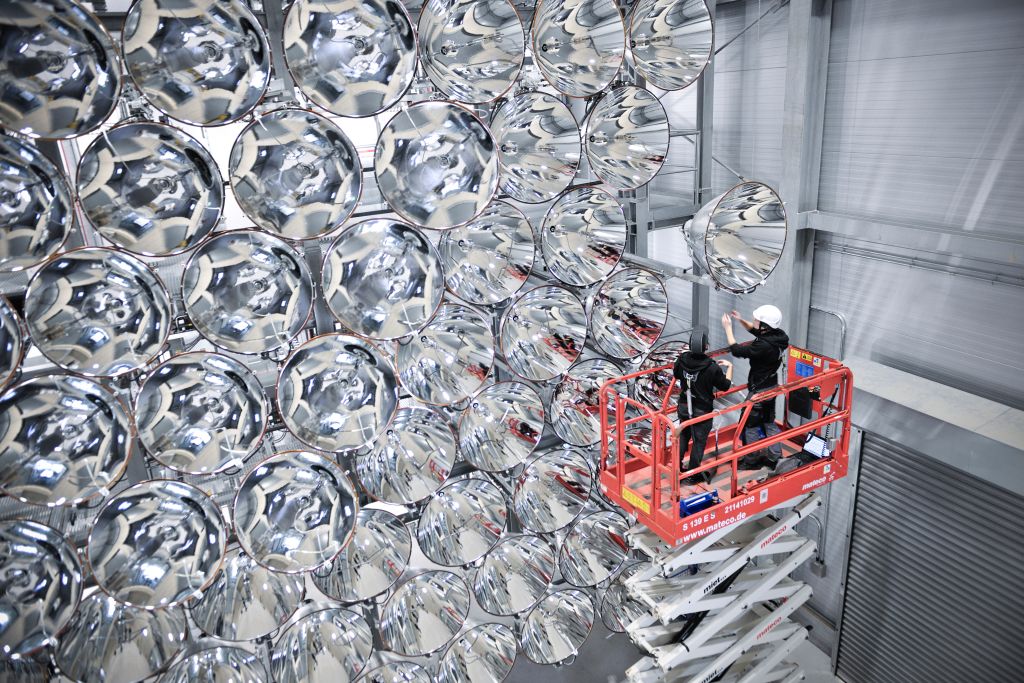
Technicians at the DLR's Institute for Solar Research inspecting lamps in the Synlight. Image: DLR/Markus Hauschild.
Hydrogen is the most abundant element in the Universe. But here on Earth, it’s rather rare. That’s unfortunate, because in our warming world, its status as an emissions-free fuel makes it a coveted chemical. If German researchers are successful, their Synlight project will help make renewable hydrogen fuel a reality.
Dubbed the “artificial Sun”, the Synlight uses concentrated light to power Thermochemical Water Splitting (TWS.) Every school child knows you can produce hydrogen by electrolysis—running an electric current through water. But that takes an enormous amount of electricity. TWS might be a better way of getting hydrogen out of water, but it takes an enormous amount of energy too, and that’s what the German research is about.
When combusted with pure oxygen—inside a fuel cell for example—hydrogen’s only waste product is water. No greenhouse gases or particulates are produced. But if we want to use it to power our cars, buses, trucks, and even airplanes, we need enormous amounts of it. And we need to produce it cost-effectively.
“Renewable energies will be the mainstay of global power supply in the future.” – Karsten Lemmer DLR Executive Board Member
The idea is to use the heat generated by Concentrated Solar Power (CSP) to extract hydrogen from water, thereby eliminating the need for electricity. CSP systems use mirrors or lenses to concentrate a large area of sunlight into a small area. The heat from that action can be used to power TWS. The Synlight project in Germany is demonstrating the viability of TWS by mimicking the effect of concentrated sunlight. In doing so, researchers there are building what’s being called the world’s largest artificial Sun.
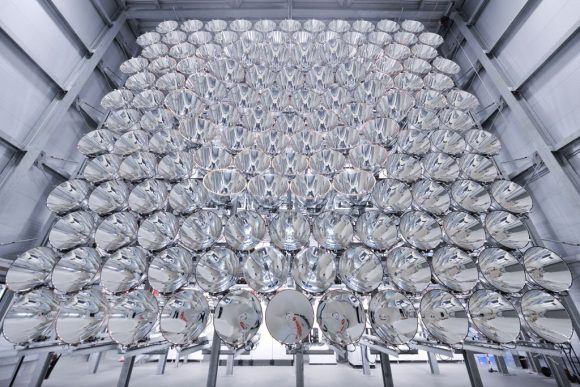
Each of Synlight’s 149 zenon short-arc lamps can be controlled individually. Image: DLR/Synlight/Markus Hauschild
German researchers at the German Aerospace Center (DLR) at Julich near Cologne built the Synlight, a system of 149, high power lamps of the type used in film projections. When all these lamps are turned on, Synlight produces light that is about 10,000 times more intense than natural sunlight on Earth. When all the lamps are aimed at a single spot, Synlight generates temperatures up to 3000 Celsius. The challenge now is to develop materials and processes that can operate in such an extreme temperature.
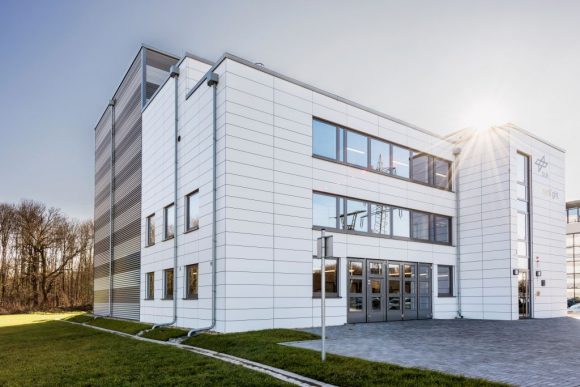
The 15m tall Synlight experiment is housed in this building in Julich. The building contains 3 separate radiation chambers for different experiments. Image: DLR CC By 3.0
The Synlight system itself uses an enormous amount of electrical power to operate. But that’s often the case with experimental facilities. The Synlight project will mimic the effect of intense, continuous solar energy, something that is not readily available in Germany. By building a test facility powered by electricity, researchers will be able to reliably perform experiments without being delayed or affected by cloudy weather.
“Fuels, propellants and combustibles acquired using solar power offer immense potential for long-term storage and the production of chemical raw materials, and the reduction of carbon dioxide emissions. Synlight will enhance our research in this field.” – Karsten Lemmer, DLR Executive Board Member
As Johannes Remmel, the North Rhine-Westphalia Minister for Climate Protection, said, “”We need to expand existing technology in practical ways in order to achieve renewable energy targets, but the energy transition will falter without investments in innovative research, in state-of-the-art technologies and in global lighthouse projects like Synlight.”
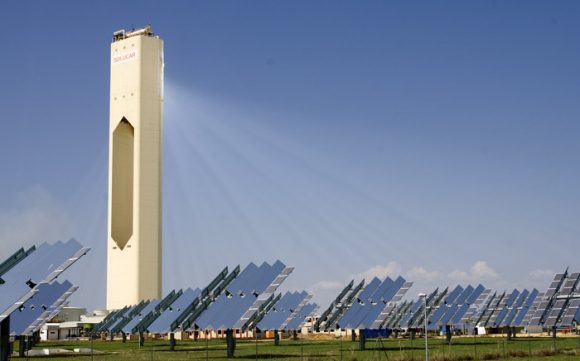
The DLR is involved in the PS10 solar power tower in Spain. The PS10 is the world’s fist commercial concentrating solar power tower. Image: By afloresm – SOLUCAR PS10, CC BY 2.0, https://commons.wikimedia.org/w/index.php?curid=2821733
This is not the German Aerospace Center’s first foray in concentrated solar power. They’re involved in a number of projects to advance concentrated solar power and thermal water splitting. The DLR is a partner in the Hydrosol II pilot in Spain. It’s a reactor for solar thermochemical hydrogen production that has been in operation since 2008. They’re also involved in the first commercially operated solar tower plant, an 11 megawatt system in Spain called the PS10 solar power tower.
One of the most worrisome aspects of Climate Change is the role played by positive feedback mechanisms. In addition to global temperatures rising because of increased carbon dioxide and greenhouse gas emissions, there is the added push created by deforestation, ocean acidification, and (most notably) the disappearance of the Arctic Polar Ice Cap.
However, according to a new study by a team of researchers from the School of Earth and Space Exploration at Arizona State University, it might be possible to refreeze parts of the Arctic ice sheet. Through a geoengineering technique that would rely on wind-powered pumps, they believe one of the largest positive feedback mechanisms on the planet can be neutralized.
Their study, titled “Arctic Ice Management“, appeared recently in Earth’s Future, an online journal published by the American Geophysical Union. As they indicate, the current rate at which Arctic ice is disappearing it quite disconcerting. Moreover, humanity is not likely to be able to combat rising global temperatures in the coming decades without the presence of the polar ice cap.
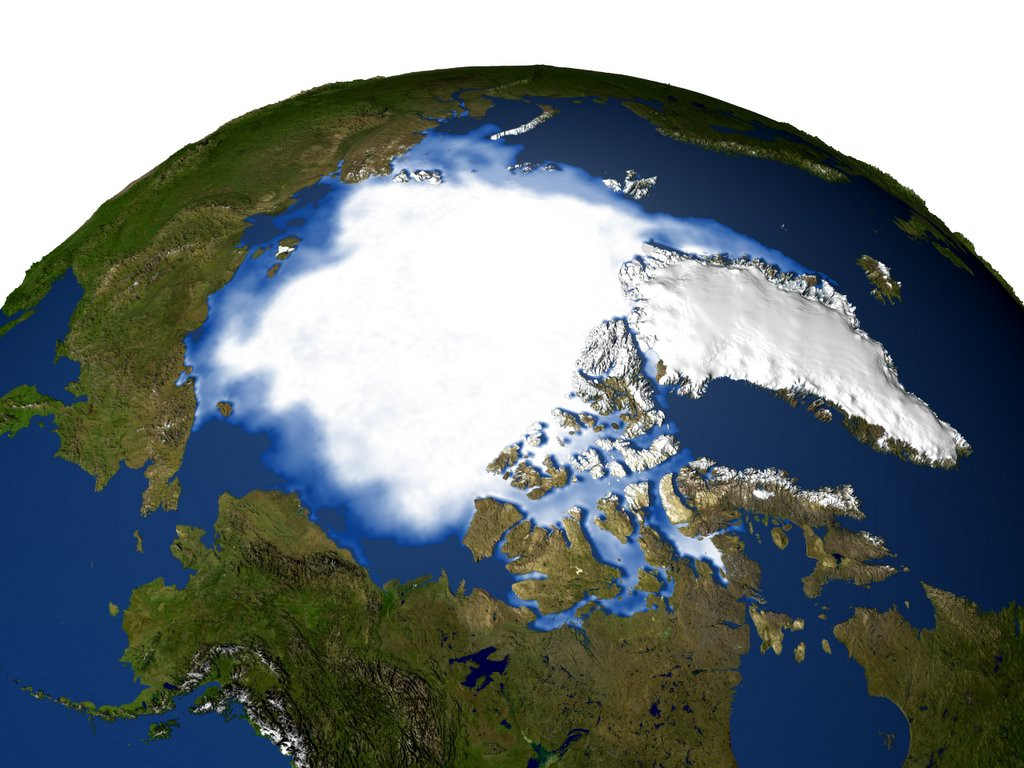
A drastic decrease in arctic sea ice since satellite imaging of the polar ice cap began. Credit: NASA
Of particular concern is the rate at which polar ice has been disappearing, which has been quite pronounced in recent decades. The rate of loss has been estimated at being between 3.5% and 4.1% per decade, with in an overall decrease of at least 15% since 1979 (when satellite measurements began). To make things worse, the rate at which ice is being lost is accelerating.
From a baseline of about 3% per decade between 1978-1999, the rate of loss since the 2000s has climbed considerably – to the point that the extent of sea-ice in 2016 was the second lowest ever recorded. As they state in their Introduction (and with the support of numerous sources), the problem is only likely to get worse between now and the mid-21st century:
“Global average temperatures have been observed to rise linearly with cumulative CO2 emissions and are predicted to continue to do so, resulting in temperature increases of perhaps 3°C or more by the end of the century. The Arctic region will continue to warm more rapidly than the global mean. Year-round reductions in Arctic sea ice are projected in virtually all scenarios, and a nearly ice-free (<106 km2 sea-ice extent for five consecutive years) Arctic Ocean is considered “likely” by 2050 in a business-as-usual scenario.”
One of the reasons the Arctic is warming faster than the rest of the planet has to do with strong ice-albedo feedback. Basically, fresh snow ice reflects up to 90% of sunlight while sea ice reflects sunlight with albedo up to 0.7, whereas open water (which has an albedo of close to 0.06) absorbs most sunlight. Ergo, as more ice melts, the more sunlight is absorbed, driving temperatures in the Arctic up further.
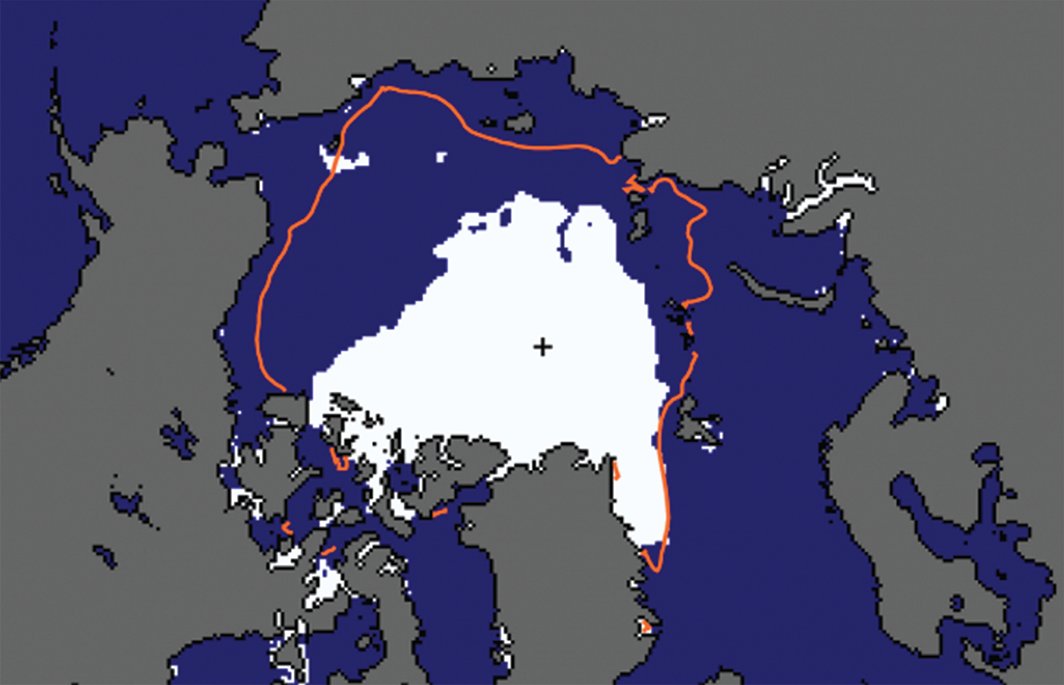
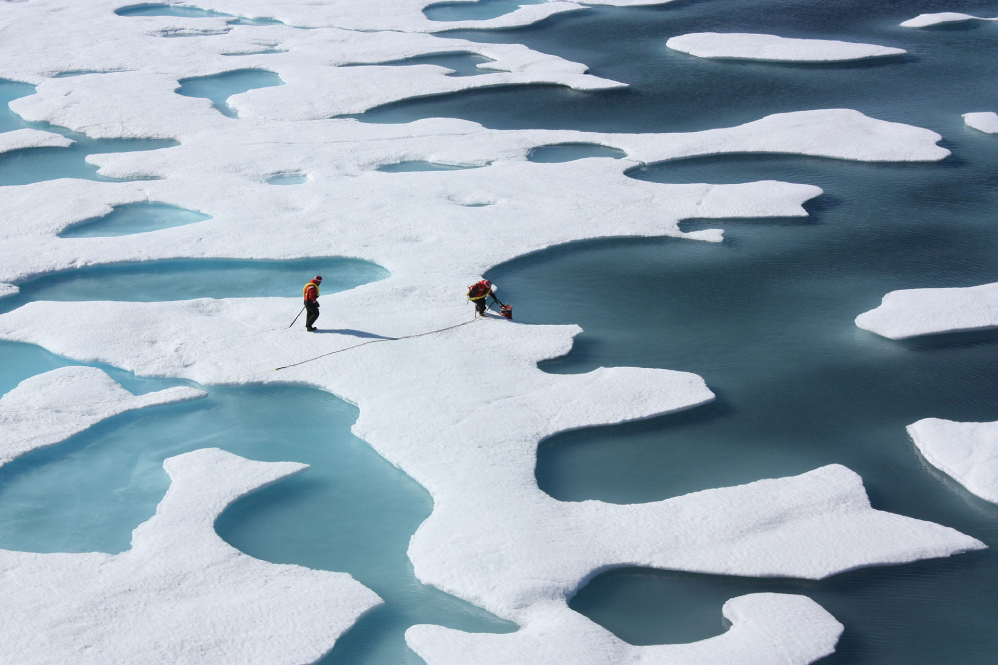
Arctic sea-ice extent (area covered at least 15% by sea ice) in September 2007 (white area). The red curve denotes the 1981–2010 average. Credit: National Snow and Ice Data CenterTo address this concern, the research team – led by Steven J. Desch, a professor from the School of Earth and Space Exploration – considered how the melting is connected to seasonal fluctuations. Essentially, the Arctic sea ice is getting thinner over time because new ice (aka. “first-year ice”), which is created with every passing winter, is typically just 1 meter (3.28 ft) thick.
Ice that survives the summer in the Arctic is capable of growing and becoming “multiyear ice”, with a typical thickness of 2 to 4 meters (6.56 to 13.12 ft). But thanks to the current trend, where summers are getting progressively warmer, “first-year ice” has been succumbing to summer melts and fracturing before it can grow. Whereas multiyear ice comprised 50 to 60% of all ice in the Arctic Ocean in the 1980s, by 2010, it made up just 15%.
With this in mind, Desch and his colleagues considered a possible solution that would ensure that “first-year ice” would have a better chance of surviving the summer. By placing machines that would use wind power to generate pumps, they estimate that water could be brought to the surface over the course of an Arctic winter, when it would have the best chance of freezing.
Based on calculations of wind speed in the Arctic, they calculate that a wind turbine with 6-meter diameter blades would generate sufficient electricity so that a single pump could raise water to a height of 7 meters, and at a rate of 27 metric tons (29.76 US tons) per hour. The net effect of this would be thicker sheets of ice in the entire affected area, which would have a better chance of surviving the summer.
Melt pools on melting sea-ice. Every summer, newly-formed ice is threatened because of rising global temperatures. Credit NASA
Over time, the negative feedback created by more ice would cause less sunlight to be absorbed by the Arctic ocean, thus leading to more cooling and more ice accumulation. This, they claim, could be done on a relatively modest budget of $500 billion per year for the entire Arctic, or $50 billion per year for 10% of the Arctic.
While this may sounds like a huge figure, they are quick to point out that the cast covering the entire Arctic with ice-creating pumps – which could save trillions in GDP and countless lives- is equivalent to just 0.64% of current world gross domestic product (GDP) of $78 trillion. For a country like the United States, it represents just 13% of the current federal budget ($3.8 trillion).
And while there are several aspects of this proposal that still need to be worked out (which Desch and his team fully acknowledge), the concept does appear to be theoretically sound. Not only does it take into account the way seasonal change and Climate Change are linked in the Arctic, it acknowledges how humanity is not likely to be be able to address Climate Change without resorting to geoengineering techniques.
And since Arctic ice is one of the most important things when it comes to regulating global temperatures, it makes perfect sense to start here.
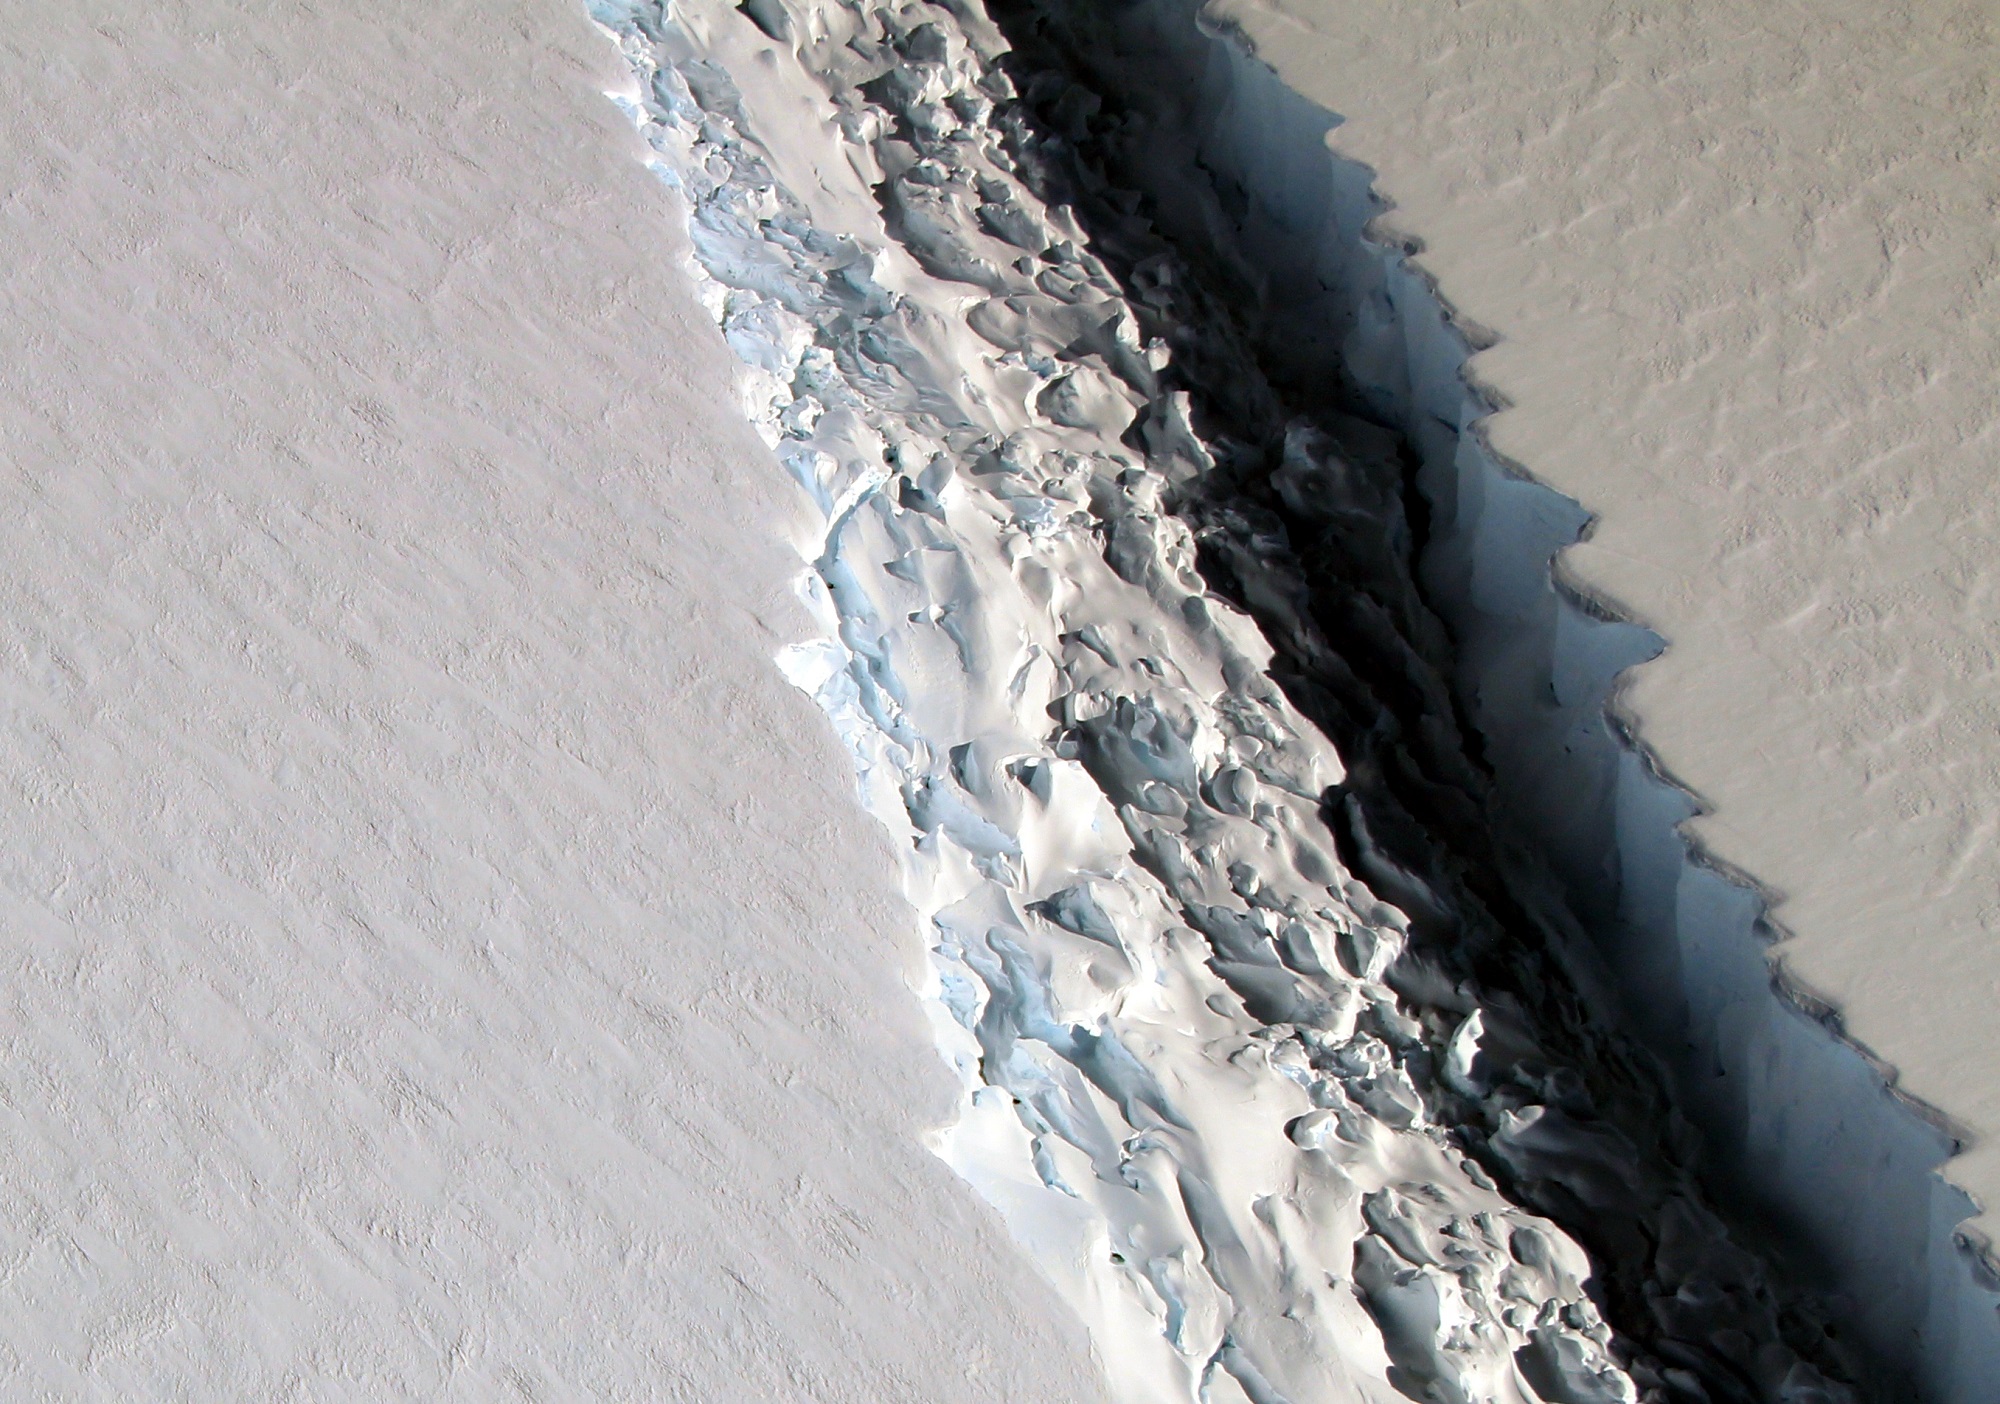
The rift in the Larsen C Ice Shelf. Credit: NASA/John Sonntag
Located along the east coast of the Antarctic Peninsula is the Larsen Ice Shelf. Named after the Norwegian Captain who explored the ice front back in 1893, this ice shelf has been monitored for decades due to its close connection with rising global temperatures. Essentially, since the 1990s, the shelf has been breaking apart, causing collapses of considerable intensity.
According to the British Antarctic Survey (BAS), the section of the ice sheet known as the Larsen C Ice Shelf could be experiencing a collapse of its own soon enough. Based on video footage and satellite evidence of the sizeable rift (which is 457 m or 15oo ft across) in the shelf, it is believed that an ice berg that is roughly 5,000 km² (1930.5 mi²) in size could be breaking off and calving into the ocean in the near future.
An ice shelf is essentially a floating extension of a land-based glacier. In this case, the Larsen Ice Shelf is seaborne section of the larger Larsen Glacier, which flows southeast past Mount Larsen and enters the Ross Sea just south of Victoria Land. These shelves often act as buttresses, holding back glaciers that flow down to the coast, thus preventing them from entering the ocean and contributing to rising sea levels.
In the past twenty-two years, the Larsen A and B ice shelves (which were situated further north along the Antarctic Peninsula) both collapsed into the sea. This resulted in the dramatic acceleration of glaciers behind them, as larger volumes of ice were able to flow down the coast and drop into the ocean. While Larsen C appeared to still be stable, in November of 2016, NASA noted the presence of a large crack in its surface.
This crack was about 110 kilometers (68 mi) long and was more than 91 m (299 ft) wide, reaching a depth of about 500 m (1,600 ft). By December, the rift had extended another 21 km (13 mi), which raised concerns about calving. In February of 2017, satellite observations of the shelf noted that the crack appeared to have grown further, which confirmed what researches from the MIDAS project had previously reported.
This UK-based Antarctic research project – which is based at Swansea University and Aberystwyth University in Wales and supported by the BAS and various international partners – is dedicated to monitoring the Larsen C ice shelf in Antarctica. Through a combination of field work, satellite observations, and computer simulations, they have catalogued how recent warming trends has caused seasonal melts of the ice shelf and affected its structure.
And in recent years, they have been monitoring the large crack, which has been fast-moving, and noted the appearance of several elongations. It was during the current Antarctic field season that members of the project filmed what the crack looked like from the air. In previous surveys, the glaciology research team has conducted research on the ice shelf using seismic techniques to survey the seafloor beneath it.
However, this past season, they did not set up on the ice shelf itself for fear of a calving event. Instead, they made a series of trips to and from the UK’s Rothera Research Station aboard twin otter aircraft. During an outing to retrieve some of their science equipment, the crew noted how the crack looked from above and started filming. As you can see from the footage, the rift is very wide and extremely long.
What’s more, the team estimates that if an iceberg from this shelf breaks off and falls into the ocean, it will likely be over three times the size of cities like London or New York City. And while this sort of thing is common with glaciers, the collapse of a large section of Larsen C could speed the flow of the Larsen Glacier towards the Antarctic Ocean.
As Dr Paul Holland, an ice and ocean modeller at the British Antarctic Survey, said in a recent press release:
“Iceberg calving is a normal part of the glacier life cycle, and there is every chance that Larsen C will remain stable and this ice will regrow. However, it is also possible that this iceberg calving will leave Larsen C in an unstable configuration. If that happens, further iceberg calving could cause a retreat of Larsen C. We won’t be able to tell whether Larsen C is unstable until the iceberg has calved and we are able to understand the behavior of the remaining ice. The stability of ice shelves is important because they resist the flow of the grounded ice inland. After the collapse of Larsen B, its tributary glaciers accelerated, contributing to sea-level rise.”
One of the greatest concerns about climate change is the feedback mechanisms it creates. In addition to increased warming trends caused by rising levels of CO² in the atmosphere, the melting of glaciers and the breakup of ice shelves can have a pronounced effect on sea levels. In the end, the depletion of glaciers in Antarctica could have dramatic consequences for the rest of the planet.
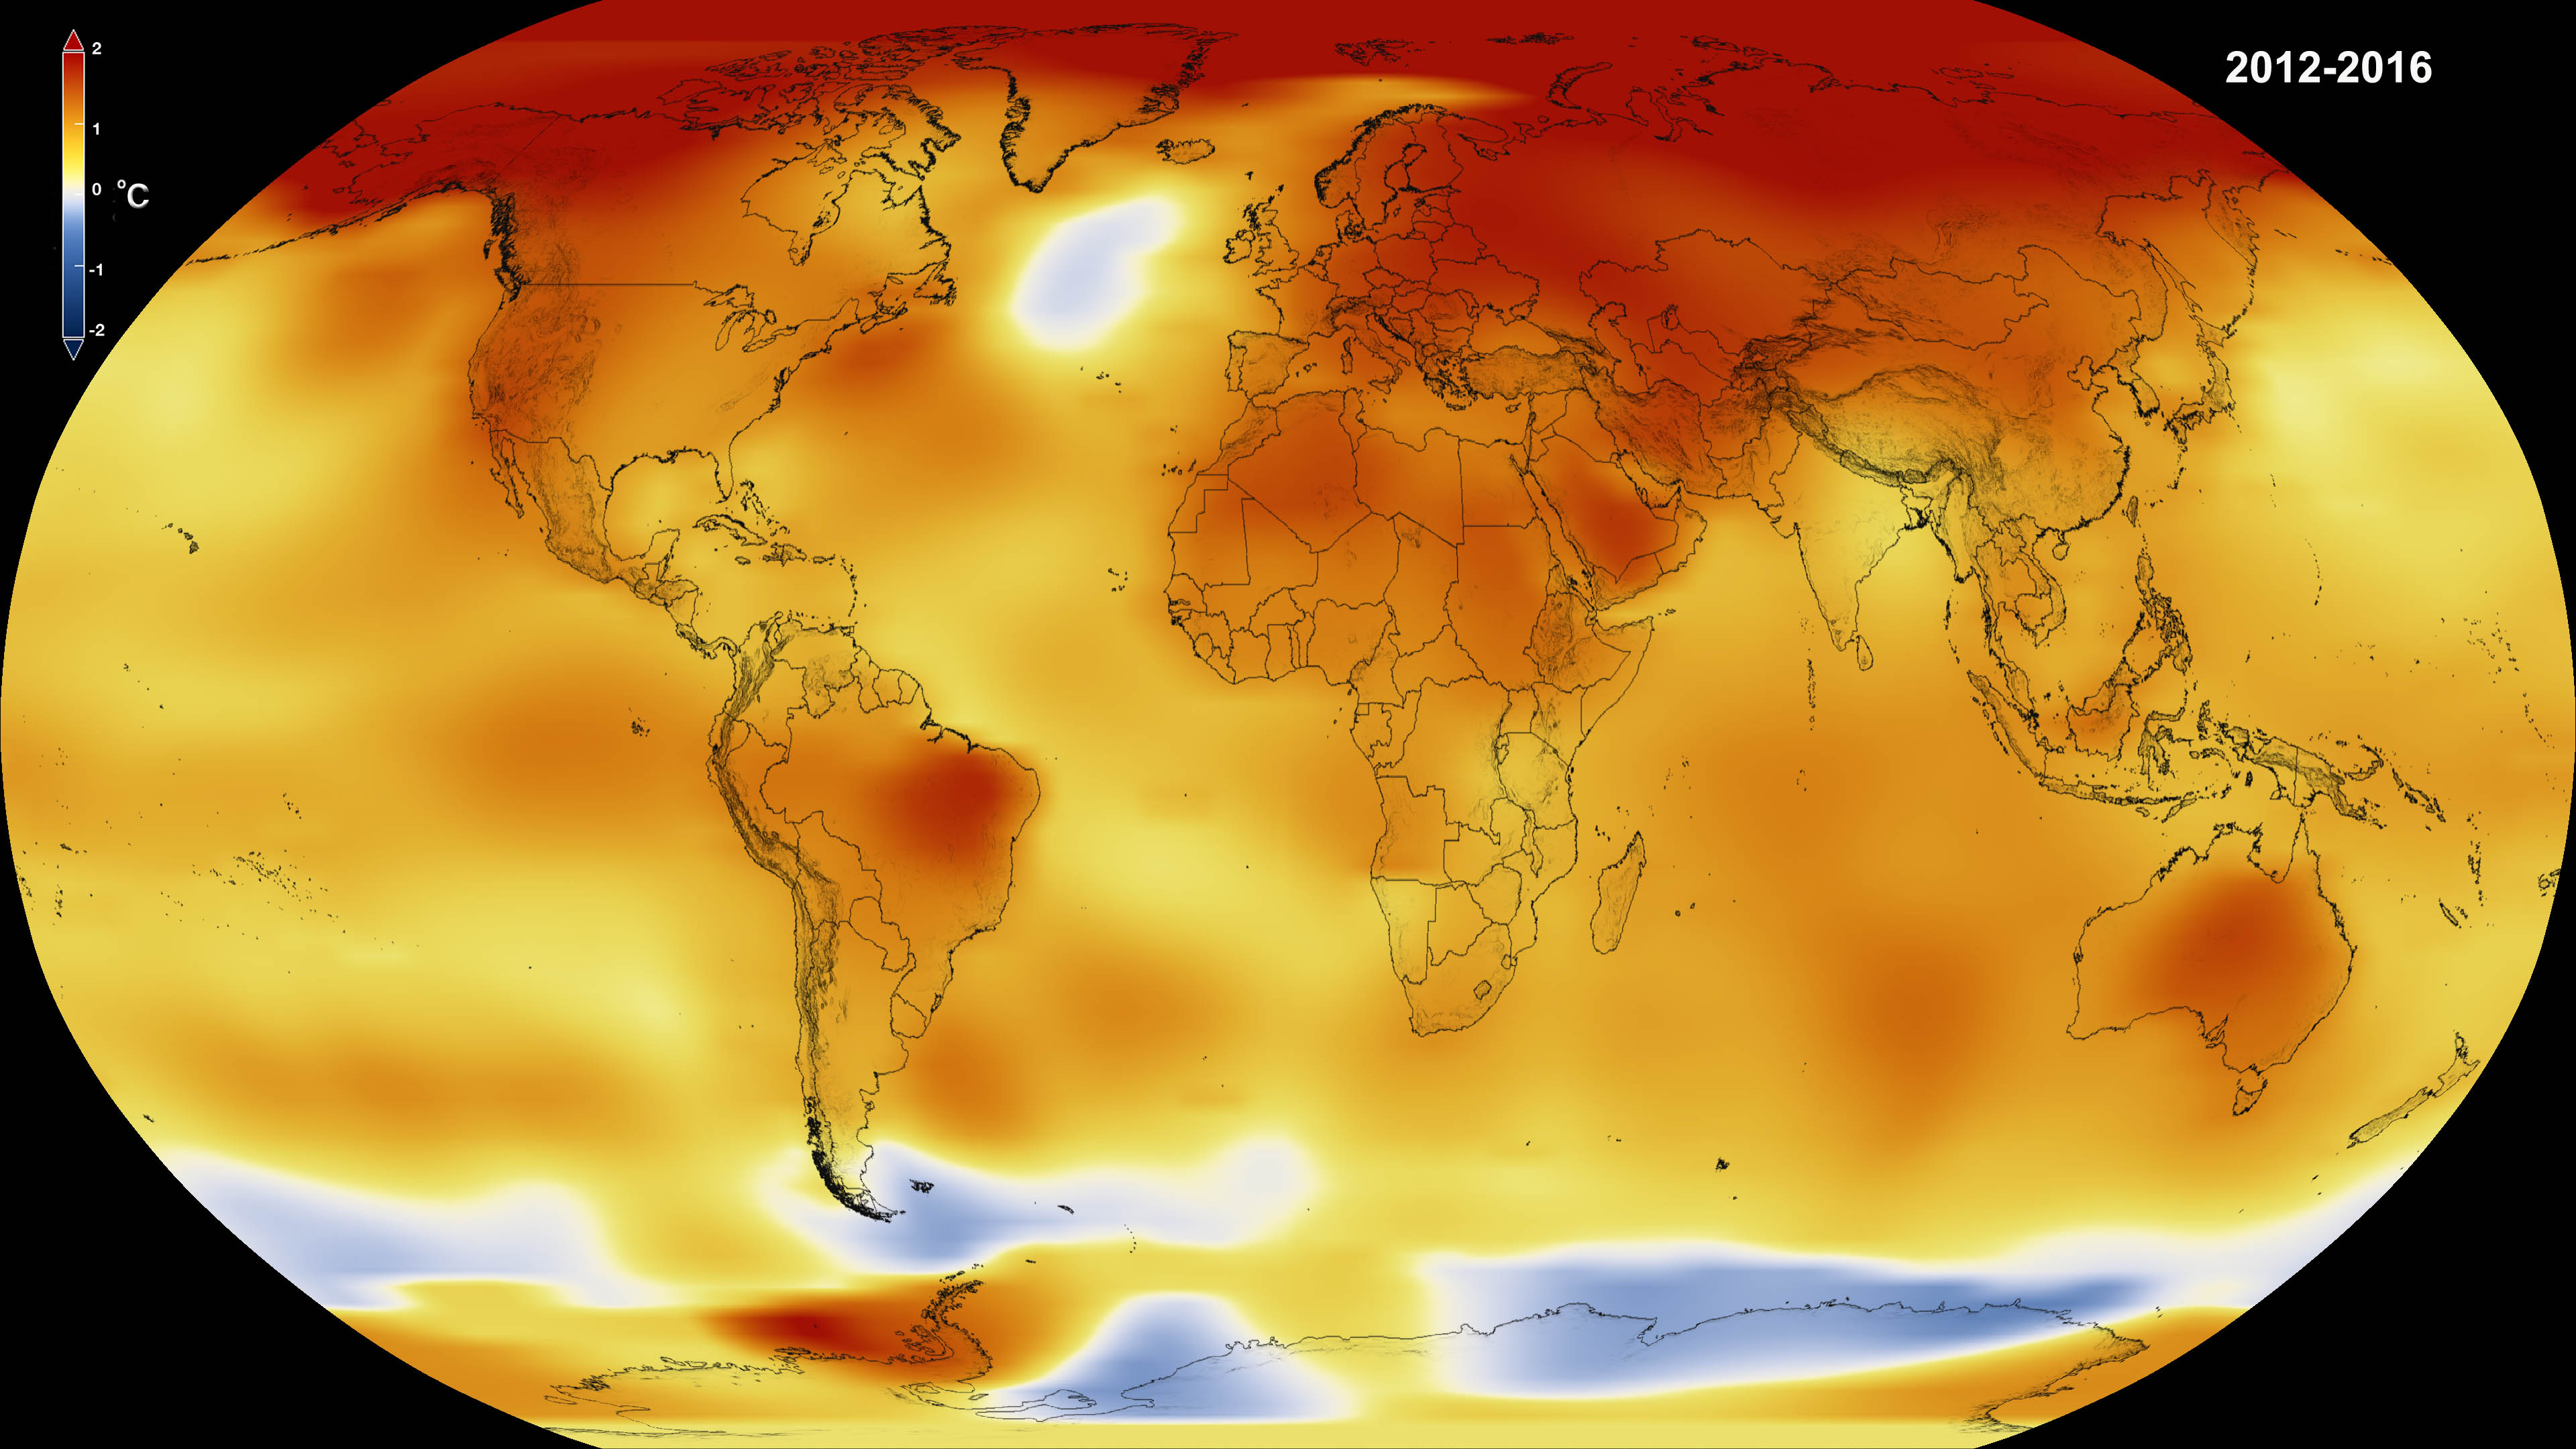
According to data from NASA and the NOAA, 2016 was the hottest year on record yet again. Credit: NASA
The reality of Climate Change has become painfully apparent in recent years, thanks to extended droughts in places like California, diminishing water tables around the world, rising tides, and coastal storms of increasing intensity and frequency. But perhaps the most measurable trend is the way that average global temperatures have kept rising year after year.
And this has certainly been the case for the year of 2016. According to independent analyses provided by NASA’s Goddard Institute for Space Studies (GISS) and the National Oceanic and Atmospheric Agency (NOAA), 2016 was the warmest year since modern record keeping began in 1880. This represents a continuation of a most alarming trend, where 16 of the 17 warmest years on record have occurred since 2001.
Based in New York, GISS conducts space and Earth sciences research, in support of the Goddard Space Flight Center’s (GSFC) Sciences and Exploration Directorate. Since its establishment in 1961, the Institute has conducted valuable research on Earth’s structure and atmosphere, the Earth-Sun relationship, and the structure and atmospheres of other planets in the Solar System.
Monthly temperature anomalies with base 1980-2015, superimposed on a 1980-2015 mean seasonal cycle. Credit: NASA/GISS/Schmidt
Their early studies of Earth and other solar planets using data collected by satellites, space probes, and landers eventually led to GISS becoming a leading authority on atmospheric modeling. Similarly, the NOAA efforts to monitor atmospheric conditions and weather in the US since 1970s has led to them becoming a major scientific authority on Climate Change.
Together, the two organizations looked over global temperature data for the year of 2016 and came to the same conclusion. Based on their assessments, GISS determined that globally-averaged surface temperatures in 2016 were 0.99 °C (1.78 °F) warmer than the mid-20th century mean. As GISS Director Gavin Schmidt put it, these findings should silence any doubts about the ongoing nature of Global Warming:
“2016 is remarkably the third record year in a row in this series. We don’t expect record years every year, but the ongoing long-term warming trend is clear.”
The NOAA’s findings were similar, with an average temperature of 14.83 °C (58.69 °F) being reported for 2016. This surpassed last year’s record by about 0.004 °C (0.07 °F), and represents a change of around 0.94 °C (1.69 F) above the 20th century average. The year began with a boost, thanks to El Nino; and for the eight consecutive months that followed (January to August) the world experienced record temperatures.
This represents a consistent change since 2001, where average global temperatures have increased, leading to of the 16 warmest years on record since 1880 in a row. In addition, on five separate occasions during this period, the annual global temperature was record-breaking – in 2005, 2010, 2014, 2015, and 2016, respectively.
Land and ocean global temperatures in 2013 from both NASA and NOAA. Credit: NASA.
With regards to the long-term trend, average global temperatures have increased by about 1.1° Celsius (2° Fahrenheit) since 1880. This too represents a change, since the rate of increase was placed at 0.8° Celsius (1.4° Fahrenheit) back in 2014. Two-thirds of this warming has occurred since 1975, which coincides with a period of rapid population growth, industrialization, and increased consumption of fossil fuels.
And while there is always a degree of uncertainty when it comes to atmospheric and temperature modelling, owing to the fact that the location of measuring stations and practices change over time, NASA indicated that they were over 95% certain of these results. As such, there is little reason to doubt them, especially since they are consistent with what is at this point a very well-documented trend.
To see an animated graph of average global temperature increases since 1880, click here. To see the full data set and learn about the methods employed by GISS, click here.
And be sure to check out this NASA video that shows these changes on a global map:
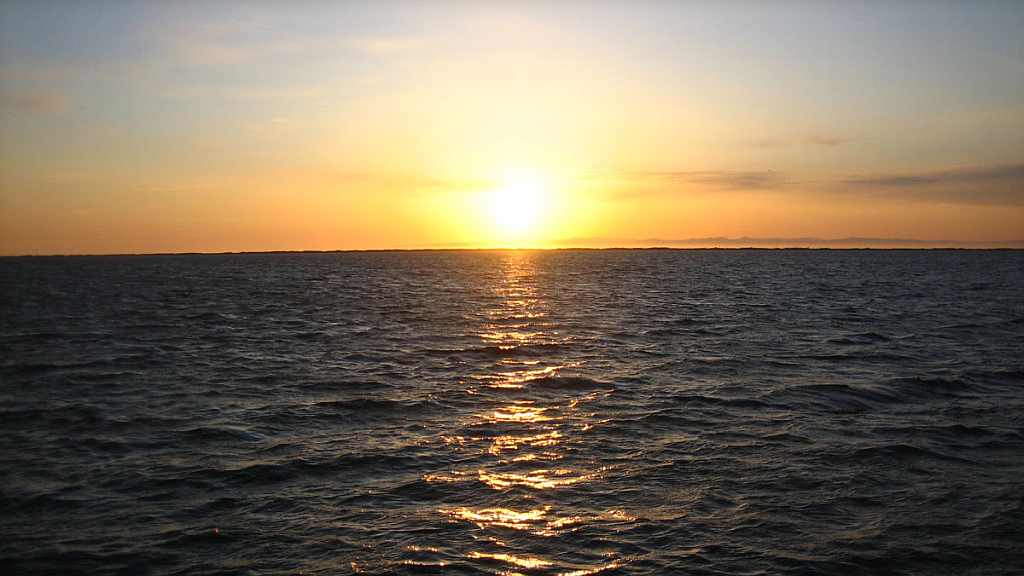
Research into the temporary slowdown of the global mean surface temperature has revealed that the world's oceans have absorbed the "missing heat." Image: Flickr user Brian Richardson, CC by 2.0
A reprieve from Global Warming? A hiatus? That would be nice, wouldn’t it? But in this case, a hiatus is not quite what it seems.
Everybody knows that global warming is partly caused by human activities, largely our use of fossil fuels. We understand how it works and we fear for the future. But there’s been a slowdown in the global mean surface temperature increase between 1998 to 2013. We haven’t lowered our emissions of greenhouse gases (GHGs) significantly during that time, so what happened?
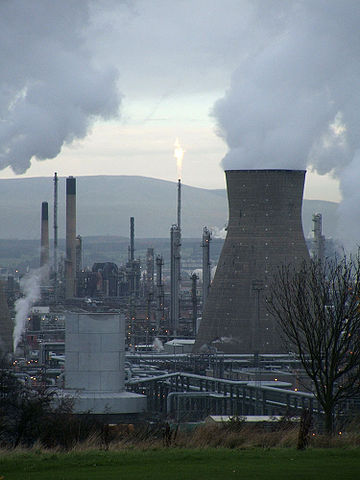
Fossil fuels: we just can’t get enough of them. Image: a petrochemical refinery in Scotland. Credit: User:John from wikipedia, CC BY-SA 3.0, https://commons.wikimedia.org/w/index.php?curid=2459867
A new multi-institutional study involving NASA’s Jet Propulsion Laboratory (JPL), the National Oceanographic and Atmospheric Institute, and others, concludes that Earth’s oceans have absorbed the heat. So instead of the global mean surface temperature rising at a steady rate, the oceans have taken on the job as global heat sink. But what’s the significance of this?
“The hiatus period gives scientists an opportunity to understand uncertainties in how climate systems are measured, as well as to fill in the gap in what scientists know.” -Xiao-Hai Yan, University of Delaware, Newark
In terms of the on-going rise in the temperature of the globe, the hiatus is not that significant. But in terms of the science of global warming, and how well we understand it, the hiatus gives scientists an opportunity.
The new paper, titled “The Global Warming Hiatus: Slowdown or Redistribution?” grew out of the U.S. Climate Variability and Predictability Program (CLIVAR) panel session at the 2015 American Geophysical Union fall meeting. From those discussions, scientists reached consensus on three key points:
From 1998 to 2013, the rate of global mean surface warming slowed, which some call the “global warming hiatus.”
Natural variability plays a large role in the rate of global mean surface warming on decadal time scales.
Improved understanding of how the ocean distributes and redistributes heat will help the scientific community better monitor Earth’s energy budget. Earth’s energy budget is a complex calculation of how much energy enters our climate system from the sun and what happens to it: how much is stored by the land, ocean or atmosphere.
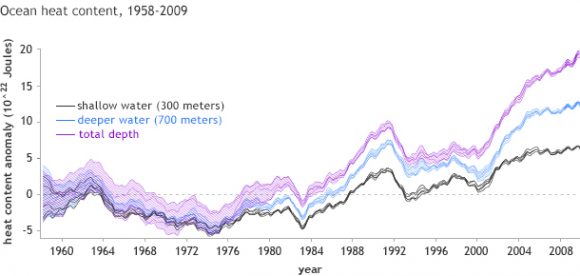
This graph shows the yearly global ocean heat content. The dashed line shows the 1958-65 average. Image: Balmaseda et al., 2013
The paper is a reminder that climate science is complex, and that the oceans play a big part in global warming. As Yan says, “To better monitor Earth’s energy budget and its consequences, the ocean is most important to consider because the amount of heat it can store is extremely large when compared to the land or atmospheric capacity.”
“…”arguably, ocean heat content — from the surface to the seafloor — might be a more appropriate measure of how much our planet is warming.” – from the paper “The Global Warming Hiatus: Slowdown or Redistribution?”
The team behind this new research suggests that saying there’s been a hiatus in global warming is confusing. They suggest “global warming hiatus” be replaced with “global surface warming slowdown.”
There’s a danger in calling it a “global warming hiatus.” Those opposed to climate change and who think it’s a hoax can use that term to discredit climate science. They’ll claim that the “hiatus” shows we don’t understand climate change and the Earth may have stopped warming. But in any case, it’s the long-term trend—change over the course of a century or more—that defines “global warming,” not the change from year to year or even decade to decade.
There’s much more to learn about the oceans’ role in global warming. Research shows that some ocean areas absorb heat much faster than others. But whatever the fine detail of it is, there is broad agreement in the scientific community that the global surface warming slowdown was caused by an increased uptake of heat energy by the world’s oceans.
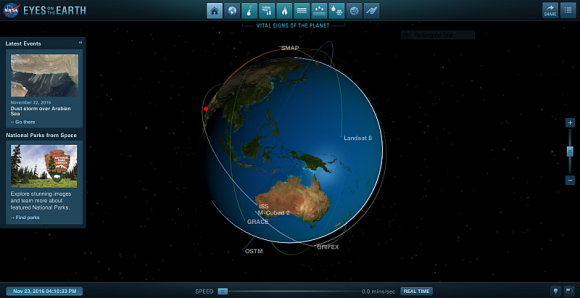
A screenshot from the “NASA’s Eyes” app. The app allows anyone to check Earth’s vital signs. Image: NASA/JPL
NASA uses a lot of tools to monitor the Earth’s temperature. For an interesting look at the Earth’s vital signs, check out Nasa’s Eyes. This easy to use visualization tool lets you take a closer look at the Earth’s temperature, CO2 levels, soil moisture levels, sea levels, and other things.


![This illustration shows the percentage of marine animals that went extinct during Earth's worst extinction at the end of the Permian era by latitude, from the model (black line) and from the fossil record (blue dots).A greater percentage of marine animals survived in the tropics than at the poles. The color of the water shows the temperature change, with red being most severe warming and yellow less warming. At the top is the supercontinent Pangaea, with massive volcanic eruptions emitting carbon dioxide. The images below the line represent some of the 96 percent of marine species that died during the event. [Includes fossil drawings by Ernst Haeckel/Wikimedia; Blue crab photo by Wendy Kaveney/Flickr; Atlantic cod photo by Hans-Petter Fjeld/Wikimedia; Chambered nautilus photo by John White/CalPhotos.]Justin Penn and Curtis Deutsch/University of Washington](https://www.universetoday.com/wp-content/uploads/2018/12/Penn_sumfig_final.jpg)


