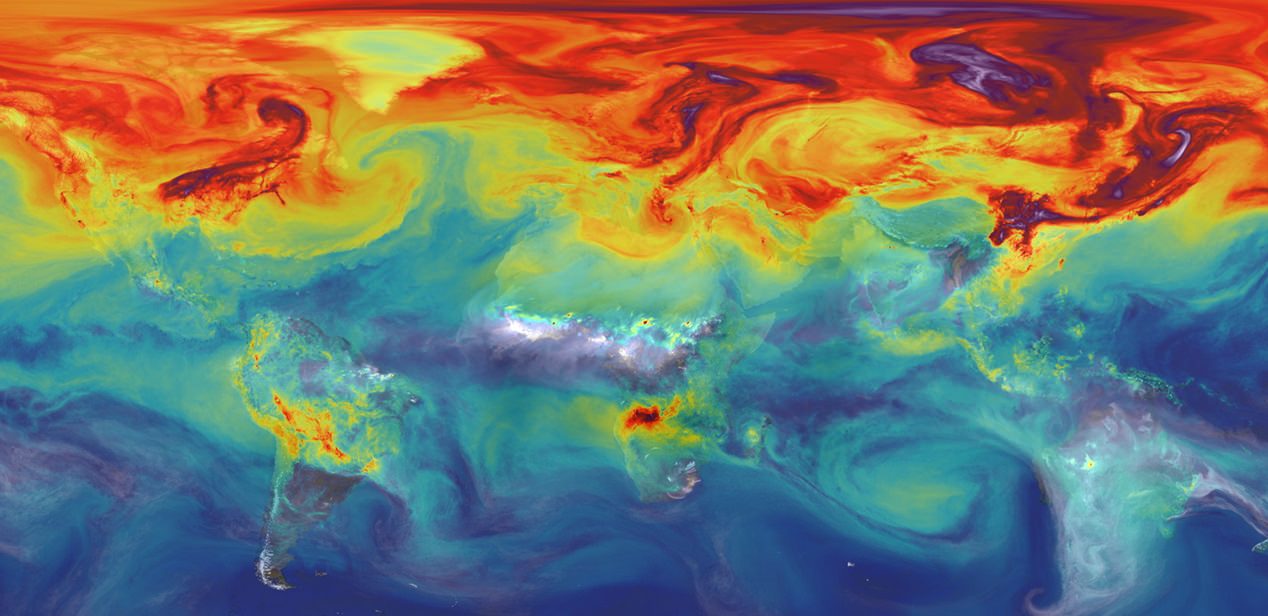
Carbon dioxide in Earth's atmosphere if half of global-warming emissions are not absorbed. Credit: NASA/JPL/GSFC
By definition, pollution refers to any matter that is “out of place”. In other words, it is what happens when toxins, contaminants, and other harmful products are introduced into an environment, disrupting its normal patterns and functions. When it comes to our atmosphere, pollution refers to the introduction of chemicals, particulates, and biological matter that can be harmful to humans, plants and animals, and cause damage to the natural environment.
Whereas some causes of pollution are entirely natural – being the result of sudden changes in temperature, seasonal changes, or regular cycles – others are the result of human impact (i.e. anthropogenic, or man-made). More and more, the effects of air pollution on our planet, especially those that result from human activity, are of great concern to developers, planners and environmental organizations, given the long-term effect they can have.
High concentrations of carbon dioxide (in red) tend to congregate in the northern hemisphere during colder months, when plants can't absorb as much from the atmosphere. This picture is based on a NASA Goddard computer model from ground-based observations and depicts concentrations on March 30, 2006. Credit: NASA's Goddard Space Flight Center/B. Putman/YouTube (screenshot)
Red alert — the amount of carbon dioxide in the atmosphere is increasing year-by-year due to human activity. It’s leading to a warming Earth, but just how quickly — and how badly it will change the environment around us — is hard to say.
NASA released a new video showing how carbon dioxide — a product mainly of fossil fuels — shifts during a typical year. Billed as the most accurate model to date, the emissions shown in 2006 (tracked by ground-based sources) show how wind currents across the globe spread the gas across the globe. The red you see up there indicates high concentrations. The full video is below the jump.
In spring and summer, plants absorb carbon dioxide and the amount in the atmosphere above that hemisphere decreases. In fall and winter, carbon dioxide is not absorbed as well since the plants are dead or dormant. Also seen in the video is carbon monoxide that spreads out from forest fires, particularly in the southern hemisphere.
“Despite carbon dioxide’s significance, much remains unknown about the pathways it takes from emission source to the atmosphere or carbon reservoirs such as oceans and forests,” NASA stated.
“Combined with satellite observations such as those from NASA’s recently launched OCO-2 [Orbiting Carbon Observatory-2], computer models will help scientists better understand the processes that drive carbon dioxide concentrations.”
The model is called GEOS-5 and was made by scientists at the NASA Goddard Space Flight Center’s global modeling and assimilation office.
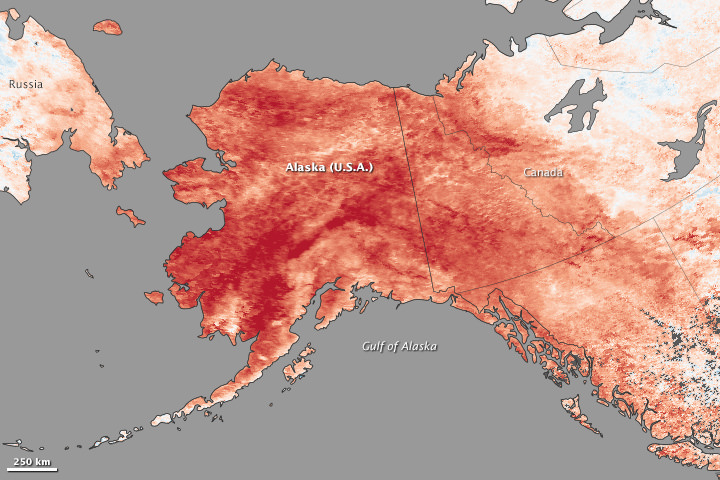
In 2013, a blocking pattern over Alaska caused a record-breaking heat wave. Credit: Photo by Jesse Allen and Jeff Schmatltz, using data from theLand Processes Distributed Active Archive Center(LPDAAC) and theLANCE/EOSDIS Rapid Response
Extreme weather is becoming much more common. Heat waves and heavy rains are escalating, food crops are being damaged, human beings are being displaced due to flooding and animals are migrating toward the poles or going extinct.
Although it has been postulated that these extreme weather events may be due to climate change, a new study has found much better evidence.
The research shows blocking patterns — high-pressure systems that become immobile for days or even weeks, causing extreme heat waves and torrential rain — may have doubled in summers over the last decade.
“Since 2000, we have seen a cluster of these events,” lead author Dim Doumou told The Gaurdian earlier this month. “When these high-altitude waves become quasi-stationary, then we see more extreme weather at the surface. It is especially noticeable for heat extremes.”
It was a blocking pattern that led to the heat wave in Alaska in 2013, and to the devastating floods in Colorado last summer.
These blocking patterns are associated with the jet stream, the fast flowing winds high in Earth’s atmosphere at latitudes between 30 and 60 degrees. Sometimes the flow weakens, and the winds can dip down into more southern latitudes. These excursions lead to blocking patterns.
And the jet stream is becoming “wavier,” with steeper troughs and higher ridges.
The climatologists analyzed 35 years of wind data amassed from satellites, ships, weather stations, and meteorological balloons. They found that a warming Arctic creates and amplifies the conditions that lead to jet stream excursions, therefore raising the chances for long-duration extreme events, like droughts, floods, and heat waves.
That said the climatologists were unable to see a direct causal link between climate change and extreme weather. Ordinarily we think about “cause” in a simple sense in which one thing fully brings about another. But the Colorado floods, for example, were partially caused by moisture from the tropics, a blocking pattern, and past wildfires that increased the risk of runoff.
So there is a difference between “direct causation” and “systematic causation.” The latter is not direct, but it is no less real. In this study, the team noticed that the rise in blocking patterns correlates closely with the extra heating being delivered to the Arctic by climate change. Statistically speaking, the two seem to go hand in hand.
But the team does hypothesize a direct causal link. The jet streams are driven by the difference in temperature between the poles and the equator. So because the Arctic is warming more quickly than lower latitudes, the temperature difference is declining, providing less energy for the jet stream and causing it to meander.
Although the study shows a correlation — not causation — between more frequent blocking patterns (and therefore extreme weather) and Arctic warming, it is a solid step forward in understanding how the two are related.
The article has been published in the journal Proceedings of the National Academies of Science (PNAS).
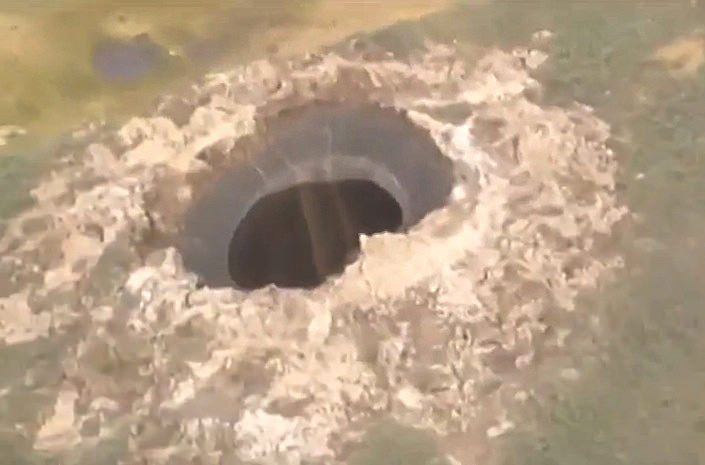
An 80-meter-wide crater recently discovered in northern Siberia (Video screenshot)
What is it with Russia and explosive events of cosmic origins? The 1908 Tunguska Explosion, the Chelyabinsk bolide of February 2013, and now this: an enormous 80-meter 60-meter wide crater discovered in the Yamal peninsula in northern Siberia!
To be fair, this crater is not currently thought to be from a meteorite impact but rather an eruption from below, possibly the result of a rapid release of gas trapped in what was once frozen permafrost. The Yamal region is rich in oil and natural gas, and the crater is located 30 km away from its largest gas field. Still, a team of researchers are en route to investigate the mysterious hole further.
Watch a video captured by engineer Konstantin Nikolaev during a helicopter flyover below:
In the video the Yamal crater/hole has what appear to be streams of dry material falling into it. Its depth has not yet been determined. (Update: latest measurements estimate the depth of the hole to be 50-70 meters. Source.)
“The list of possible natural explanations for the giant hole includes a meteorite strike and a gas explosion, or possibly an eruption of underground ice.”
Dark material around the inner edge of the hole seems to suggest high temperatures during its formation. But rather than the remains of a violent impact by a space rock — or the crash-landing of a UFO, as some have already speculated — this crater may be a particularly explosive result of global warming.
According to The Siberian Times:
“Anna Kurchatova from Sub-Arctic Scientific Research Centre thinks the crater was formed by a water, salt and gas mixture igniting an underground explosion, the result of global warming. She postulates that gas accumulated in ice mixed with sand beneath the surface, and that this was mixed with salt – some 10,000 years ago this area was a sea.”
The crater is thought to have formed sometime in 2012.
UPDATE July 17: A new video (in Russian) of the hole from the research team has come out, and apparently it’s been made clear that it’s not the result of a meteorite. Exactly what process did produce it is still unknown, but rising temperatures are still thought to be a factor. Watch below (via Sploid).
(If any Russian-speaking UT readers would like to translate what’s being said, feel free to share in the comments below.)
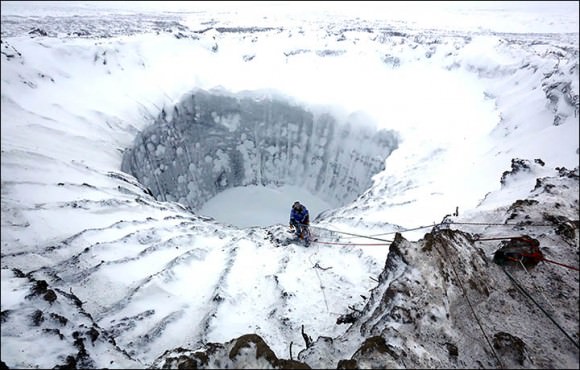
UPDATE Nov. 13: Once the water in these holes froze solid scientists were able to enter and explore the bottoms. According to an article published on The Guardian, “eighty percent of the crater appears to be made up of ice and there are no traces of a meteorite strike.”
Researchers descend into an ice-covered Yamal Crater in Siberia. Credit: Vladimir Pushkarev/Russian Centre of Arctic Exploration (via Siberian Times)
“As of now we don’t see anything dangerous in the sudden appearance of such holes, but we’ve got to study them properly to make absolutely sure we understand the nature of their appearance and don’t need to be afraid about them.”
– Vladimir Pushkarev, Director, Russian Center of Arctic Exploration
See more photos from inside the crater from the Russian Center of Arctic Exploration on The Siberian Times here.
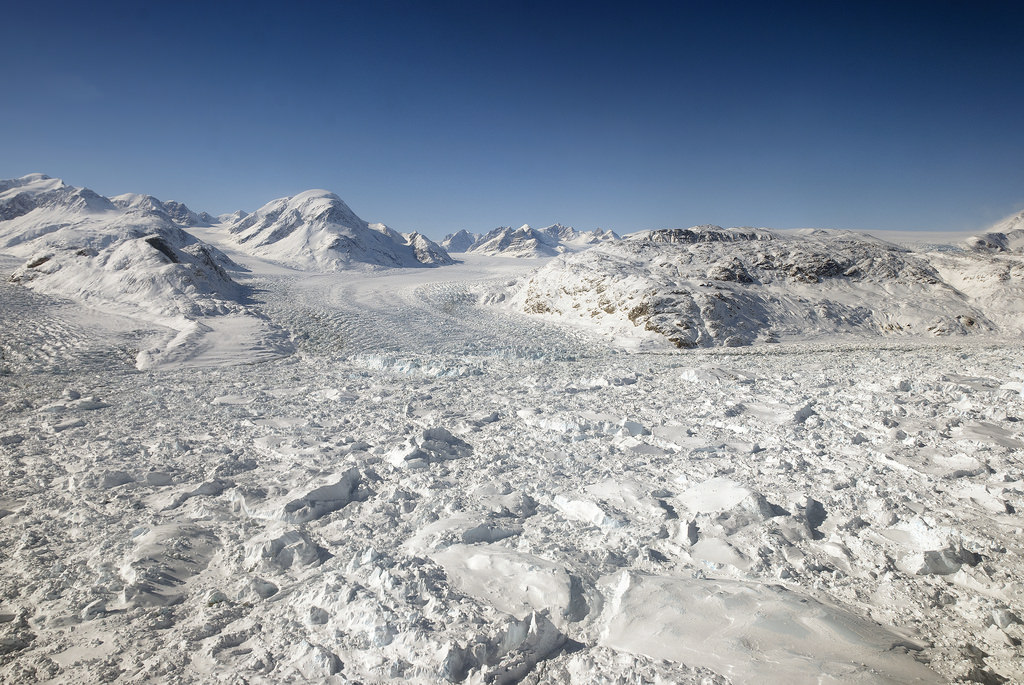
Floating ice at the calving front of Greenland's Kangerdlugssuaq glacier, photographed in 2011 during Operation IceBridge (Credit: NASA/Michael Studinger)
Greenland’s glaciers may contribute more to future sea level rise than once thought, despite earlier reports that their steady seaward advance is a bit slower than expected. This is just more sobering news on the current state of Earth’s ice from the same researchers that recently announced the “unstoppable” retreat of West Antarctic glaciers.
Using data collected by several international radar-mapping satellites and NASA’s airborne Operation IceBridge surveys, scientists at NASA and the University of California, Irvine have discovered deep canyons below the ice sheet along Greenland’s western coast. These canyons cut far inland, and are likely to drive ocean-feeding glaciers into the sea faster and for longer periods of time as Earth’s climate continues to warm.
Some previous models of Greenland’s glaciers expected their retreat to slow once they receded to higher altitudes, making their overall contribution to sea level increase uncertain. But with this new map of the terrain far below the ice, modeled with radar soundings and high-resolution ice motion data, it doesn’t seem that the ice sheets’ recession will halt any time soon.
According to the team’s paper, the findings “imply that the outlet glaciers of Greenland, and the ice sheet as a whole, are probably more vulnerable to ocean thermal forcing and peripheral thinning than inferred previously from existing numerical ice-sheet models.”
“The glaciers of Greenland are likely to retreat faster and farther inland than anticipated, and for much longer, according to this very different topography we have discovered. This has major implications, because the glacier melt will contribute much more to rising seas around the globe.”
– Mathieu Morlighem, project scientist, University of California, Irving
Many of the newly-discovered canyons descend below sea level and extend over 65 miles (100 kilometers) inland, making them vulnerable — like the glaciers in West Antarctica — to undercutting by warmer ocean currents.
The team’s findings were published on May 18 in a report titled Deeply Incised Submarine Glacial Valleys Beneath the Greenland Ice Sheet in the journal Nature Geoscience.
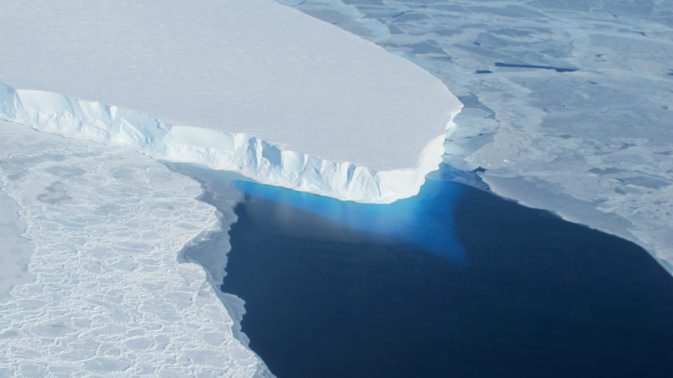
It’s a key piece of the climate change puzzle. For years, researchers have been eyeing the stability of the Western Antarctic Ice Sheet as global temperatures rise. Melting of the ice sheet could have dire consequences for sea level rise.
And though not unexpected, news from today’s NASA press conference delivered by Tom Wagner, a cryosphere program scientist with the Earth Science Division of NASA’s Science Mission Directorate in Washington D.C., Sridhar Anandakrishnan, a professor of geosciences at Pennsylvania University, and Eric Rignot, JPL glaciologist and professor of Earth system science at the University of California Irvine was certainly troubling.
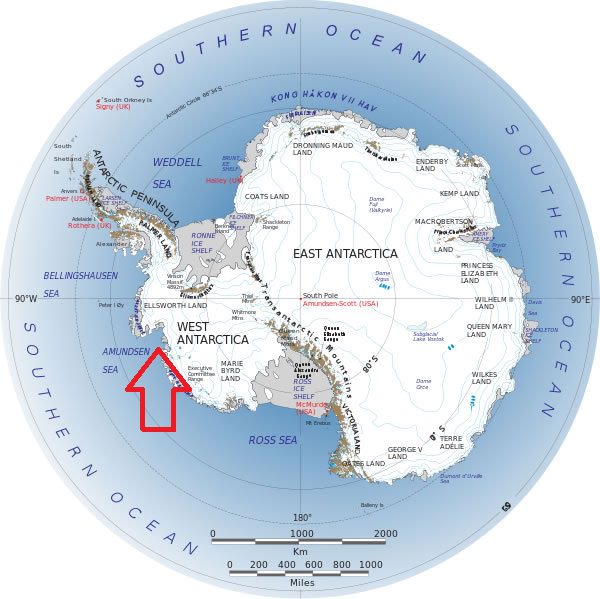
The key region targeted in the study (arrowed) Credit: NASA
The Western Antarctic Ice Sheet is a marine-based ice sheet below sea level that is bounded by the Ronne and Ross Ice Shelf and contains glaciers that drain into the Amundsen Sea. The study announced today incorporates 40 years of data citing multiple lines of observational evidence measuring movement and thickness of Antarctic ice sheets. A key factor to this loss is a thinning along the grounding line of the glaciers from underneath. The grounding line for an ice sheet is the crucial boundary where ice becomes detached from ground underneath and stretches out to become free floating. A slow degradation of the Western Antarctic Ice Sheet has been observed, one that can be attributed to increased stratospheric circulation along with the advection of ocean heat coupled with anthropogenic global warming.
A closeup of the region: red indicates regions where flow speeds have accelerated in the past 40 years. Credit: Eric Rignot
“This sector will be a major contributor to sea level rise in the decades and centuries to come,” Rignot said in today’s press release. “A conservative estimate is it would take several centuries for all of the ice to flow into the sea.”
Thickness contributes to the driving stress of a glacier. Accelerating flow speeds stretch these glaciers out, reducing their weight and lifting them off of the bedrock below in a continuous feedback process.
A key concern for years has been the possible collapse of western Antarctica’s glaciers, leading to a drastic acceleration in sea-level rise worldwide. Such a catastrophic glacial retreat would dump millions of tons of ice into the sea over a relatively short span of time. And while it’s true that ice calves off of the Western Antarctic ice sheet every summer, the annual overall rate is increasing.
The study is backed up by satellite, airborne and ground observations looking at thickness of ice layers over decades.
Researchers stated that the Amundsen Sea Embayment sector alone contains enough ice to increase global sea level by 1.2 metres. A strengthening of wind circulation around the South Pole region since the 1980s has accelerated this process, along with the loss of ozone. This circulation also makes the process more complex than similar types of ice loss seen in Greenland in the Arctic.
The research paper, titled Widespread, rapid grounding line retreat of Pine Island, Thwaites, Smith and Kohler glaciers, West Antarctica from 1992 to 2011 has been accepted for publication in the American Geophysical Union’s journal Geophysical Research Letters. The American Association for the Advancement of Science will also be releasing a related study on the instability of the West Antarctic ice sheet today in the journal Science.
The most spectacular retreat referenced in the study was seen occurring at the Smith/Kohler glaciers, which migrated about 35 kilometres and became ungrounded over a 500 kilometre square region during the span of 1992 to 2011.
Another telling factor cited in the study was the large scale synchronous ungrounding of several glaciers, suggesting a common trigger mechanism — such as ocean heat flux — is at play.
On the ice shelf proper, the key points that anchor or pin the glaciers to the bedrock below are swiftly vanishing, further destabilizing the ice in the region.
Assets that were used in the study included interferometry data from the Earth Remote Sensing (ERS-1/2) satellites’ InSAR (Interferormetry Synthetic Aperture Radar) instruments, ground team observations and data collected from NASA’s Operation IceBridge overflights of the Antarctic. IceBridge uses a converted U.S. Navy P-3 Orion submarine hunting aircraft equipped with radar experiment packages used to take measurements of the thickness of the ice sheet.
Possible follow up studies targeting the region are upcoming, including five Earth science and observation missions scheduled to be launched this year, which include the Soil Moisture and Passive (SMAP) mission, The Orbiting Carbon Observatory (OCO-2) and the Global Precipitation Measurement (GPM) Core Observatory, launched this past February.
Along with these future NASA missions, there are also two missions — RapidScat and the Cloud-Aerosol Transport System or CATS — slated to study climate headed for the International Space Station this year.
This comes as recent United Nations and United States reports have also announced the reality of climate change and anthropogenic global warming.
“The collapse of this sector of West Antarctica appears to be unstoppable,” Rignot said. “The fact that the retreat is happening simultaneously over a large sector suggests it was triggered by a common cause, such as an increase in the amount of ocean heat beneath the floating sections of the glaciers.”
Of course, the solar cycle, volcanic activity, global dimming (via changes in reflectivity, known as albedo) and human activity all play a role in the riddle that is climate change. The bad news is, taking only natural factors into account, we should be in a cooling period right now.
And yes, reflective ice cover also plays a role in the albedo of the Earth, but researchers told Universe Today that no significant overall seasonal variations in the extent of surface layer of ice will change, as the key loss comes from the ungrounding of ice from below. Thus, this ice loss does not present a significant contribution to changes in overall global albedo, though of course, much of this additional moisture will eventually be available for circulation in the atmosphere. And the same was noted in the press conference for those pinning their hopes on the 2014 ice extent being greater than previous years, a season that was a mere blip on the overall trend. The change and retreat in the grounding line below seen in the study was irrespective of the ice extent above.
NASA’s Operation IceBridge will continue to monitor the ice flow when the next Antarctic deployment cycle resumes in October of this year.
And in the meantime, the true discussion is turning to the challenges of living with a warmer planet. Insurance companies, the Department of Defense and residents of low-lying coastal regions such as Miami’s South Beach already know that the reality of global warming and sea level rise is here. Perhaps the very fact that naysayers have at least backed up their positions a bit in recent years from “global warming isn’t happening” to “Its happening, but there are natural cycles” can at least give us a starting point for true intelligent science-based dialogue to begin.
– Social media questions from today’s conference can be reviewed at the #AskNASA hastag.
Climate change is now affecting every continent and ocean says the latest report by the Intergovernmental Panel on Climate Change (IPCC), an international collaboration of more than 2,500 experts. If we don’t act soon to bring greenhouse gas emissions under control, the problems will only grow substantially worse. This isn’t a casual statement from a few fringe scientists: nearly 500 people had to sign off on the exact wording of the summary, including 66 expert authors, 271 officials from 115 countries, and 57 observers.
The report is the second of three installments of the IPCC’s fifth assessment of climate change. The first installment, released last year, covered the physical science of climate change. It stated with certainty that climate change is very real and that we are the cause. The new report focuses on the impacts of climate change and how to adapt to them. The third installment, which will come out in April, will focus on cutting greenhouse emissions.
Ice in the Arctic is collapsing, the oceans are rising, coral reefs are dying, fresh water supplies are diminishing, and the oceans are becoming more acidic, which is killing certain creatures and stunting the growth of others. Heat waves and heavy rains are escalating, food crops are being damaged, disease is spreading, human beings will be displaced due to flooding, animals are migrating toward the poles or going extinct, and the worst is yet to come.
The evidence the world is warming is indubitable.
And yet climate change deniers are still represented the world over. Most notably, the Heartland Institute weighed in on the report by focusing on the benefits of climate change. The group’s take on the matter reads like a crude April Fool’s joke.
A Wall Street Journal op-ed by Matt Ridley has also gained quite a bit of attention. An article in Climate Science Watch refers to his piece as “a laundry list of IPCC misrepresentations.” Ridley fails to cite the data presented in the latest report and even tries to claim that global warming will have net benefits.
From the sweeping opinion articles to the simple comments posted below online articles, the IPCC report is being tragically misinterpreted. One need only take a quick glance at the data to see that the world is warming and catastrophic effects are already occurring.
Climate change is global. It will not only affect the poorest nations but the world. “Nobody on this planet is going to be untouched by the impacts of climate change,” said Rajendra K. Pachauri, chairman of the IPCC in a news conference presenting the report.
Yes this report is sobering. But it also provides an opportunity. We have the power, the intelligence, and the moral duty to protect our home planet. We cannot reverse the damage. We might not even be able to stop it. But we can minimize it. There is still time.
We can act across all scales — local to global — to help reduce greenhouse gas emissions. But first we must learn to adapt to a changing environment. Many governments are well past the state of acknowledging climate change and are in fact starting to find solutions.
“I think that dealing effectively with climate change is just going to be something great nations do,” said Christopher Field, co-chairman of the working group that wrote the report and an earth scientist at the Carnegie Institution for Science in Stanford.
The state of New York recently ordered an electric utility serving Manhattan and its surrounding suburbs, to spend $1 billion upgrading its system to prevent future damage from flooding and other weather disruptions. In a reaction to the blackouts caused by Hurricane Sandy and the acceptance that more extreme weather is to come, the company will raise flood walls, bury vital equipment and determine whether or not emerging climate risks will demand different actions.
Utility regulators across the States are discussing whether to follow New York’s lead.
While greenhouse gas emissions have begun to decline slightly in many countries, including the United States, those gains are being swamped by emissions from other countries such as China and India. We must make greater efforts to adapt or the warming planet will be inevitable.
“There is no question that we live in a world already altered by climate change,” said Field. The time for action is now.
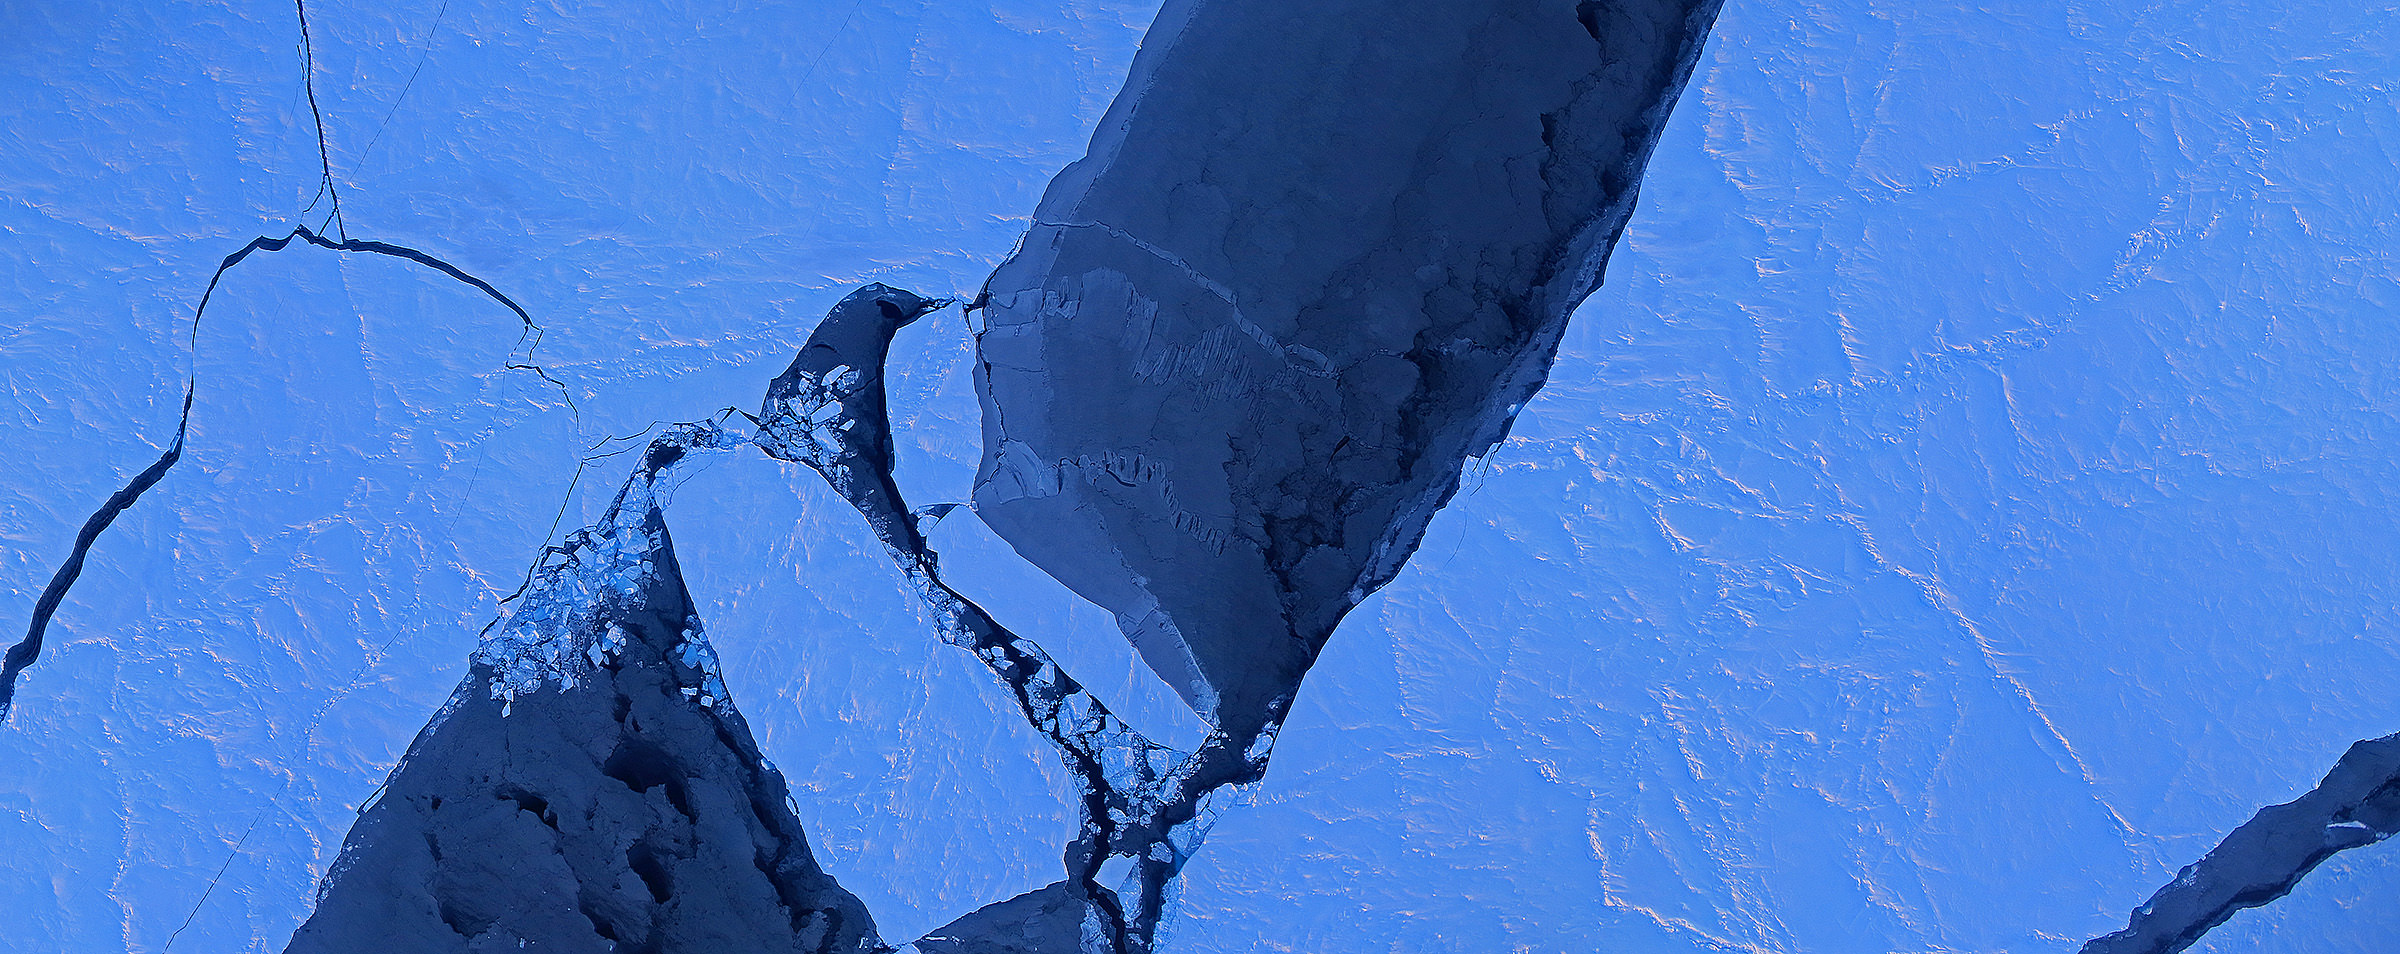
An image mosaic of ice breaking up in the Arctic Ocean's Canada Basin on March 28, 2014. Image taken by Operation IceBridge's Digital Mapping System. Credit: Digital Mapping System/NASA Ames
The Arctic melt season is averaging five days longer with each passing decade, a new study by NASA and the National Snow and Ice Data Center reveals. And with more ice-free days, the water (which is darker than the surrounding ice) is absorbing the sun’s heat and accelerating the process. This means the Arctic ice cap has shrank by as much as four feet.
The sobering news comes following a study of satellite data from 1979 to 2013. By the end of this century, scientists believe, there will be a fully melted Arctic Ocean during the entire summer. And the news also comes in the same week that the Intergovernmental Panel on Climate Change (IPCC) released its own report on global warming.
“The Arctic is warming and this is causing the melt season to last longer,” stated Julienne Stroeve, a senior scientist at NSIDC, Boulder and lead author of a new study. “The lengthening of the melt season is allowing for more of the sun’s energy to get stored in the ocean and increase ice melt during the summer, overall weakening the sea ice cover.”
The research further revealed that solar radiation absorption depends on when the melt season begins; this is particularly true since the sun rises higher during the spring, summer and fall than in the winter. It’s still hard to predict when things will melt or freeze, however, since this depends on weather.
“There is a trend for later freeze-up, but we can’t tell whether a particular year is going to have an earlier or later freeze-up,” Stroeve said. “There remains a lot of variability from year to year as to the exact timing of when the ice will reform, making it difficult for industry to plan when to stop operations in the Arctic.”
Data was collected with NASA’s (long deceased) Nimbus-7 Scanning Multichannel Microwave Radiometer and instruments aboard Defense Meteorological Satellite Program spacecraft.
“When ice and snow begin to melt, the presence of water causes spikes in the microwave radiation that the snow grains emit, which these sensors can detect,” NASA stated. “Once the melt season is in full force, the microwave emissivity of the ice and snow stabilizes, and it doesn’t change again until the onset of the freezing season causes another set of spikes.”
The research has been accepted for publication in Geophysical Research Letters.
Climate change is one of the defining issues of our time. So begins the latest report by the U.S. National Academy of Sciences and the United Kingdom’s Royal Society. The two institutions agree: climate change is not only indisputable, it’s largely the result of human activities.
The bulk of the 36-page report is presented in a question-and-answer format, making it a good bed-side read. But in case you don’t want to have nightmares about surging temperatures or polar bears alone on breaking ice caps, we’ll leaf through the intriguing points here.
In a forward to the report, Dr. Ralph J. Cicerone, president of the National Academy of Sciences, and Sir Paul Nurse, president of the Royal Society argue that multiple lines of evidence show that humans are changing Earth’s climate. This is now more certain than ever.
They are careful to include a caveat: “The evidence is clear. However, due to the nature of science, not every single detail is ever totally settled or completely certain. Nor has every pertinent question yet been answered.” Areas of active debate include how much warming to expect in the future and the connections between climate change and extreme weather events such as the frequency and intensity of hurricanes, droughts and floods.
Earth’s global average surface temperature has risen as shown in this plot of combined land and ocean measurements from 1850 to 2012, derived from three independent analyses of the available data sets. Image Credit: National Academy of Sciences / The Royal Society
But the first question: is the climate warming? goes without debate. Yes. Earth’s average surface air temperature has increased by about 0.8 degrees Celsius since 1900, and the last 30 years have been the warmest in 800 years. It’s the most rapid period of sustained temperature change in the scale of global history, trumping every ice age cycle.
Recent estimates of the increase in global temperature since the end of the last ice age are four to five degrees Celsius. While this is much greater than the 0.8 degree Celsius change recorded over the last 100+ years, this change occurred over a period of about 7,000 years. So the change in rate is now 10 times faster.
Of course an increase in temperature goes hand in hand with an increase in carbon emissions. Greenhouse gases such as carbon dioxide absorb heat (infrared radiation) emitted from the Earth’s surface. Increases in the atmospheric concentrations of these gases trap most of the outgoing heat, causing the Earth to warm. Human activities, especially the burning of fossil fuels have increased carbon dioxide concentrations by 40 percent between 1880 and 2012. It is now higher than at any time in at least 800,000 years.
And if the rise in carbon emissions continues unchecked, warming of the same magnitude as the increase out of the last ice age can be expected by the end of this century.
The report continues to ask more controversial questions. Take as an example the question: Does the recent slowdown of warming mean that climate change is no longer happening? The short answer is no. Decades of slow warming and accelerated warming occur naturally in the climate system. Despite the slower rate of warming the 2000’s were still warmer than the 1990’s
The new report builds upon the long history of climate-related work from the United Nations’ Intergovernmental Panel on Climate Change. So while some have argued it doesn’t add anything new to the wealth of climate science data available, it does help make that data more succinct and available to the public. Its goal is to help inform decision makers, policy makers, educators and all other individuals.
The report concludes by noting available options to citizens and governments. They can simply wait and accept the losses, they can change their pattern of energy production, they can attempt to adapt to environmental changes as much as possible, or they can seek as yet unproven geoengineering solutions.
No matter which option we choose, one thing remains certain: the Earth is warming at a tremendous rate and we are the cause.
We are awash in the unseen, the unknown and the unexplained. Our Universe is enshrouded in mystery. Even what we do know — the complex physical laws that describe the planets, stars and galaxies — can seem just beyond any normal human being’s grasp. We can’t all be Einsteins, after all.
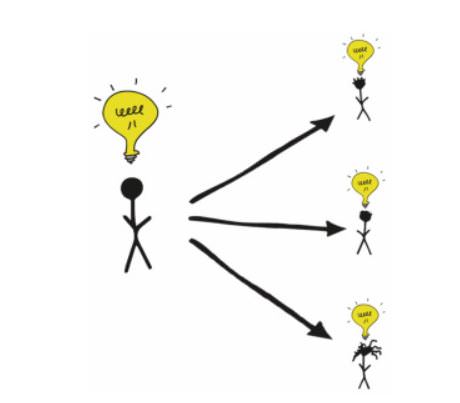
But excluding string theory, dark energy and quantum field theory most of science is remarkably within our grasp. And in less than a minute, a concept as culturally conflicted and misunderstood as global warming, can be explained. See above.
The motivation behind this video is simple. Research shows that virtually no Americans — roughly 0 percent — can explain the physical mechanisms of global warming at even a basic level. So Berkeley Professor Michael Ranney and colleagues created a total of five videos (with the longest clocking in at 656 words in under five minutes) with the hope of elucidating the basics of global warming.
Their initial study, completed in 2011, surveyed 270 people in San Diego parks in order to assess how well the average American understands global warming. San Diego was chosen because it draws tourists from across the United States, and would thus create a better rounded sample.
“The main concept we were hoping people would tell us, which is at the heart of understanding global warming, is that there is an asymmetry between stuff that’s coming in to our planet and stuff that’s heading out,” Ranney told Universe Today.
This asymmetry explains why sunlight (in the form of visible light) may enter the atmosphere unhindered but is later impeded by greenhouse gases (because it is no longer in the form of visible light — it has been absorbed by the Earth and emitted in the form of infrared light). But not a single person could explain global warming at this basic level.
“We were shocked at how few people knew this” Ranney said. “I thought it was a moral imperative to get the word out as fast as possible.”
So Ranney and his colleagues set out with their work in front of them, creating the videos in order to increase the average American’s understanding of global warming. Their goal is that any one of the five videos will change the lives of seven billion viewers.
“We hope that a video of 400 words or even 35 words will allow people to have a moment in time to which they fix that they knew what the mechanism of climate change was,” Ranney told Universe Today. For that single moment “their knowledge was obvious, valid, understandable and available.”
In order to drive this point home, Ranney used an analogy that began like this: “So a climate change acceptor walks into a bar.” But all jokes aside, if one who accepts anthropogenic global warming tries to convince the man sitting next to him that global warming is real, but cannot explain the physical mechanism behind global warming, then he’s in trouble. He’s likely not only lost his bar mate but encouraged a life-time of global warming denial.
We cannot expect to increase the public’s awareness and acceptance of climate change without a huge increase in scientific literacy. Even if every viewer can’t recall the exact mechanistic details of global warming they can at least say to the man sitting next to them at the bar: “Look, I can’t regurgitate it now but I did understand it then.”
This graph from NOAA shows the annual trend in average global air temperature in degrees Celsius, through December 2012. For each year, the range of uncertainty is indicated by the gray vertical bars. The blue line tracks the changes in the trend over time. Click here or on the image to enlarge. (Image courtesy NOAA’s National Climatic Data Center.)
A second study provided college students with an explanation akin to the one found in the five-minute video. After reading it, the students not only understood global warming better but they were also more likely to accept global warming as a reality — suggesting these videos have the power to change people’s minds.
“Eventually people come to appreciate salient evidence,” Ranney told Universe Today. “Let’s say you think you’re in a fantastic monogamous relationship. If you come home and find your partner with someone else, it only takes that one moment in time to change your belief.”
Helping people to understand the basic physics behind global warming is a vital tool in convincing them that global warming is as real as it gets. Once someone clicks on the video, the next 52 seconds alone might leave a pretty big impact.
Ranney emphasized help from graduate student Lee Nevo Lamprey, undergraduate student Kimberly Le and other collaborators (including Dav Clark, Daniel Reinholz, Lloyd Goldwasser, Sarah Cohen and Rachel Ranney).