Gases In The Atmosphere

Atmosphere layers. Image credit: NASA

[/caption]There are different gases in the atmosphere. There’s nitrogen (the most abundant of them all), oxygen, and argon. There are of course a lot more but they’re no more than 1% of the entire atmosphere.

Among the minority are the greenhouse gases, carbon dioxide being the most prominent of them all. These gases are presently cast as harmful to the planet, being the primary cause of global warming. Of course, they’re only harmful because they’ve exceeded their ideal levels. Anything that comes in excess is not good, right?

At ideal levels, greenhouse gases play an important role in keeping our planet warm enough for us and other organisms to live comfortably. Unfortunately, the rapid rate of industrialization has caused greenhouse gases to accumulate, forming a layer too thick for infrared radiation (which originally came in from the Sun as solar radiation) to escape.

The different gases in the atmosphere actually make up five principal layers. Starting from the lowest layer, there’s the Troposphere, followed by Stratosphere, then the Mesosphere, then Thermosphere, and finally the Exosphere.

The peak of Mount Everest, high as it is, is still part of the Troposphere. The Stratosphere is the layer at which most weather balloons fly. The Mesosphere is where meteors mostly ignite. The Thermosphere is where the International Space Station orbits.

Since the Karman line (which serves as the boundary between the Earth’s immediate atmosphere and outer space) is found in the lower region of the Thermosphere, much of this layer of gases in the atmosphere is considered outer space. Finally, the exosphere, being the outermost layer, is where you can find the lightest gases: hydrogen and helium.

Many properties of the gases in the atmosphere are dependent on the altitude at which they are found. For instance, average density of these gases generally decrease as one rises to higher altitudes. As a result, the pressure (being due to the collisions of the particles that make up the gas) also decreases in the same manner.

Since the force of gravity pulls down on the masses of these gases, the heavier gases are typically found near the surface of the Earth while the lightest ones (e.g. hydrogen and helium) are found in higher altitudes. All these properties are just generalizations though. Temperature and fluid dynamics also influence these properties.

Want to learn more about the atmosphere and air pressure? You can read about both here in Universe Today.

Of course, you can find more info at NASA too. Follow these links:
Earth’s Atmosphere
Earth

Tired eyes? We recommend you let your ears do the work for a change. Here are some episodes from Astronomy Cast:
Atmospheres
Plate Tectonics

An Astronomical Perspective on Climate Change

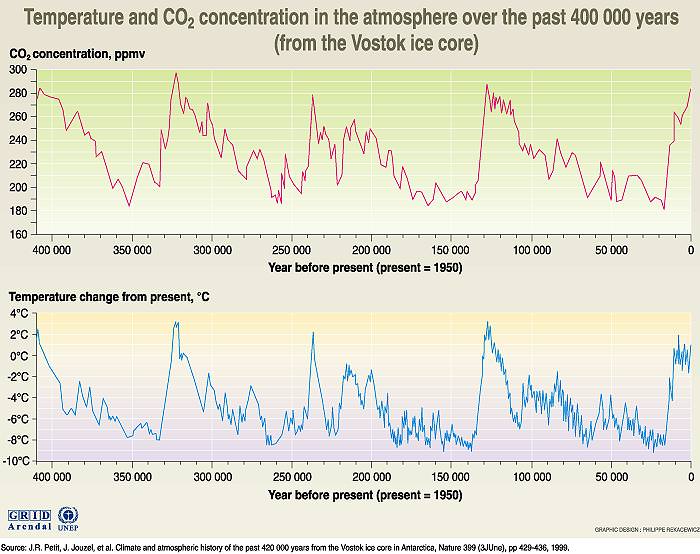
Ice cores and deep sea bed cores provide the best available record of changes in global temperature and CO2 content of the atmosphere going back 800,000 years. The data shows a clear periodicity in global temperatures which is thought to be linked to the Milankovitch cycle.

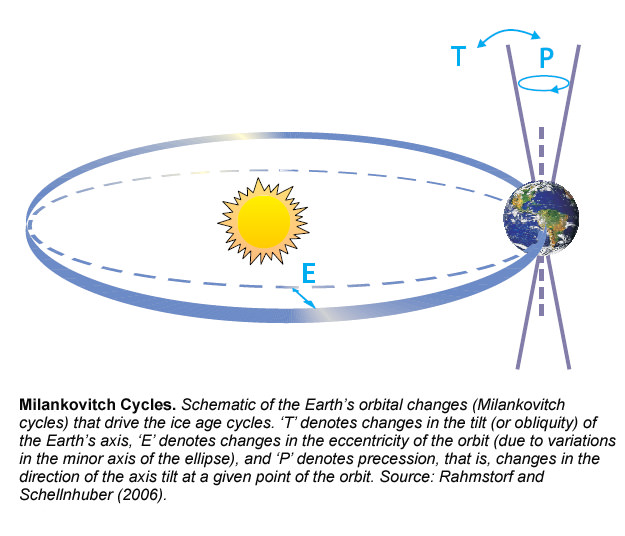
Back in 1920, Milutin Milankovitch, a Serbian mathematician, proposed that fine changes in Earth’s orbit around the Sun could explain an approximately 100,000 year cycle in glaciation seen from geological evidence. The tilt of the Earth’s axis swings slightly over a 41,000 year cycle – the eccentricity of Earth’s orbit moves from almost circular to more elliptical and back again over a 413,000 year cycle – and overlaying that you have not only the precession of the equinoxes, which is an inherent wobble in the Earth’s axial spin over a 26,000 year cycle, but also a precession of the whole of Earth’s orbit over a 23,000 year cycle.

Ice core data does show a rough concordance between glaciation and the synchronicity of these orbital cycles. Even though there’s no significant change in the mean amount of solar radiation reaching the Earth over the period of its annual orbit – the orbital changes can lead to increased polar shadowing and cooling.

Once ice does start advancing from the poles, a positive feedback loop can develop – since more ice increases the albedo of Earth’s surface and reflects more of the Sun’s heat back into space, thus reducing mean global temperatures.

ice coreIt’s thought that what limits the ice advancing is increasing CO2 in the atmosphere – which can be measured from trapped bubbles of air in the ice cores. More ice formation leads to less exposed land area for photosynthesis and silicate rock weathering to remove CO2 from the atmosphere. So the more ice that’s formed, the more CO2 accumulates in the atmosphere – which causes mean global temperatures to rise, which limits ongoing ice formation.

Of course the opposite is true in an ice-melting phase. Ice melting also follows a positive feedback loop since less ice means less albedo, meaning less solar radiation is reflected back into space and mean global temperatures rise. But again, CO2 becomes the limiting factor. With more exposed land, more CO2 is drawn from the atmosphere by photosynthesizing forests and rock weathering. A consequent drop in atmospheric CO2 cools the planet and hence limits ongoing ice melting.

But there lies the rub. We are in an ice-melting phase of the Milankovitch cycle now, where the Earth’s orbit is closer to circular and the Earth’s tilt is closer to perpendicular. But CO2 levels aren’t declining – partly because we’ve chopped a lot of trees and forests down, but mostly because of anthropogenic CO2 production. Without the limiting factor of declining CO2 we’ve seen in previous Milankovitch cycles, presumably the ice is just going to keep on melting as the albedo of the Earth surface declines.

Projected changes in coastlines with 170 metre sea level riseSo you might want to rethink that next coastal real estate purchase – or hope for the best from Copenhagen.