Clearly I need to learn to be more specific when I write these articles. Everything time I open my mouth, I need to prepare for the collective imagination of the viewers.
We did a whole article about the biggest things in the Universe, and identified superclusters of galaxies as the best candidate. Well, the part of superclusters actually gravitationally bound enough to eventually merge together in the future. But you had other ideas, including dark energy, or the Universe itself as the biggest thing. Even love? Aww.
One intriguing suggestion, though, is the idea of the vast cosmic voids between galaxies. Hmm, is the absence of something a thing? Whoa, time to go to art school and talk about negative space.
Ah well, who cares? It’s a super interesting topic, so let’s go ahead and talk about voids.
When most people imagine the expansion of the Universe after the Big Bang, they probably envision an equally spaced smattering of galaxies zipping away from one another. And that’s pretty accurate at the smallest scales.
Credit: NASA, ESA, and E. Hallman (University of Colorado, Boulder)
But at the largest scales, like when you can see billions of light-years in a cube that fits on your computer screen, then a larger structure starts to take shape.
It looks less like an explosion, and more like a tasty tasty sponge cake, with huge filaments, walls, and the vast gaps in between. The gaps, the voids, the supervoids, are the point of today’s article, but to understand the gaps, we’ve got to understand why the Universe is clumped up the way it is.
Run the Universe clock backwards, all the way to the beginning, to a fraction of a second after the Big Bang. When the entire cosmos was compressed down into a tiny region of superheated plasma.
Although it was mostly uniform in density, there were slight variations – quantum fluctuations in spacetime itself. And as the Universe expanded, those differences were magnified. What started out as tiny differences in the density of matter at the smallest scale, turned into regions of higher and lower density of matter in the Universe.
Here we are, 13.8 billion years after the Big Bang, and we can see how the microscopic variations at the beginning of time were magnified to the largest scales. Instead of individual galaxies, we see huge walls containing thousands of galaxies; filaments of galaxies connect in nodes. These structures are huge; hundreds of millions of light-years across, containing thousands of galaxies. But the gaps, the voids, between these clusters can be even larger.
Astronomers first started thinking about these voids back in the 1970s, when the first large-scale surveys of the Universe were made. By measuring the redshift of galaxies, and determining how fast they were speeding away from us, astronomers started to realize that the distribution of galaxies wasn’t even.
Red-shifted galaxies. Credit: ESO
Some galaxies were relatively close, but then there were huge gaps in distance, and then another cluster of galaxies collected together.
Over the last few decades, astronomers have built sophisticated 3-dimensional models that map out the Universe in the largest scales. The Sloan Digital Sky Survey, updated in 2009, has provided the most accurate map so far. The Large Synoptic Survey Telescope, destined for first light in a few years will take this to the next level.
The largest void that we currently know of is known as the Giant Void (original, I know), and it’s located about 1.5 billion light-year away. It has a diameter of 1 billion to 1.3 billion light-years across.
To be fair, these regions aren’t really completely empty. They just have less density than the regions with galaxies. In general, they’ve got about a tenth the density of matter that’s average for the Universe.
Galaxy MCG+01-02-015 is so isolated that if our galaxy, the Milky Way, were to be situated in the same way, we would not have known of the existence of other galaxies until the 1960s Credit: ESA/Hubble & NASA and N. Gorin (STScI). Acknowledgement: Judy Schmidt
Which means that there’s still gas and dust in these regions, as well as dark matter. There will still be stars and galaxies out in the middle of those voids. Even the Giant Void has 17 separate galaxy clusters inside it.
You might imagine continuing to scale outward. Maybe you’re wondering if the this spongy distribution of matter is actually just the next step to an even larger structure, and so on, and so on. But it isn’t. In fact, astronomers call this “the End of Greatness”, because it doesn’t seem like there’s any larger structure to the Universe.
As the expansion of the Universe continues, these voids are going to get even larger. The walls and filaments connecting clusters of galaxies will stretch and break. The voids will merge with each other, and only gravitationally bound galaxy clusters will remain as islands, adrift in the expanding emptiness.
The full scale of the observable Universe is truly mind boggling. We’re here in this tiny corner of the Local Group, which is part of the Virgo Supercluster, which is perched on the precipice of vast cosmic voids. So much to explore, so let’s get to work.
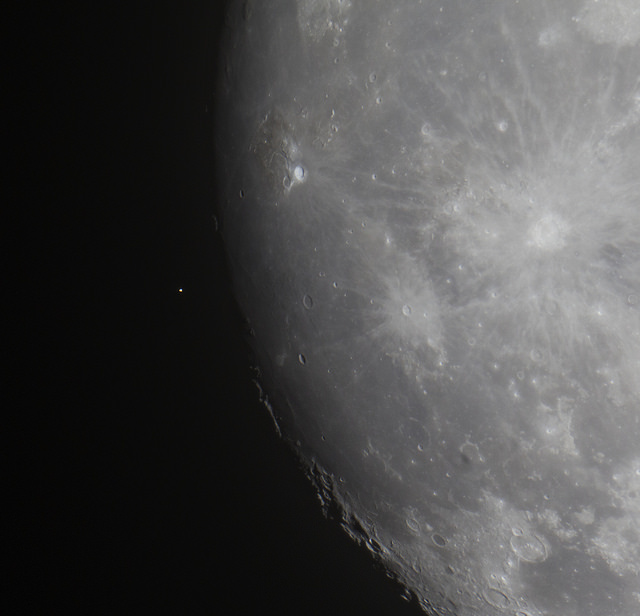
An occultation of Aldebaran by the Moon: before and after. Image credit and copyright: Eliot Herman.
How about that Hunter’s Supermoon this past weekend, huh? Follow that Moon, as it’s meeting up with the Hyades again this week, and occults (passes in front of) Aldebaran Tuesday night into Wednesday morning.
Here’s the lowdown on the event:
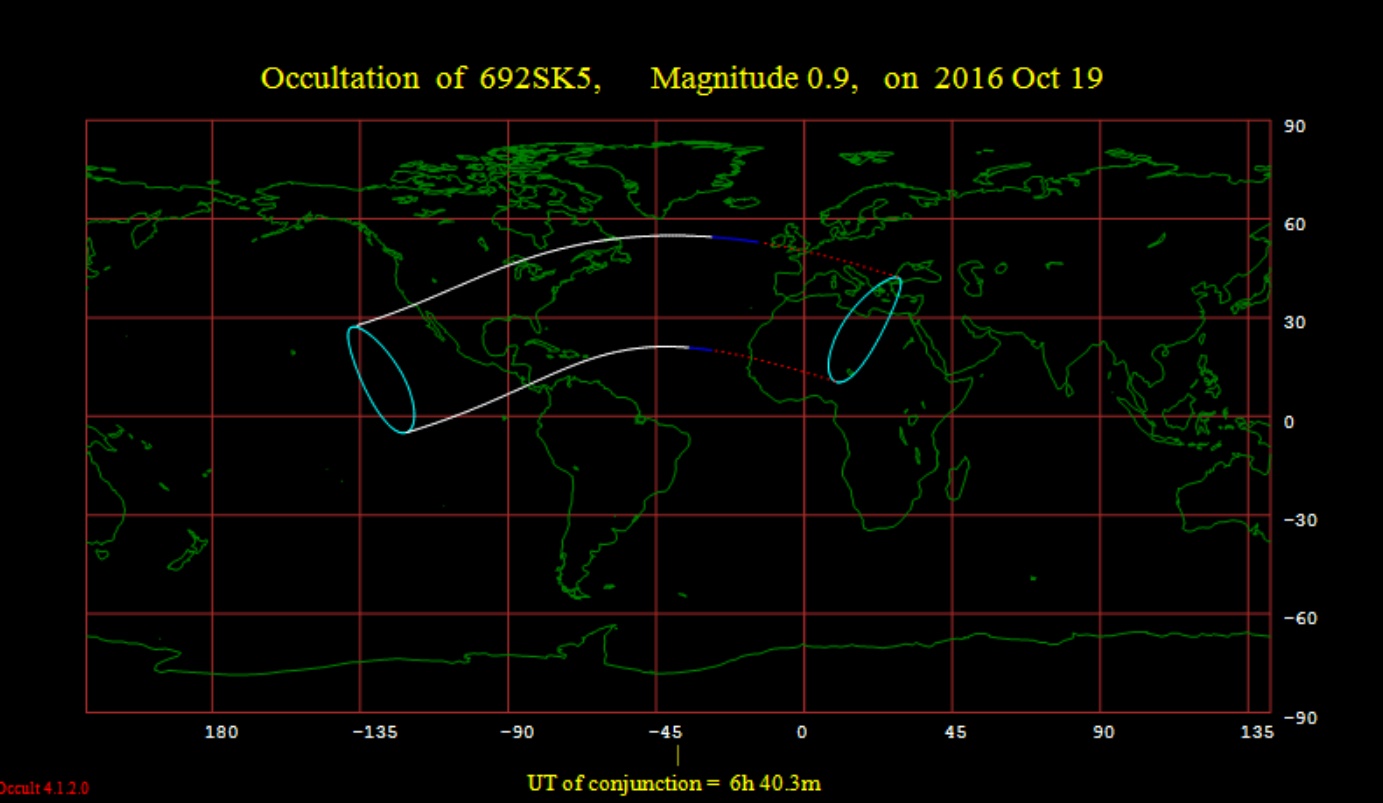
The 86% illuminated waning gibbous Moon occults the +0.9 magnitude star Aldebaran across North America, the Northern Atlantic and Europe. The Moon is three days past Full during the event. Both are located 136 degrees west of the Sun at the time of the event. The central time of conjunction is ~6:40 Universal Time (UT). The event occurs during the daylight hours over western Europe and northwestern Africa and under darkness for southeastern North America, including the eastern United States and Mexico. The Moon will next occult Aldebaran on November 15th, 2016. This is occultation 24 in the current series of 49 running from January 29th, 2015 to September 3rd 2018.
The occultation of Aldebaran by the Moon as seen from London on December 23rd, 2015. Image credit and copyright: Roger Hutchinson.
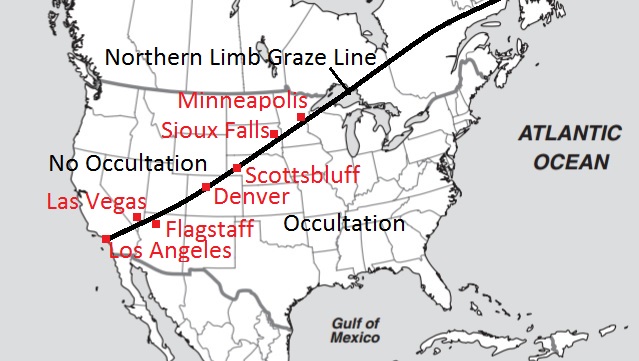
The graze line is of particular interest during this event. We’re talking about the very edge of the footprint of the Moon’s ‘shadow’ cast by Aldebaran, running through Canada and bisecting the United States. Observers based along this line could see a spectacular ‘grazing occultation’ of Aldebaran by the Moon. We usually think of the limb of the Moon as a smooth curve, but it’s actually jagged. What you may see is Aldebaran wink in and out as light shines down those lunar valleys and is alternately blocked out behind peaks and crater rims. This is an unforgettable sight, and makes for great video. A record of a grazing occultation by multiple observers can also be used to create a profile of the lunar limb. That light from Aldebaran took 65 years to get here, only to be blocked by our Moon at the very last second.
The occultation footprint for tonight’s event. The solid lines denote where the occultation occurs under dark nighttime skies, while the blue lines denote twilight, and the broken lines describe where the event occurs in the daytime. Image credit: Occult 4.2.
And observers (myself one of them) based in Europe shouldn’t count themselves out. Like brighter planets, you can spy a +1 magnitude star such as Aldebaran near the daytime Moon using binoculars or a telescope… if, of course, you have a high contrast deep blue sky and know exactly where to look for it. The International Occultation Timing Association has a page for the event with a complete list of ingress and egress times for key cities on three continents in the path. We’ll be watching the Wednesday event – clear skies willing — from our present basecamp in the Andalusian foothills just outside of Jimena de la Frontera, Spain.
The northern graze line for tonight’s occultation. Note that several major cities lie along the crucial path. Image credit: Dave Dickinson.
During our current epoch, the Moon can only occult four +1st magnitude stars: Regulus, Spica, Antares and Aldebaran. The slow motion movement of the Moon, the Earth and the background stars make this prestigious A-list change over time: until about two millennia ago, you could also count the bright star Pollux in Gemini among them.
In the current century, (2001-2100 AD) the Moon occults Aldebaran 247 times, topped only by Antares (386 times) and barely beating out Spica (220 times).
Timing an occultation is fun and as easy as shooting video of the Moon through a telescope at the appointed time of ingress or egress. Practice on framing the dazzling Moon first well in advance — probably the toughest part is getting the exposure of the bright limb stopped down enough to still see and image the star. We find that shooting anywhere from 1/100th to 1/500th frame rate for a gibbous Moon is about right. Don’t be afraid to crank up the magnification a bit, so you can place the bulk of the Moon out of view. Also, catching occultations of stars and planets during waning Moon phases are more challenging than waxing, as the star will ingress behind the bright leading limb and later reappear behind the dark trailing limb (waxing is vice versa).
Observing: Running an audible time hack in the background such as WWV radio out of Fort Collins, Colorado can provide a precise record of the occultation.
But wait, there’s more. When the Moon occults Aldebaran, its also crossing the background V-shaped open star cluster known as the Hyades. Worldwide the waning gibbous Moon also occults Gamma, 51, and Theta^1 and Theta^2, SAO 93975, and 119 Tauri. Chances are, there’s an occultation for YOU to catch this week, regardless of your location.
Want more? Well, the Moon continues to occult Aldebaran every lunation through 2017, and will also start a cycle of passes in front of Regulus on December 18th. In fact, the next occultation of Aldebaran on November 15th favors central Asia, and the event two lunations from now on December 13th brings the path back around the North America.
A great close out for 2016, for sure. Don’t miss this week’s occultation!
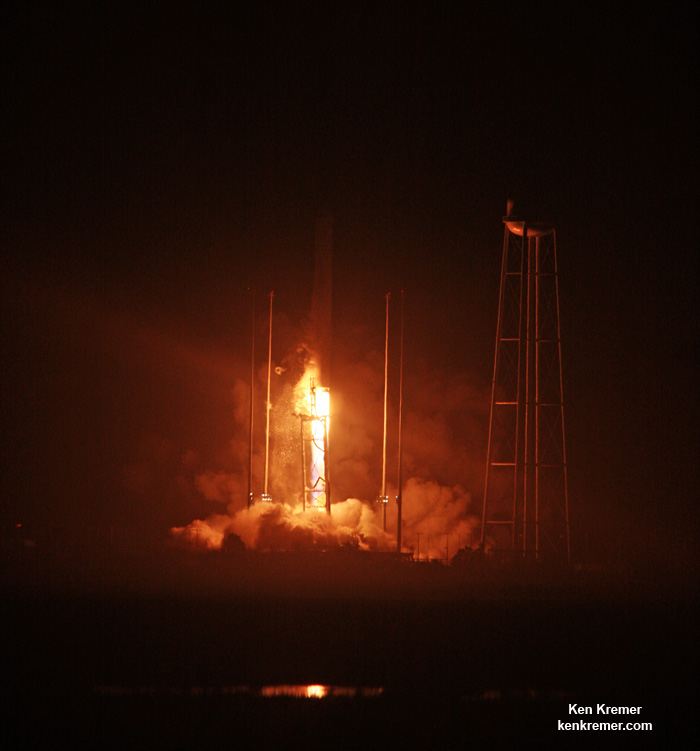
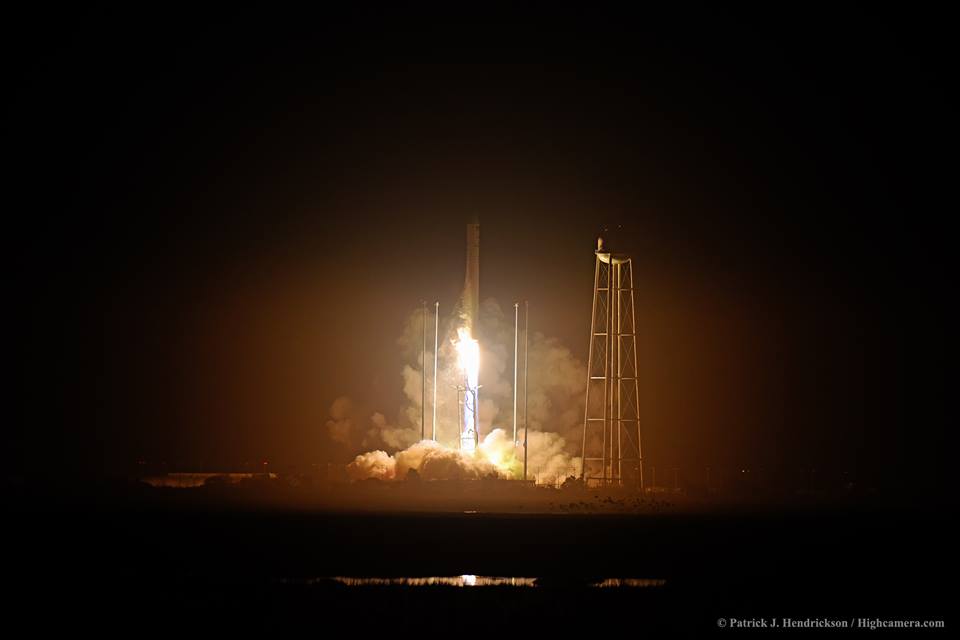
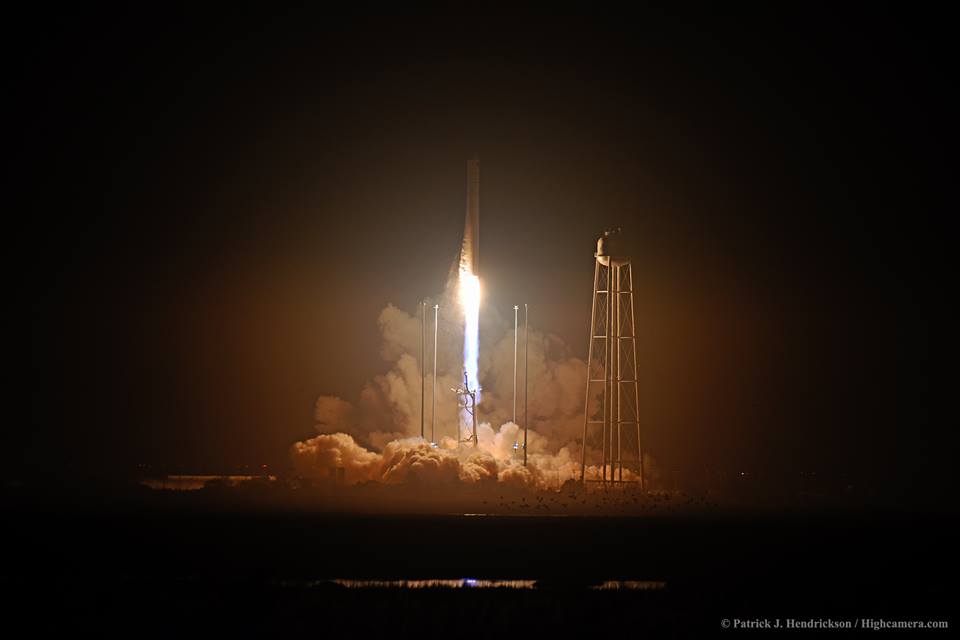
The Orbital ATK Antares rocket topped with the Cygnus cargo spacecraft launches from Pad-0A, Monday, Oct. 17, 2016 at NASA’s Wallops Flight Facility in Virginia. Orbital ATK’s sixth contracted cargo resupply mission with NASA to the International Space Station. Credit: Ken Kremer/kenkremer
The Orbital ATK Antares rocket topped with the Cygnus cargo spacecraft launches from Pad-0A, Monday, Oct. 17, 2016 at NASA’s Wallops Flight Facility in Virginia. Orbital ATK’s sixth contracted cargo resupply mission with NASA to the International Space Station. Credit: Ken Kremer/kenkremer
NASA WALLOPS FLIGHT FACILITY, VA – The ‘Return to Flight’ blastoff of Orbital ATK’s upgraded Antares rocket soared to a stellar success this evening, Oct. 17, on a space station bound mission to stock the orbiting outpost with two and a half tons of science and supplies.
The re-engined Orbital ATK Antares/Cygnus OA-5 mission lifted off at 7:45 p.m. EDT, tonight from the Mid-Atlantic Regional Spaceport pad 0A at NASA’s Wallops Flight Facility on Virginia’s picturesque Eastern shore spewing about 1.2 million pounds of liftoff thrust and brilliantly lighting up the evening skies in every direction.
Sporting a pair of more powerful new RD-181 engines, Antares roared off the launch pad somewhat more swiftly than the previous launches and consequently reached its preliminary orbit about one minute earlier.
Cygnus separated from the second stage as planned about 9 minutes after liftoff. The launch marked the first nighttime liftoff of Antares.
“It’s great to see launches to the International Space Station happening again from the Virginia coast – and it shows what can be accomplish with a close partnership of federal and state agencies, along with the U.S. industry, all working together,” said NASA Administrator Charles Bolden.
“I am incredibly proud of what you have all done,” said Bolden in post launch remarks to the launch team at Wallops Launch Control Center. “Thank you for all your hard work.”
This was the first Antares launch in two years following the rockets catastrophic failure just moments after liftoff on Oct. 28, 2014, which doomed the Orb-3 resupply mission to the space station – as witnessed by this author.
The weather was absolutely perfect at 100% GO by launch time and consequently was visible to millions of East Coast residents from the Carolinas to Maine as well as inland regions.
Visibility was aided by cloudless evening skies that afforded a spectacular long distance view of the engine firings for both the first and second stages, as the rocket accelerated to orbit in a southeastwardly direction before arcing over towards the African continent.
The power producing and life giving solar arrays were deployed and unfurled about two hours after liftoff, finished at about 9:40 p.m.
Cygnus is loaded with over 5,100 pounds of science investigations, food, supplies and hardware for the space station and its crew.
After Cygnus arrives at the ISS on Sunday, Oct. 23, Expedition 49 Flight Engineers Takuya Onishi of the Japan Aerospace Exploration Agency and Kate Rubins of NASA will grapple the spacecraft with the space station’s 57 foot long Canadian-built robotic arm. It will take hold of the Cygnus,
Ground controllers will then command the station’s arm to rotate and install it on the bottom of the station’s earth facing Unity module.
The Cygnus spacecraft will spend about five weeks attached to the space station. Cygnus will remain at the space station until November, when the spacecraft will depart the station and begin a fire experiment dubbed Saffire-II.
The 14 story tall commercial Antares rocket launched for the first time in the upgraded 230 configuration – powered by a pair of the new Russian-built RD-181 first stage engines.
For the OA-5 mission, the Cygnus advanced maneuvering spacecraft was loaded with approximately 2,425 kg (5,346 lb.) of supplies and science experiments for the International Space Station (ISS). The cargo was packed inside 56 cargo bags of multiple sizes.
The experiments will support dozens of new and existing investigations as the space station crews of Expeditions 49 and 50 contribute to about 250 science and research studies.
Among the science payloads aboard the Cygnus OA-5 mission is the Saffire II payload experiment to study combustion behavior in microgravity. Data from this exp,eriment will be downloaded via telemetry. In addition, a NanoRack deployer will release Spire Cubesats used for weather forecasting. These secondary payload operations will be conducted after Cygnus departs the space station.
Here is the Cygnus payload manifest:
Payloads:
• Spacecraft Fire Experiment-II (Saffire-II)
• Fast Neuron Spectrometer
• ACM and Experiment Tray
• SLMMD
Cargo:
• ISS Experiment Hardware
• EVA Equipment– EMU Repair Kit– EVA Supplies
• Emergency Equipment
• Photo/TV and Computer Resources– Computer – iPad Air 2
– Laptop – T61P and Connectors – Camera – Nikon D4
• ISS Hardware and Spare ORUs – Cupola Scratch Panes
– Water ORU
• Food, Crew Supplies and Crew Provisions
• Flight Crew Equipment
• Cargo Environment SensorsAdditional payload details can be found at www.nasa.gov/iss-science.
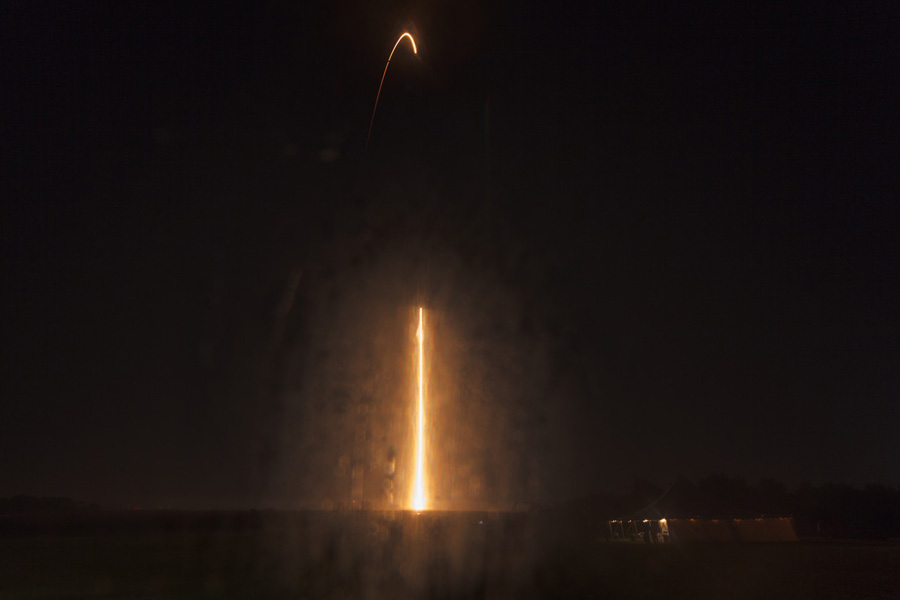
Streak shot of Orbital ATK Antares rocket carrying Cygnus supply ship soars to orbit on Oct. 17, 2016 from Pad-0A at NASA’s Wallops Flight Facility in Virginia. Credit: Ken Kremer/kenkremer
The Cygnus spacecraft for the OA-5 mission is named the S.S. Alan G. Poindexter in honor of former astronaut and Naval Aviator Captain Alan Poindexter.
Under the Commercial Resupply Services (CRS) contract with NASA, Orbital ATK will deliver approximately 28,700 kilograms of cargo to the space station. OA-5 is the sixth of these missions.
Watch for Ken’s continuing Antares/Cygnus mission and launch reporting. He is reporting from on site at NASA’s Wallops Flight Facility, VA during the launch campaign.
Stay tuned here for Ken’s continuing Earth and Planetary science and human spaceflight news.
Cygnus cargo spacecraft atop Orbital ATK Antares rocket on Pad-0A prior to blastoff on Oct. 17, 2016 from NASA’s Wallops Flight Facility in Virginia on Orbital ATK’s sixth contracted cargo resupply mission with NASA to the International Space Station. Credit: Ken Kremer/kenkremer
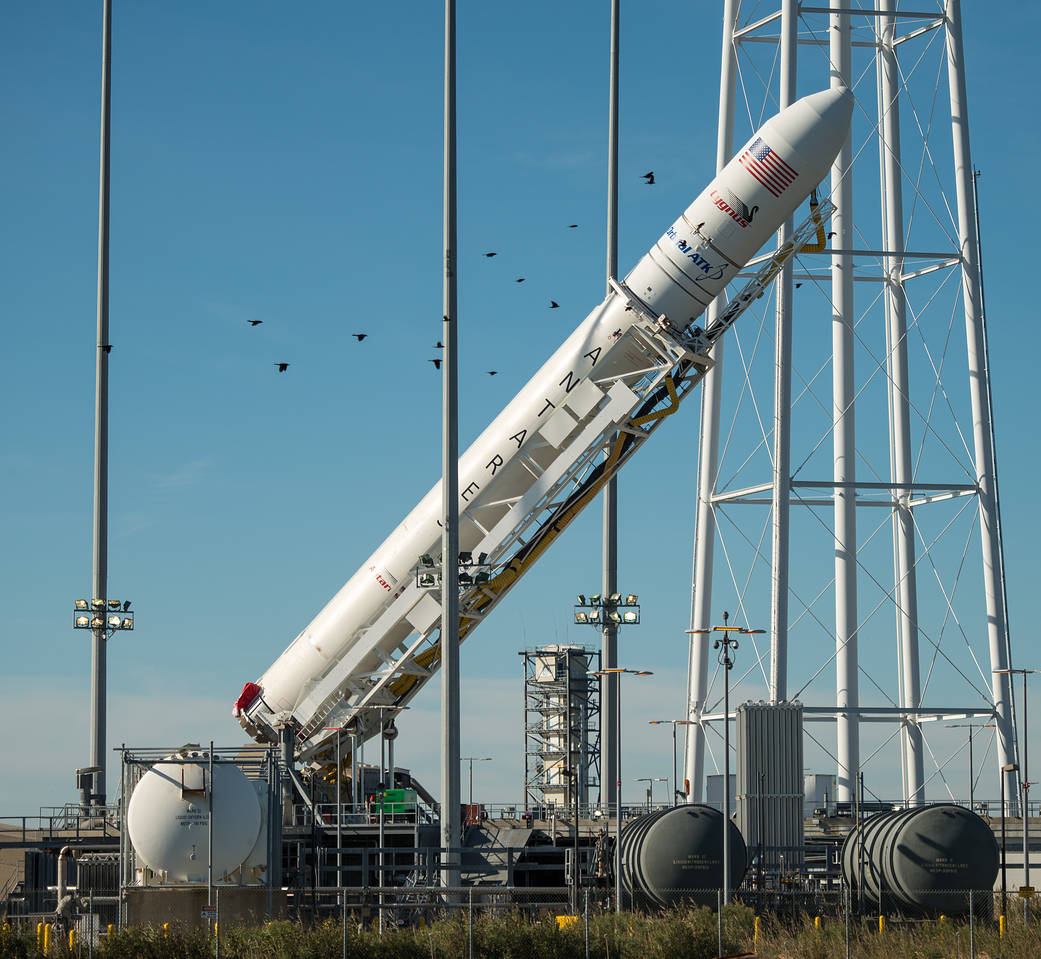
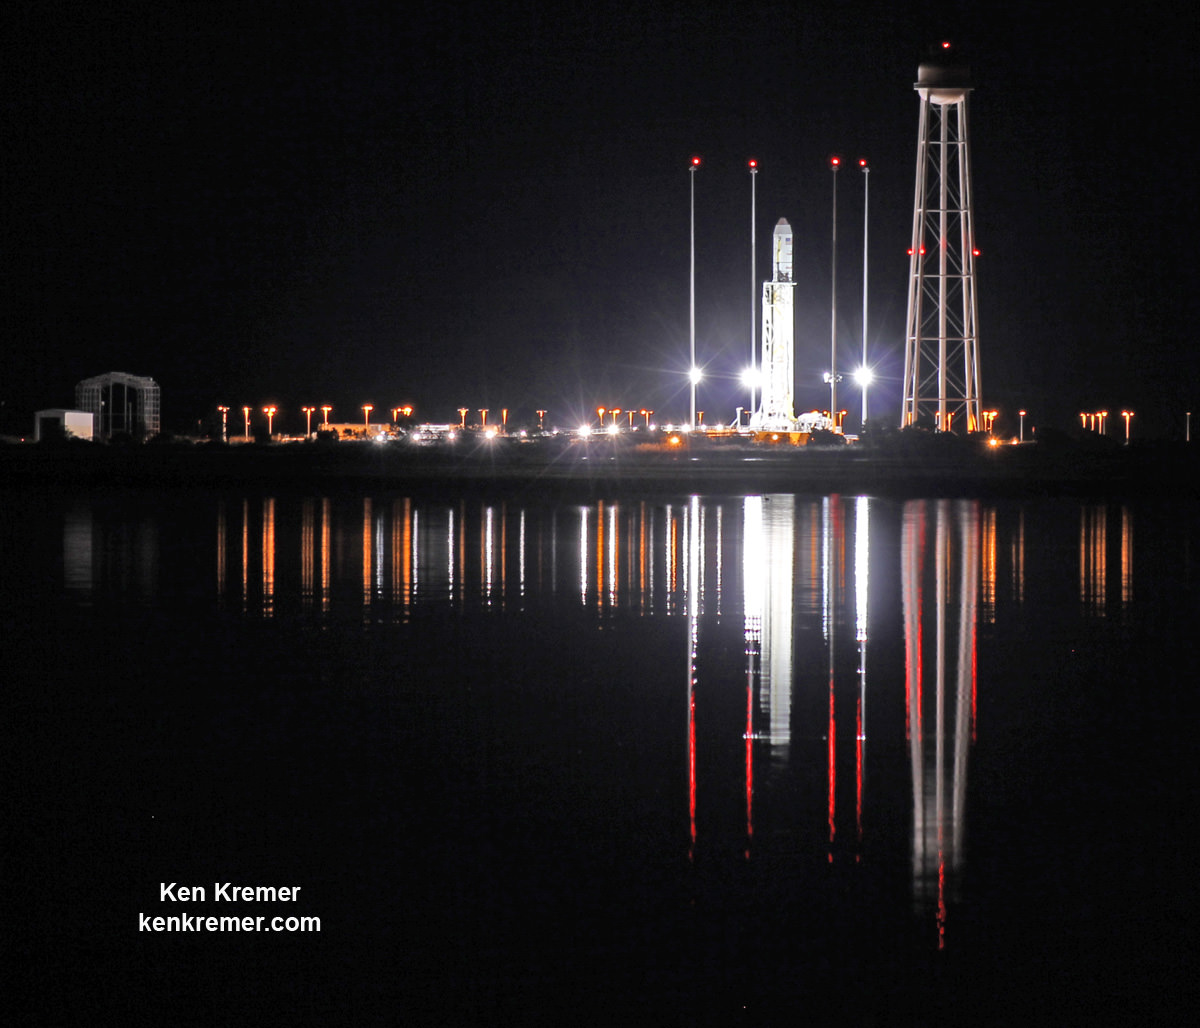
The Orbital ATK Antares rocket, with the Cygnus OA-5 spacecraft onboard, is raised into the vertical position on launch Pad-0A for planned launch on Oct. 17, 2016, at NASA’s Wallops Flight Facility in Virginia. Credit: Ken Kremer/kenkremer2 Moons and Antares on the launch pad on the evening of Oct. 15, 2016 at NASA’s Wallops Flight Facility in Virginia in this water reflection shot. Liftoff of the OA-5 mission to the ISS is planned for Oct. 17, 2016. Credit: Ken Kremer/kenkremer
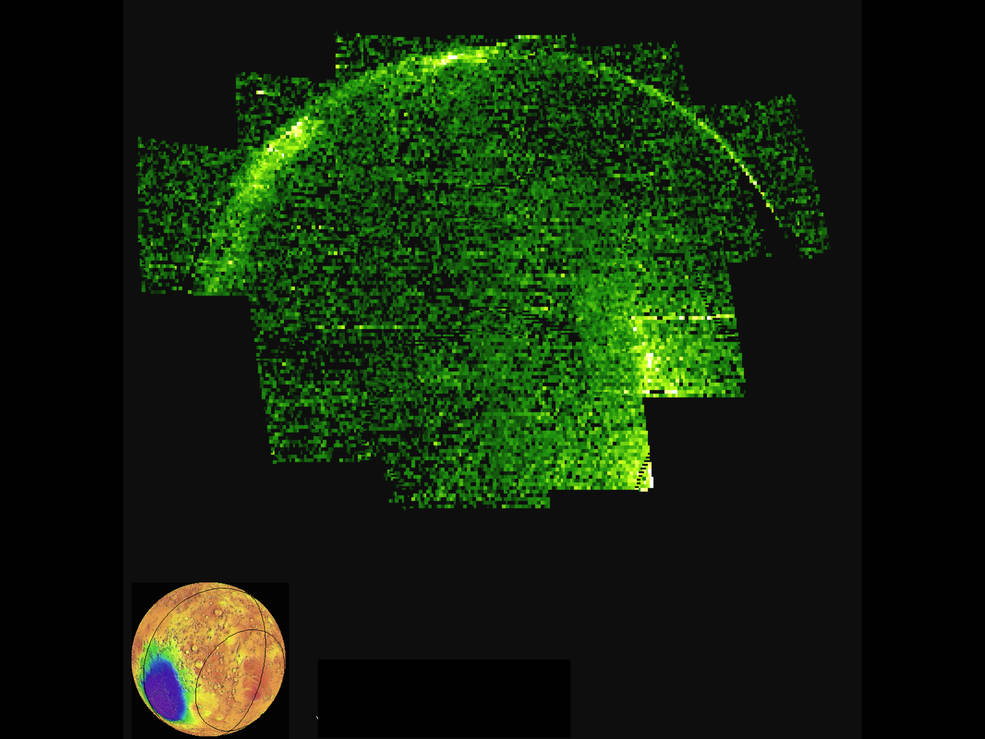
This image of the Mars night side shows ultraviolet emission from nitric oxide. These emissions track the recombination of atomic nitrogen and oxygen produced on the dayside, and reveal the circulation patterns of the atmosphere. MAVEN's Imaging UltraViolet Spectrograph obtained this image of Mars on May 4, 2016 during late winter in Mars Southern Hemisphere.
Credits: NASA/MAVEN/University of Colorado
Mars’ atmosphere is about 100 times thinner than Earth’s, but there’s still a lot going on in that wispy, carbon dioxide Martian air. The MAVEN spacecraft recently took some exceptional images of Mars using its Imaging UltraViolet Spectrograph (IUVS), revealing dynamic and previously invisible subtleties.
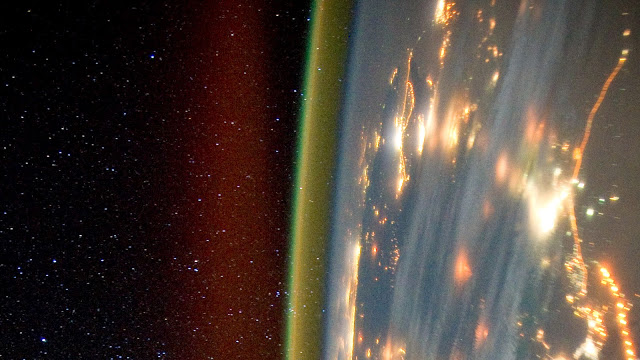
MAVEN took the first-ever images of nightglow on Mars. You may have seen nightglow in images of Earth taken by astronauts on the International Space Station as a dim greenish light surrounding the planet. Nightglow is produced when oxygen and nitrogen atoms collide to form nitric oxide. This is ionized by ultraviolet light from the Sun during the day, and as it travels around to the nightside of the planet, it will glow in ultraviolet.
An image of nightglow in Earth’s atmosphere, taken from the International Space Station. Credit: NASA.
“The planet will glow as a result of this chemical reaction,” said Nick Schneider, from the Laboratory for Atmospheric and Space Physics at the University of Colorado, Boulder, speaking today at the American Astronomical Society Division for Planetary Sciences meeting. “This is a common planetary reaction that tells us about the transport of these ingredients and around the planet and show how winds circulate at high altitudes.”
MAVEN’s images show evidence of strong irregularities in Mars’ high altitude winds and circulation patterns and Schneider said these first images will lead to an improved understanding of the circulation patterns that control the behavior of the atmosphere from approximately 37 to 62 miles (about 60 to 100 kilometers) high.
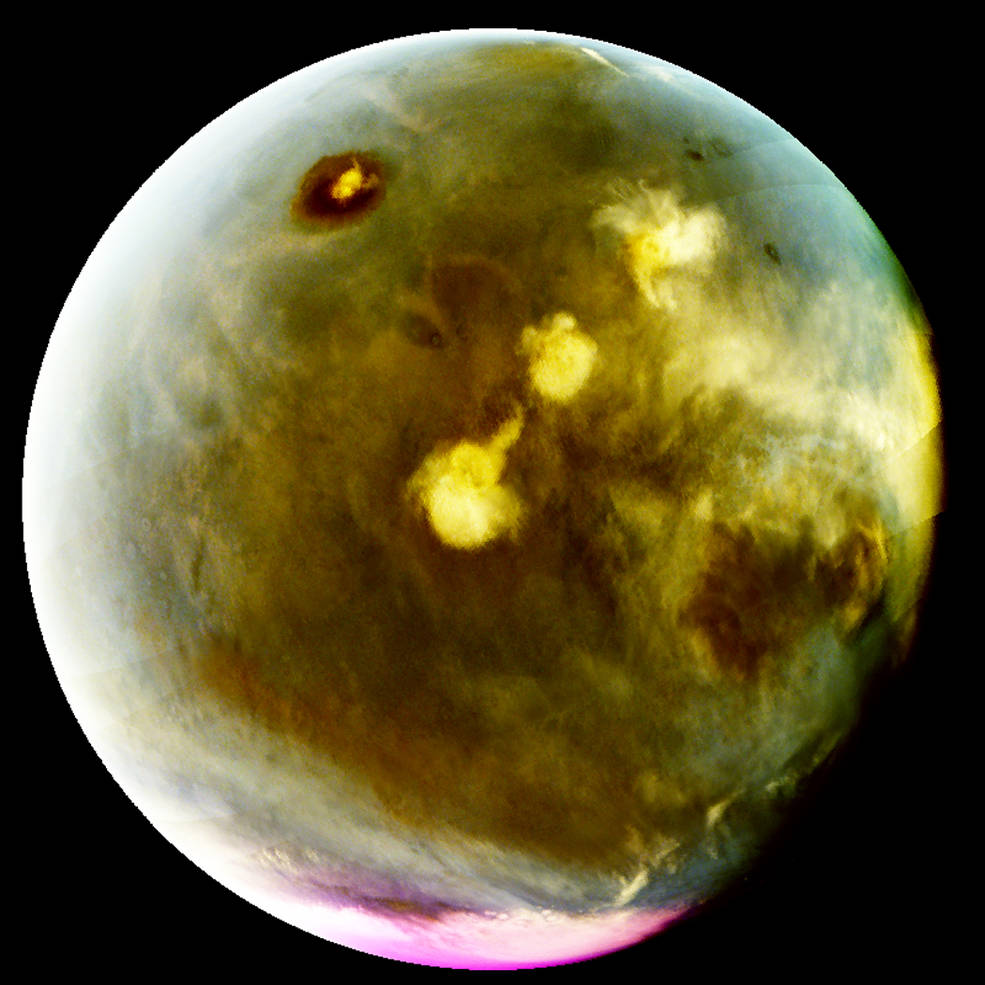
MAVEN’s Imaging UltraViolet Spectrograph obtained these images of rapid cloud formation on Mars on July 9-10, 2016. Mars’ prominent volcanoes, topped with white clouds, can be seen moving across the disk and show how rapidly and extensively the clouds topping the volcanoes form in the afternoon. Credits: NASA/MAVEN/University of Colorado
MAVEN’s ultraviolet images also provide insight into cloud formation and ozone in Mars atmosphere.
The images show how water ice clouds form, especially in the afternoon, over the four giant volcanoes on Mars in the Tharsis region. Cloud formation in the afternoon is a common occurrence on Earth, as convection causes water vapor to rise.
“Water ice clouds are very common on Mars and they can tell us about water inventory on the planet,” Schneider said. “In these images you can see an incredible expansion of the clouds over the course of seven hours, forming a cloud bank that must be a thousand miles across.”
He added that this is just the kind of info scientists want to be plugging in to their circulation models to study circulation and the chemistry of Mars’ atmosphere. “This is helping us advance our understanding in these areas, and we’ll be able to study it with MAVEN through full range of Mars’ seasons.”
MAVEN’s Imaging UltraViolet Spectrograph obtained images of rapid cloud formation on Mars on July 9-10, 2016. The ultraviolet colors of the planet have been rendered in false color, to show what we would see with ultraviolet-sensitive eyes. Mars’ tallest volcano, Olympus Mons, appears as a prominent dark region near the top of the image, with a small white cloud at the summit that grows during the day. Three more volcanoes appear in a diagonal row, with their cloud cover (white areas near center) merging to span up to a thousand miles by the end of the day. Credits: NASA/MAVEN/University of Colorado
Schneider explained that MAVEN’s unique orbit allows it to get views of the planet that other orbiters don’t have. One part of its elliptical orbit takes it high above the planet that allows for global views, but it still orbits fast enough to get multiple views as Mars rotates over the course of a day.
“We get to see daily events evolve over time because we return to that orbit every few hours,” he said.
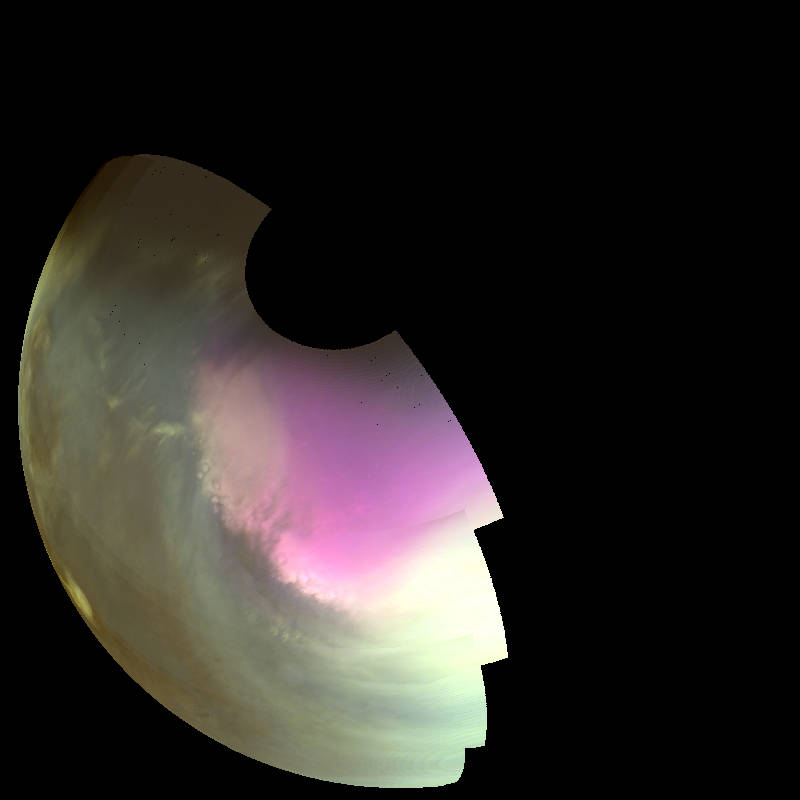
This ultraviolet image near Mars’ South Pole was taken by MAVEN on July 10 2016 and shows the atmosphere and surface during southern spring. The white region centered on the pole is frozen carbon dioxide (dry ice) on the surface. Pockets of ice are left inside craters as the polar cap recedes in the spring, giving its edge a rough appearance. High concentrations of atmospheric ozone appear magenta in color, and the wavy edge of the enhanced ozone region highlights wind patterns around the pole. Credits: NASA/MAVEN/University of Colorado
In addition, dayside ultraviolet imagery from the spacecraft shows how ozone amounts change over the seasons. Ozone is destroyed when water vapor is present, so ozone accumulates in the winter polar region where the water vapor has frozen out of the atmosphere. The images show ozone lasting into spring, indicating that global winds are constraining the spread of water vapor from the rest of the planet into winter polar regions.
Wave patterns in the ozone images show wind pattern, as well, helping scientists to study the chemistry and global circulation of Mars’ atmosphere.
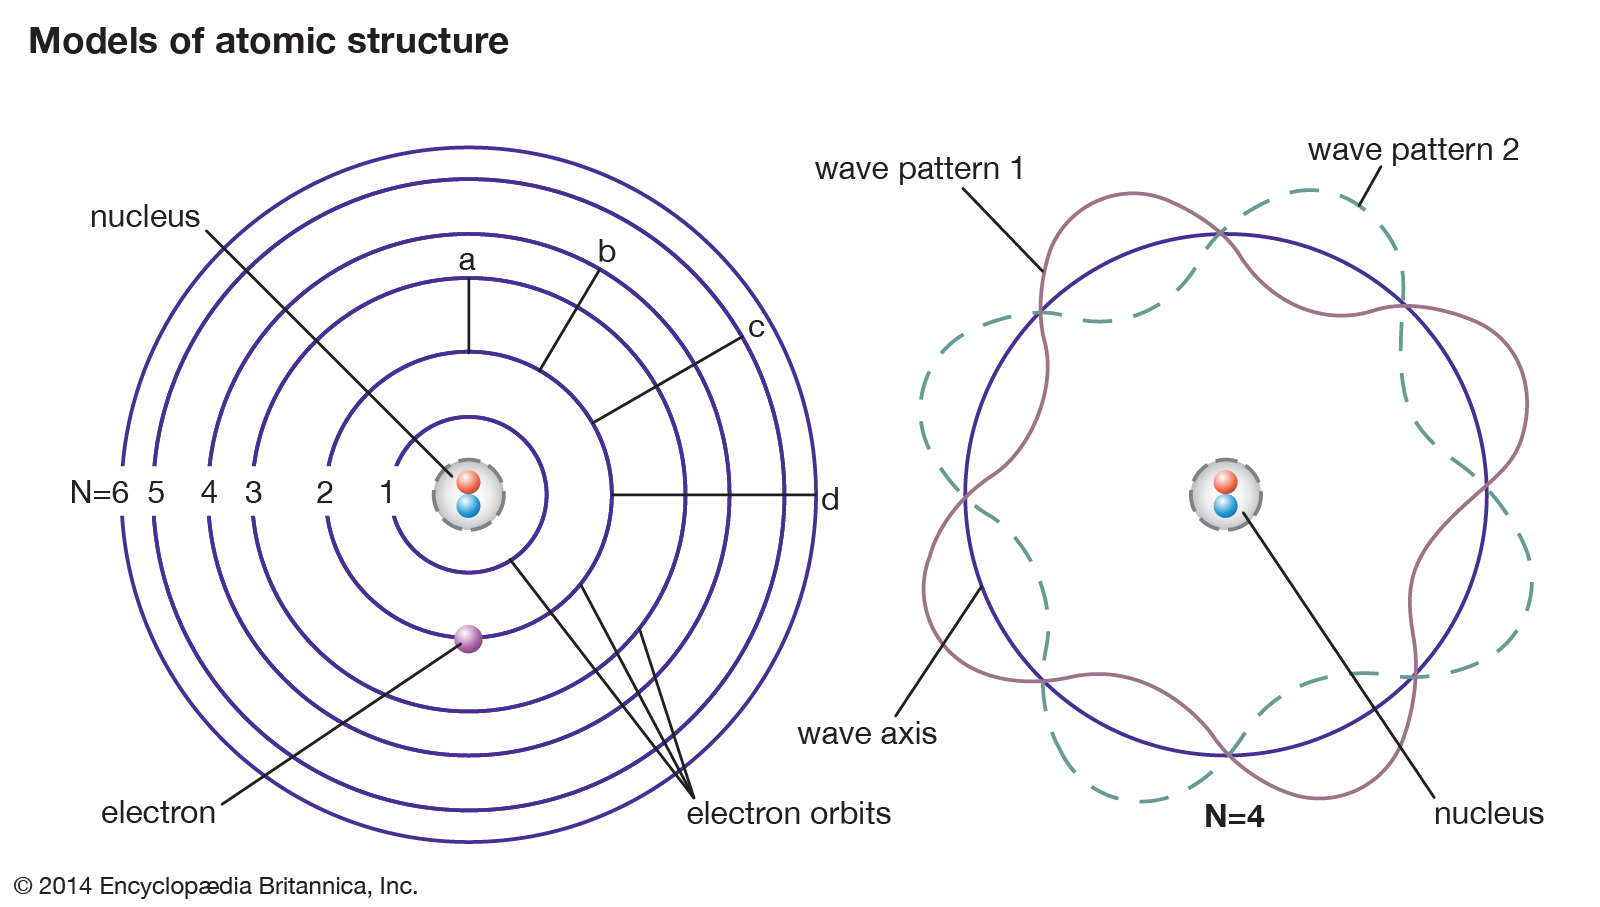
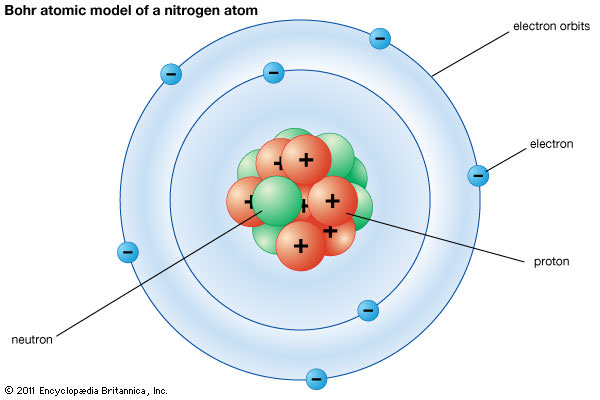
The atomic structure. Credit: Encyclopædia Britannica, Inc.
Have you ever taken a look at a piece of firewood and said to yourself, “gee, I wonder how much energy it would take to split that thing apart”? Chances are, no you haven’t, few people do. But for physicists, asking how much energy is needed to separate something into its component pieces is actually a pretty important question.
In the field of physics, this is what is known as binding energy, or the amount of mechanical energy it would take to disassemble an atom into its separate parts. This concept is used by scientists on many different levels, which includes the atomic level, the nuclear level, and in astrophysics and chemistry.
Nuclear Force:
As anyone who remembers their basic chemistry or physics surely knows, atoms are composed of subatomic particles known as nucleons. These consist of positively-charged particles (protons) and neutral particles (neutrons) that are arranged in the center (in the nucleus). These are surrounded by electrons which orbit the nucleus and are arranged in different energy levels.
Neils Bohr’s model a nitrogen atom. Credit: britannica.com
The reason why subatomic particles that have fundamentally different charges are able to exist so close together is because of the presence of Strong Nuclear Force – a fundamental force of the universe that allows subatomic particles to be attracted at short distances. It is this force that counteracts the repulsive force (known as the Coulomb Force) that causes particles to repel each other.
Therefore, any attempt to divide the nucleus into the same number of free unbound neutrons and protons – so that they are far/distant enough from each other that the strong nuclear force can no longer cause the particles to interact – will require enough energy to break these nuclear bonds.
Thus, binding energy is not only the amount of energy required to break strong nuclear force bonds, it is also a measure of the strength of the bonds holding the nucleons together.
Nuclear Fission and Fusion:
In order to separate nucleons, energy must be supplied to the nucleus, which is usually accomplished by bombarding the nucleus with high energy particles. In the case of bombarding heavy atomic nuclei (like uranium or plutonium atoms) with protons, this is known as nuclear fission.
Nuclear fission, where an atom of Uranium 96 is split by a free neutron to produce barium and krypton. Credit: physics.stackexchange.com
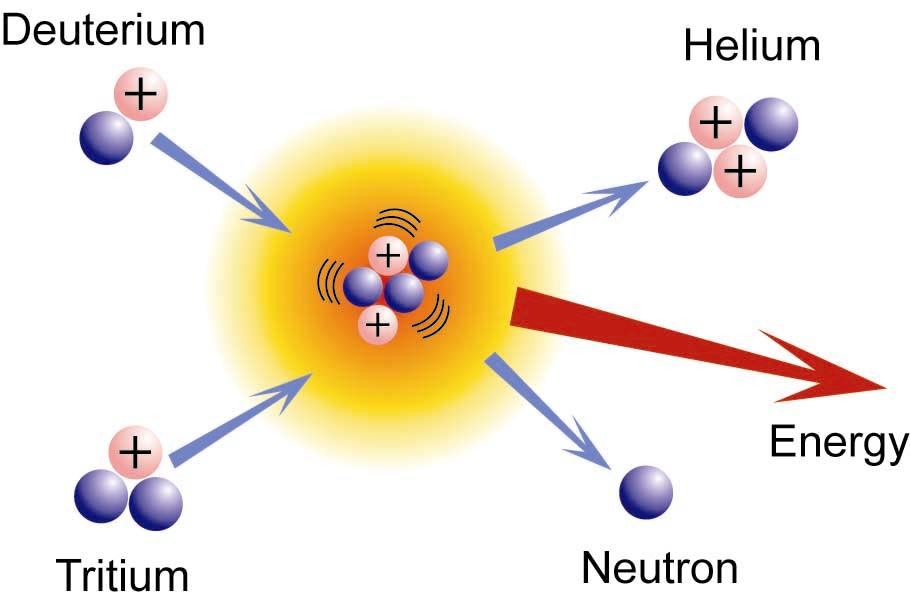
However, binding energy also plays a role in nuclear fusion, where light nuclei together (such as hydrogen atoms), are bound together under high energy states. If the binding energy for the products is higher when light nuclei fuse, or when heavy nuclei split, either of these processes will result in a release of the “extra” binding energy. This energy is referred to as nuclear energy, or loosely as nuclear power.
It is observed that the mass of any nucleus is always less than the sum of the masses of the individual constituent nucleons which make it up. The “loss” of mass which results when nucleons are split to form smaller nucleus, or merge to form a larger nucleus, is also attributed to a binding energy. This missing mass may be lost during the process in the form of heat or light.
Once the system cools to normal temperatures and returns to ground states in terms of energy levels, there is less mass remaining in the system. In that case, the removed heat represents exactly the mass “deficit”, and the heat itself retains the mass which was lost (from the point of view of the initial system). This mass appears in any other system which absorbs the heat and gains thermal energy.
Types of Binding Energy:
Strictly speaking, there are several different types of binding energy, which is based on the particular field of study. When it comes to particle physics, binding energy refers to the energy an atom derives from electromagnetic interaction, and is also the amount of energy required to disassemble an atom into free nucleons.
Diagram showing the process of nuclear fusion. Credit: Lancaster University
In the case of removing electrons from an atom, a molecule, or an ion, the energy required is known as “electron binding energy” (aka. ionization potential). In general, the binding energy of a single proton or neutron in a nucleus is approximately a million times greater than the binding energy of a single electron in an atom.
In astrophysics, scientists employ the term “gravitational binding energy” to refer to the amount of energy it would take to pull apart (to infinity) an object held together by gravity alone – i.e. any stellar object like a star, a planet, or a comet. It also refers to the amount of energy that is liberated (usually in the form of heat) during the accretion of such an object from material falling from infinity.
Finally, there is what is known as “bond” energy, which is a measure of the bond strength in chemical bonds, and is also the amount of energy (heat) it would take to break a chemical compound down into its constituent atoms. Basically, binding energy is the very thing that binds our Universe together. And when various parts of it are broken apart, it is the amount of energy needed to carry it out.
The study of binding energy has numerous applications, not the least of which are nuclear power, electricity, and chemical manufacture. And in the coming years and decades, it will be intrinsic in the development of nuclear fusion!
The Orbital ATK Antares rocket, with the Cygnus OA-5 spacecraft onboard, is raised into the vertical position on launch Pad-0A for planned launch on Oct. 17, 2016, at NASA's Wallops Flight Facility in Virginia. Credit: Ken Kremer/kenkremer
The Orbital ATK Antares rocket, with the Cygnus OA-5 spacecraft onboard, is raised into the vertical position on launch Pad-0A for planned launch on Oct. 17, 2016, at NASA’s Wallops Flight Facility in Virginia. Credit: Ken Kremer/kenkremer
NASA WALLOPS FLIGHT FACILITY, VA – The ‘Return to Flight’ blastoff of Orbital ATK’s upgraded Antares rocket will have to wait one more day to come to fruition with a magnificent Monday night launch – after a technical scrub was called this afternoon, Oct. 16, at NASA’s Virginia launch base due to a faulty cable.
The launch potentially offers a thrilling skyshow to millions of US East Coast spectators if all goes well.
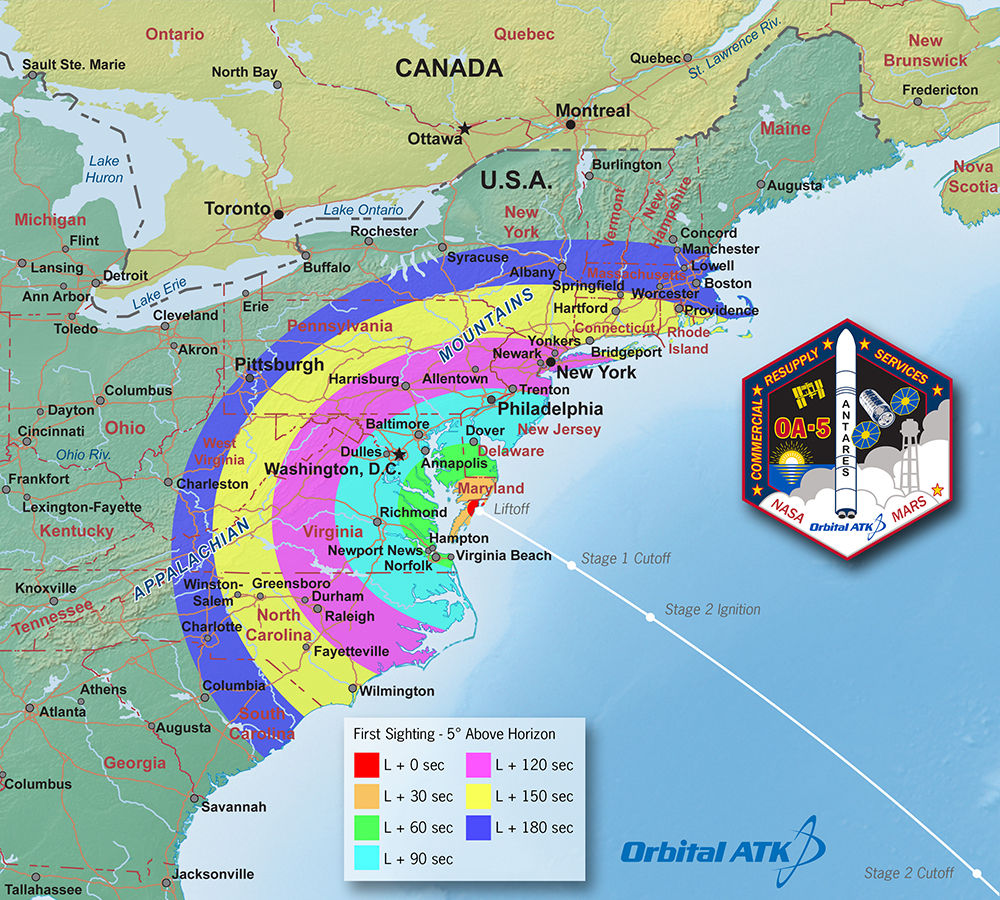
Antares Launch Viewing Map. This “first-sight” map indicates potential to see Orbital ATK’s Antares rocket in the minutes following its launch on the OA-5 mission to the ISS on October 16, 2016. Credit: Orbital ATK
Despite picture perfect Fall weather, technical gremlins intervened to halt Sunday nights planned commercial cargo mission for NASA carrying 2.5 tons of science and supplies bound for the International Space Station (ISS).
The launch of the Orbital ATK CRS-5 mission is now scheduled for October 17 at 7:40 p.m. EDT, from the Mid-Atlantic Regional Spaceport pad 0A at NASA’s Wallops Flight Facility on Virginia’s picturesque Eastern shore.
You can watch the launch live on NASA TV as well as the agency’s website beginning at 6:30 p.m. EDT Oct 17.
Mondays liftoff is slated to take place approximately 23 minutes earlier then Sunday’s hoped for time of 8:03 p.m. EDT in order to match the moment when the orbital plane of the station passes on NASA Wallops.
The weather outlook on Monday remains extremely favorable with a 95 percent chance of acceptable conditions at launch time.
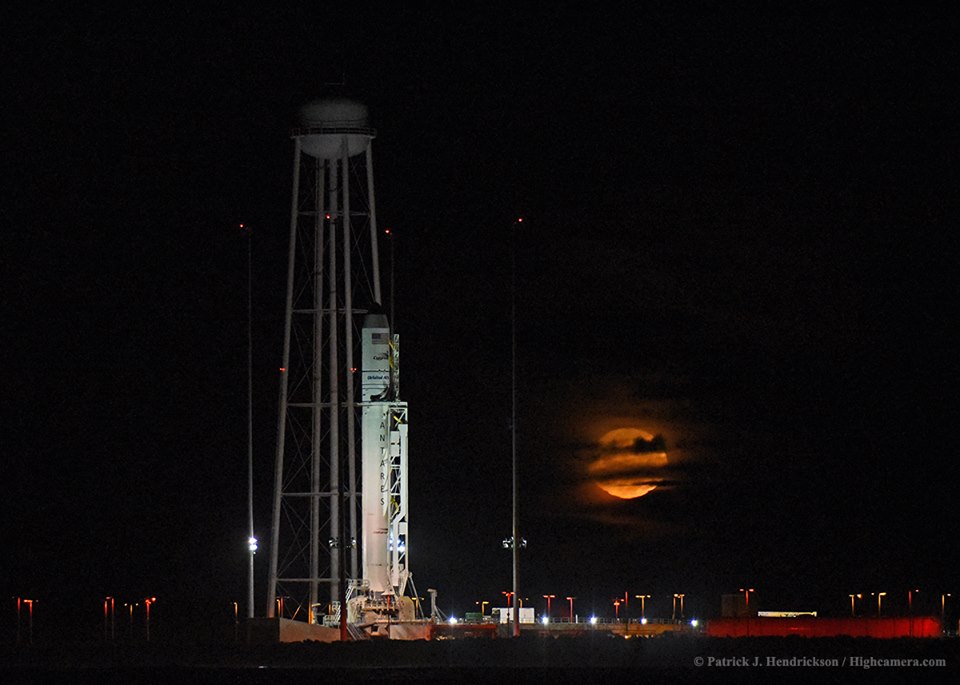
A nearly full moon has risen over Antares the past few days at the launch pad.
2 Moons and Antares on the launch pad on the evening of Oct. 15, 2016 at NASA’s Wallops Flight Facility in Virginia in this water reflection shot. Liftoff of the OA-5 mission to the ISS is planned for Oct. 17, 2016. Credit: Ken Kremer/kenkremer
Announcement of the launch scrub of the mission – also known as OA-5 – came just as the six hour countdown was set to begin after engineers discovered the bad cable.
“Today’s launch of Orbital ATK’s Antares rocket is postponed 24 hours due to a ground support equipment (GSE) cable that did not perform as expected during the pre-launch check out,” officials at NASA Wallops said.
The faulty cable was a component of the rocket’s hold down system at the pad, Orbital ATK officials told Universe Today after the scrub was announced.
Technicians have spares on hand and are working now to replace the cable in time to permit a Monday evening launch.
“We have spares on hand and rework procedures are in process. The Antares and Cygnus teams are not currently working any technical issues with the rocket or the spacecraft.”
Besides the cable the rocket is apparently in perfect shape.
“The Antares and Cygnus teams are not currently working any technical issues with the rocket or the spacecraft.”
Antares launches have been on hold for two years after it was grounded following its catastrophic failure just moments after liftoff on Oct. 28, 2014 that doomed the Orb-3 resupply mission to the space station – as witnessed by this author.
Orbital ATK’s Antares commercial rocket had to be overhauled with the completely new RD-181 first stage engines- fueled by LOX/kerosene – following the destruction of the Antares rocket and Cygnus supply ship two years ago.
The 14 story tall commercial Antares rocket also will launch for the first time in the upgraded 230 configuration – powered by new Russian-built first stage engines designed and manufactured by Energomesh.
The 133-foot-tall (40-meter) Antares was rolled out to pad 0A on Thursday, Oct. 13 – three days prior to Sunday’s intended launch date. It was raised to the vertical launch position on Friday.
The Orbital ATK Antares rocket, with the Cygnus OA-5 spacecraft onboard, is raised into the vertical position on launch Pad-0A for planned launch on Oct. 17, 2016, at NASA’s Wallops Flight Facility in Virginia. Credit: Ken Kremer/kenkremer
The two stage Antares will carry the Orbital OA-5 Cygnus cargo freighter to orbit on a flight bound for the ISS and its multinational crew of astronauts and cosmonauts.
The launch marks the first nighttime liftoff of the Antares – and it could be visible up and down the eastern seaboard if weather and atmospheric conditions cooperate to provide a spectacular viewing opportunity to the most populated region in North America.
The Cygnus spacecraft for the OA-5 mission is named the S.S. Alan G. Poindexter in honor of former astronaut and Naval Aviator Captain Alan Poindexter.
Under the Commercial Resupply Services (CRS) contract with NASA, Orbital ATK will deliver approximately 28,700 kilograms of cargo to the space station. OA-5 is the sixth of these missions.
Watch for Ken’s continuing Antares/Cygnus mission and launch reporting. He will be reporting from on site at NASA’s Wallops Flight Facility, VA during the launch campaign.
Stay tuned here for Ken’s continuing Earth and Planetary science and human spaceflight news.
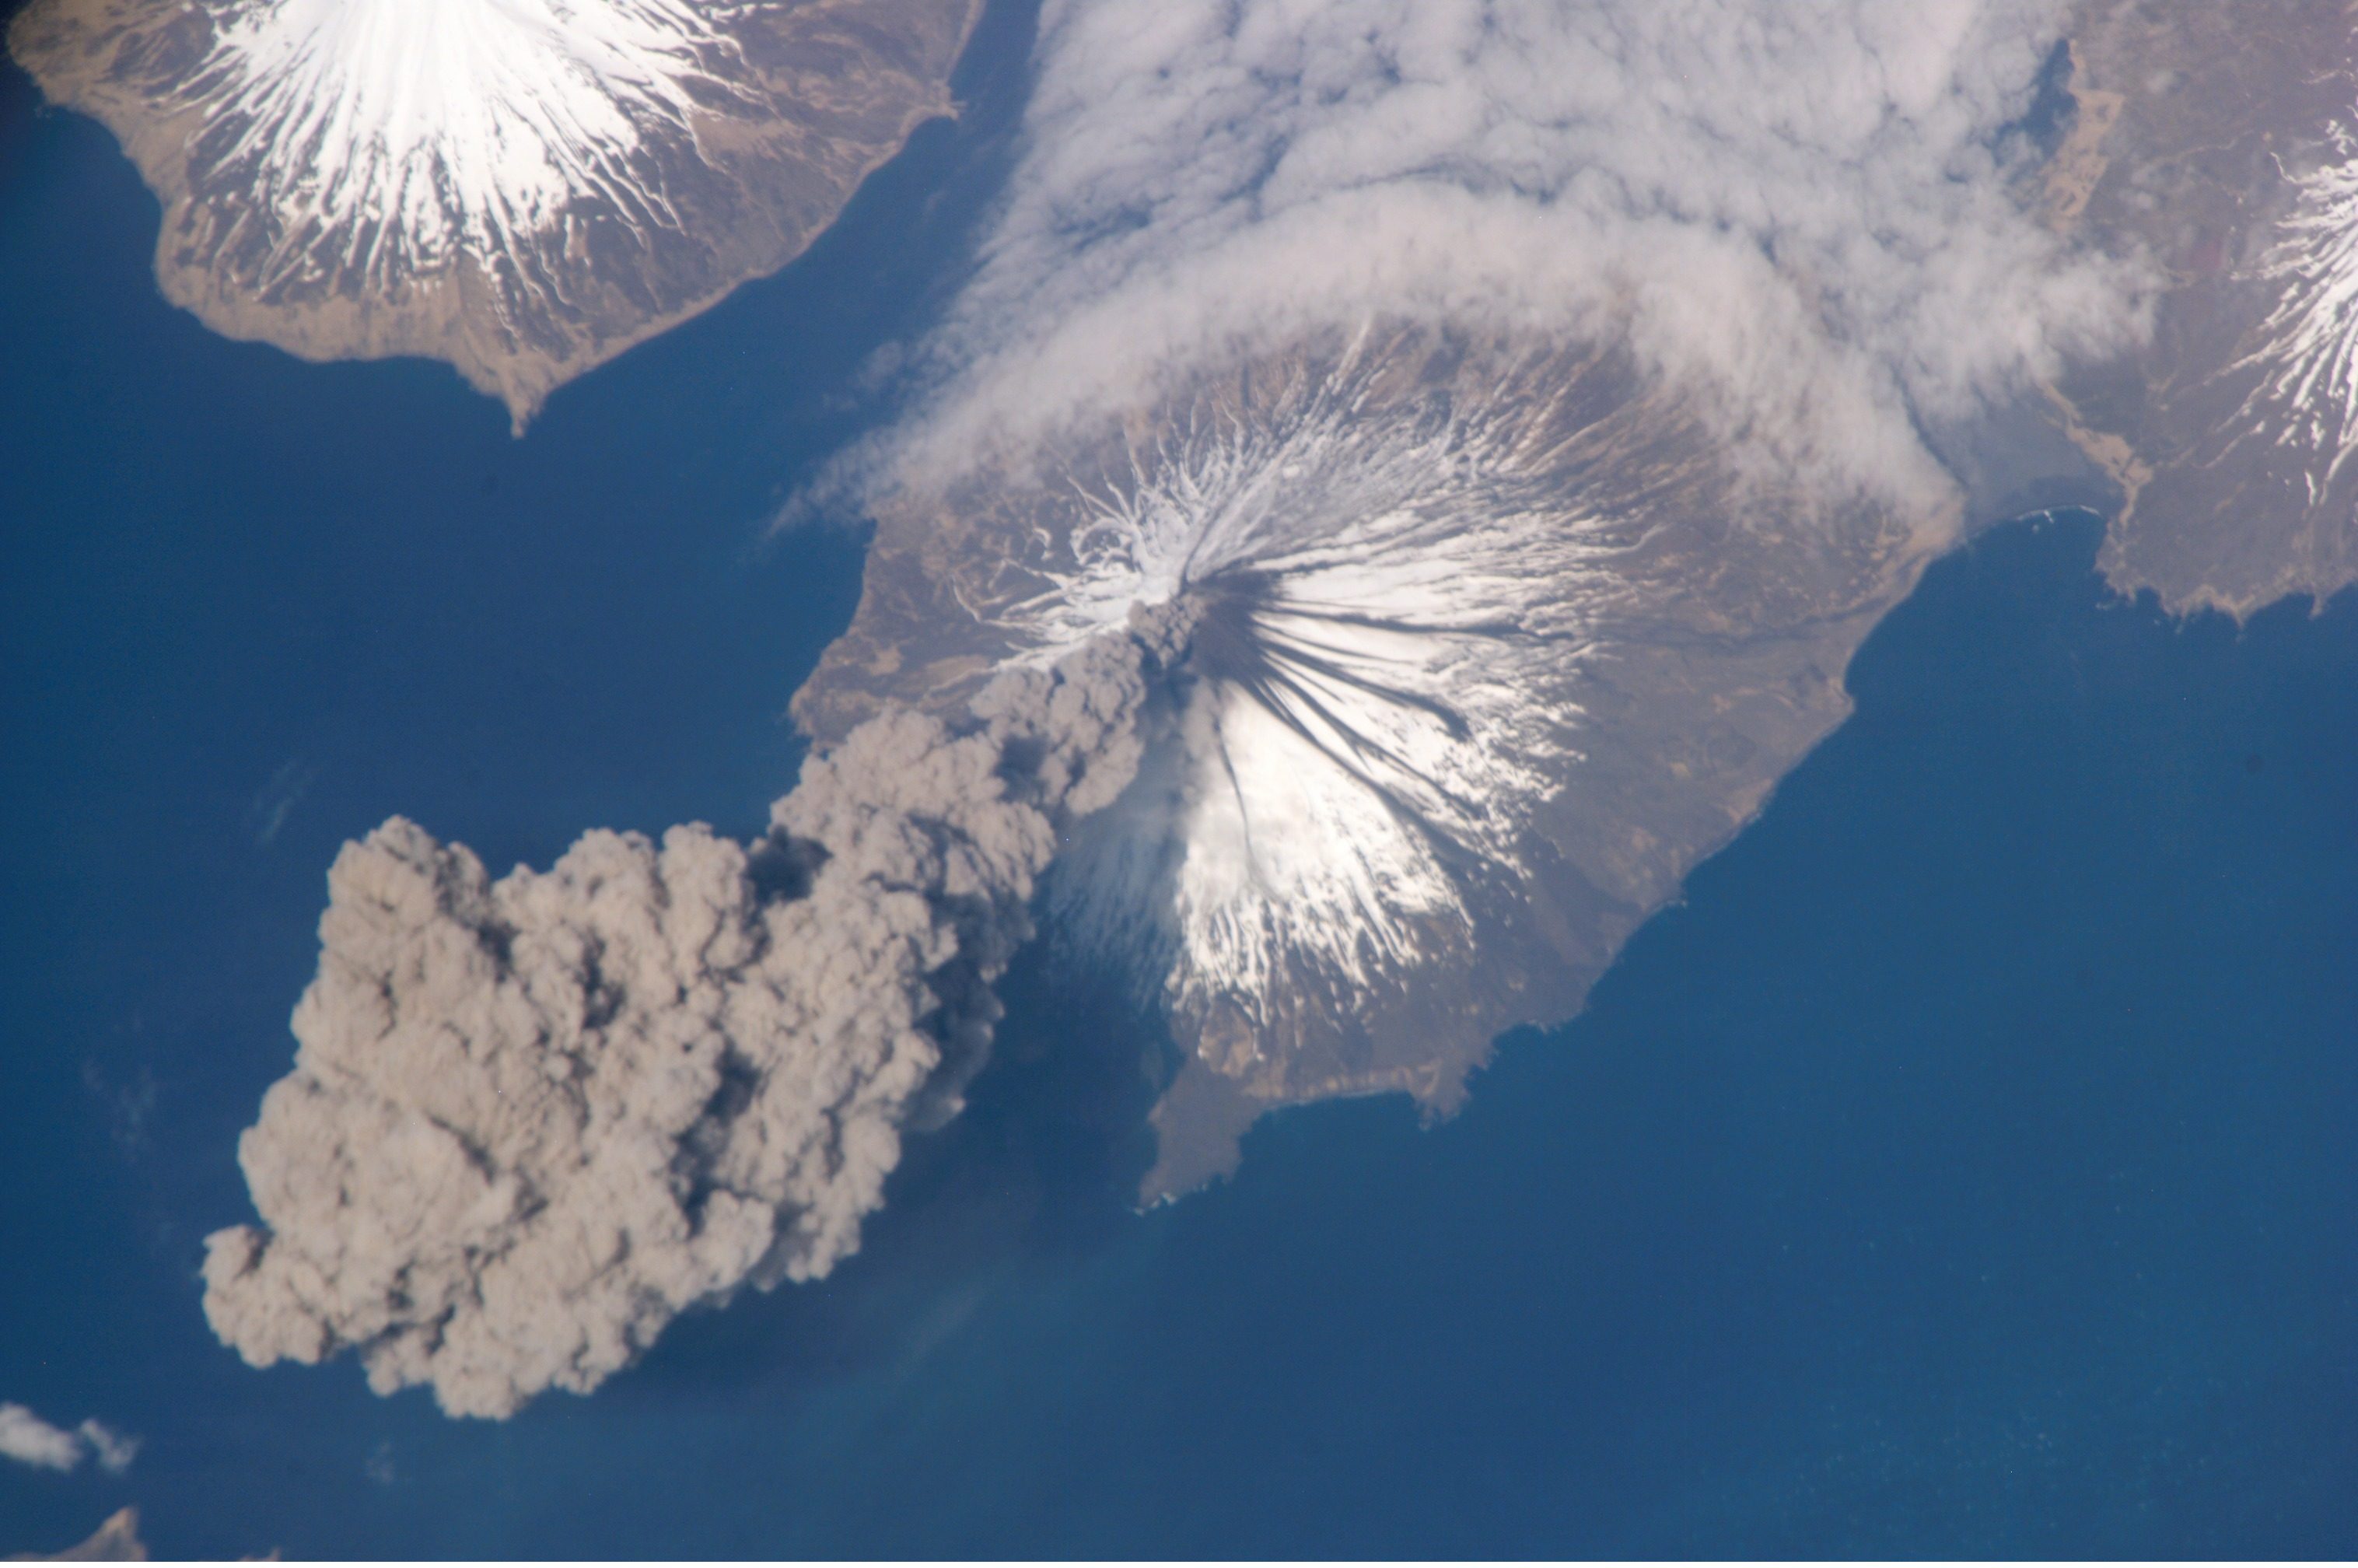
Image taken by a crew member of Expedition 13 from the ISS, showing the eruption of Cleveland Volcano, Aleutian Islands, Alaska. Credit: NASA
A volcano is an impressive sight. When they are dormant, they loom large over everything on the landscape. When they are active, they are a destructive force of nature that is without equal, raining fire and ash down on everything in site. And during the long periods when they are not erupting, they can also be rather beneficial to the surrounding environment.
But just what causes volcanoes? When it comes to our planet, they are the result of active geological forces that have shaped the surface of the Earth over the course of billions of years. And interestingly enough, there are plenty of examples of volcanoes on other bodies within our Solar System as well, some of which put those on Earth to shame!
Definition:
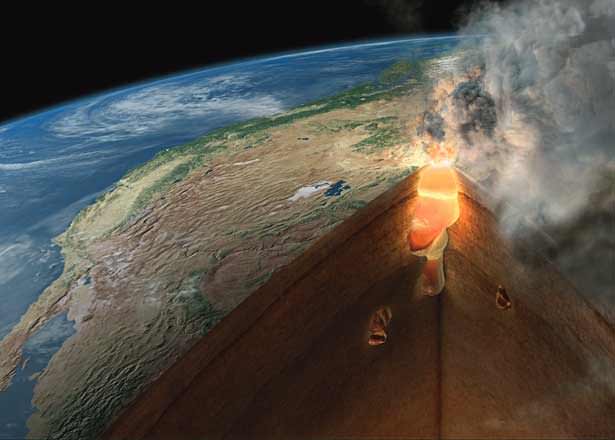
By definition, a volcano is a rupture in the Earth’s (or another celestial body’s) crust that allows hot lava, volcanic ash, and gases to escape from a magma chamber located beneath the surface. The term is derived from Vulcano, a volcanically-active island located of the coast of Italy who’s name in turn comes from the Roman god of fire (Vulcan).
Artist’s illustration of the Earth’s Tectonic Plates. Credit: msnucleus.org
On Earth, volcanoes are the result of the action between the major tectonic plates. These sections of the Earth’s crust are rigid, but sit atop the relatively viscous upper mantle. The hot molten rock, known as magma, is forced up to the surface – where it becomes lava. In short, volcanoes are found where tectonic plates are diverging or converging – such as the Mid-Atlantic Ridge or the Pacific Ring of Fire – which causes magma to be forced to the surface.
Volcanoes can also form where there is stretching and thinning of the crust’s interior plates, such as in the the East African Rift and the Rio Grande Rift in North America. Volcanism can also occur away from plate boundaries, where upwelling magma is forced up into brittle sections of the crust, forming volcanic islands – such as the Hawaiian islands.
Erupting volcanoes pose many hazards, and not just to the surrounding countryside. In their immediate vicinity, hot, flowing lava can cause extensive damage to the environment, property, and endanger lives. However, volcanic ash can cause far-reaching damage, raining sulfuric acid, disrupting air travel, and even causing “volcanic winters” by obscuring the Sun (thus triggering local crop failures and famines).
Types of Volcanoes:
There are four major types of volcanoes – cinder cone, composite and shield volcanoes, and lava domes. Cinder cones are the simplest kind of volcano, which occur when magma is ejected from a volcanic vent. The ejected lava rains down around the fissure, forming an oval-shaped cone with a bowl-shaped crater on top. They are typically small, with few ever growing larger than about 300 meters (1,000 feet) above their surroundings.
Paricutin, an example of a cinder cone volcano. Credit: USGS
Composite volcanoes (aka. stratovolcanoes) are formed when a volcano conduit connects a subsurface magma reservoir to the Earth’s surface. These volcanoes typically have several vents that cause magma to break through the walls and spew from fissures on the sides of the mountain as well as the summit.
These volcanoes are known for causing violent eruptions. And thanks to all this ejected material, these volcanoes can grow up to thousands of meters tall. Examples include Mount Rainier (4,392 m; 14,411 ft), Mount Fuji (3,776 m; 12,389 ft), Mount Cotopaxi (5,897 m; 19,347 ft) and Mount Saint Helens (2,549 mm; 8,363 ft).
Shield volcanoes are so-named because of their large, broad surfaces. With these types of volcanoes, the lava that pours forth is thin, allowing it to travel great distances down the shallow slopes. This lava cools and builds up slowly over time, with hundreds of eruptions creating many layers. They are therefore not likely to be catastrophic. Some of the best known examples are those that make up the Hawaiian Islands, especially Mauna Loa and Mauna Kea.
Volcanic or lava domes are created by small masses of lava which are too viscous to flow very far. Unlike shield volcanoes, which have low-viscosity lava, the slow-moving lava simply piles up over the vent. The dome grows by expansion over time, and the mountain forms from material spilling off the sides of the growing dome. Lava domes can explode violently, releasing a huge amount of hot rock and ash.
Artist’s impression of a what lies beneath the Yellowstone volcano. Credit: Hernán Cañellas/National Geographic
Volcanoes can also be found on the ocean floor, known as submarine volcanoes. These are often revealed through the presence of blasting steam and rocky debris above the ocean’s surface, though the pressure of the ocean’s water can often prevent an explosive release.
In these cases, lava cools quickly on contact with ocean water, and forms pillow-shaped masses on the ocean floor (called pillow lava). Hydrothermal vents are also common around submarine volcano, which can support active and peculiar ecosystems because of the energy, gases and minerals they release. Over time, the formations created by submarine volcanoes may become so large that they become islands.
Volcanoes can also developed under icecaps, which are known as subglacial volcanoes. In these cases, flat lava flows on top of pillow lava, which results from lava quickly cooling upon contact with ice. When the icecap melts, the lava on top collapses, leaving a flat-topped mountain. Very good examples of this type of volcano can be seen in Iceland and British Columbia, Canada.
Examples on Other Planets:
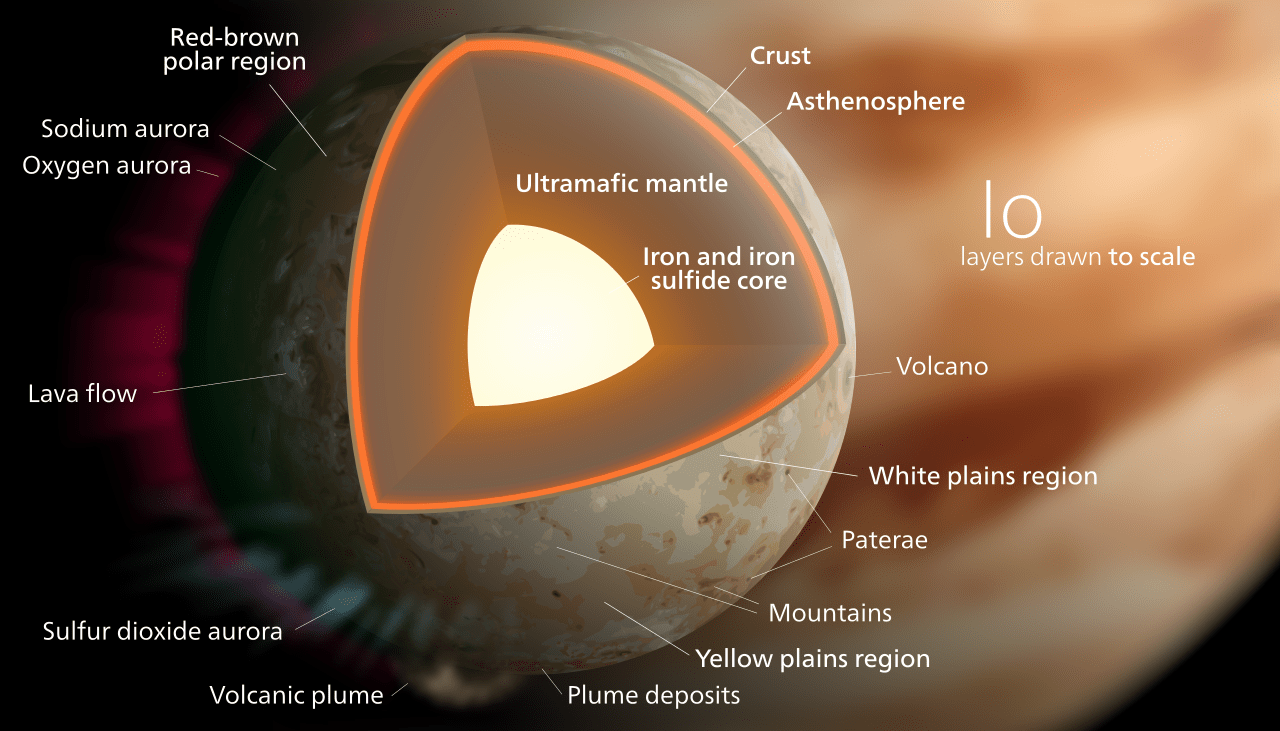
Volcanoes can be found on many bodies within the Solar System. Examples include Jupiter’s moon Io, which periodically experiences volcanic eruptions that reach up to 500 km (300 mi) into space. This volcanic activity is caused by friction or tidal dissipation produced in Io’s interior, which is responsible for melting a significant amount of Io’s mantle and core.
Model of the possible interior composition of Io with various features labelled. Credit: Wikipedia Commons/Kelvinsong
It’s colorful surface (orange, yellow, green, white/grey, etc.) shows the presence of sulfuric and silicate compounds, which were clearly deposited by volcanic eruptions. The lack of impact craters on its surface, which is uncommon on a Jovian moon, is also indicative of surface renewal.
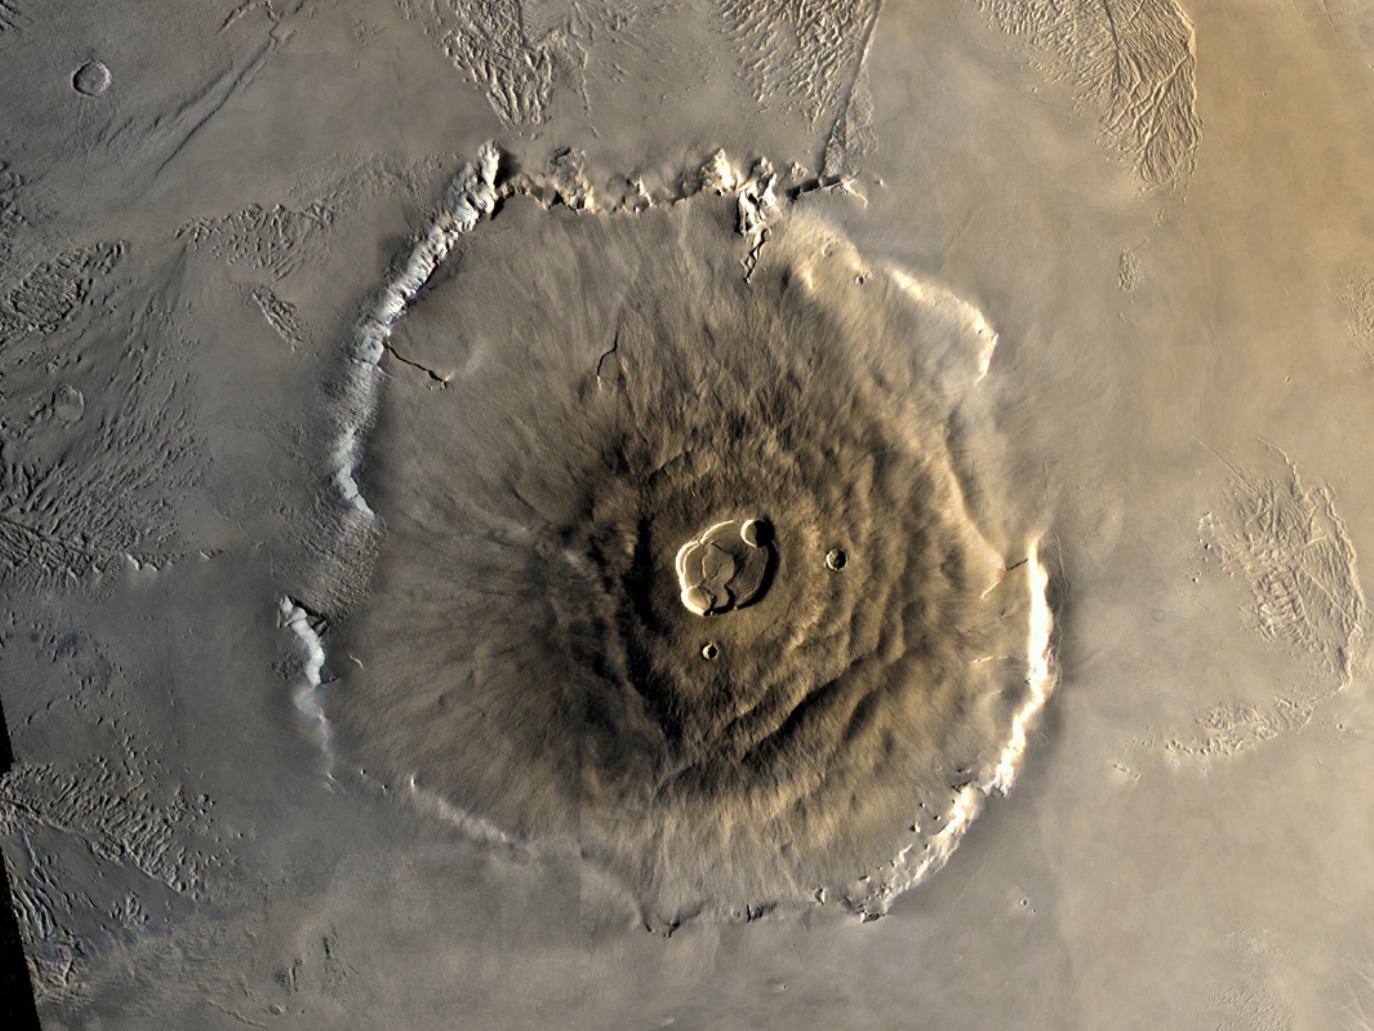
Mars has also experienced intense volcanic activity in its past, as evidenced by Olympus Mons – the largest volcano in the Solar System. While most of its volcanic mountains are extinct and collapsed, the Mars Express spacecraft observed evidence of more recent volcanic activity, suggesting that Mars may still be geologically active.
Much of Venus’ surface has been shaped by volcanic activity as well. While Venus has several times the number of Earth’s volcanoes, they were believed to all be extinct. However, there is a multitude of evidence that suggests that there may still be active volcanoes on Venus which contribute to its dense atmosphere and runaway Greenhouse Effect.
For instance, during the 1970s, multiple Soviet Venera missions conducted surveys of Venus. These missions obtained evidence of thunder and lightning within the atmosphere, which may have been the result of volcanic ash interacting with the atmosphere. Similar evidence was gathered by the ESA’s Venus Express probe in 2007.
3-D perspective of the Venusian volcano, Maat Mons generated from radar data from NASA’s Magellan mission. Credit: NASA/JPL
This same mission observed transient localized infrared hot spots on the surface of Venus in 2008 and 2009, specifically in the rift zone Ganis Chasma – near the shield volcano Maat Mons. The Magellan probe also noted evidence of volcanic activity from this mountain during its mission in the early 1990s, using radar-sounding to detect ash flows near the summit.
Cryovolcanism:
In addition to “hot volcanoes” that spew molten rock, there are also cryovolcanoes (aka. “cold volcanoes”). These types of volcanoes involve volatile compounds – i.e. water, methane and ammonia – instead of lava breaking through the surface. They have been observed on icy bodies in the Solar System where liquid erupts from ocean’s hidden in the moon’s interior.
For instance, Jupiter’s moon Europa, which is known to have an interior ocean, is believed to experiences cryovolcanism. The earliest evidence for this had to do with its smooth and young surface, which points towards endogenic resurfacing and renewal. Much like hot magma, water and volatiles erupt onto the surface where they then freeze to cover up impact craters and other features.
In addition, plumes of water were observed in 2012 and again in 2016 using the Hubble Space Telescope. These intermittent plumes were observed on both occasions to be coming in the southern region of Europa, and were estimated to be reach up to 200 km (125 miles) before depositing water ice and material back onto the surface.
In 2005, the Cassini-Huygens mission detected evidence of cryovolcanism on Saturn’s moons Titan and Enceladus. In the former case, the probe used infrared imaging to penetrate Titan’s dense clouds and detect signs of a 30 km (18.64 mi) formation, which was believed to be caused by the upwelling of hydrocarbon ices beneath the surface.
On Enceladus, cryovolcanic activity has been confirmed by observing plumes of water and organic molecules being ejected from the moon’s south pole. These plumes are are thought to have originated from the moon’s interior ocean, and are composed mostly of water vapor, molecular nitrogen, and volatiles (such as methane, carbon dioxide and other hydrocarbons).
In 1989, the Voyager 2 spacecraft observed cryovolcanoes ejecting plumes of water ammonia and nitrogen gas on Neptune’s moon Triton. These nitrogen geysers were observed sending plumes of liquid nitrogen 8 km (5 mi) above the surface of the moon. The surface is also quite young, which was seen as indication of endogenic resurfacing. It is also theorized that cryovolcanism may also be present on the Kuiper Belt Object Quaoar.
Here on Earth, volcanism takes the form of hot magma being pushed up through the Earth’s silicate crust due to convention in the interior. However, this kind of activity is present on all planet that formed from silicate material and minerals, and where geological activity or tidal stresses are known to exist. But on other bodies, it consists of cold water and materials from the interior ocean being forced through to the icy surface.
Color Mosaic of Olympus Mons on Mars. Credit: NASA/JPL
Today, our knowledge of volcanism (and the different forms it can take) is the result of improvements in both the field of geology, as well as space exploration. The more we learn of about other planets, the more we are able to see startling similarities and contrasts with our own (and vice versa).
Countries by average annual precipitation. Credit: Wikipedia Commons/Atila Kagan
Those who live along the “wet coast” – which is what people living in Puget Sound or the lower mainland of British Columbia and Vancouver Island affectionately call their home – might think that they live in the wettest place on Earth. Then again, people living in the Amazon rain forest might think that there lush and beautiful home is the dampest place in the world.
But in truth, all these places come up dry (pun intended!) compared to the one place that has held the title for wettest point on Earth many times in its history. And that place is none other than Mawsynram, India, which experiences an annual average rainfall of 12 meters. And yet, this curious region in northwestern part of the Indian subcontinent is an exercise in extremes, either drowning in rainwater, or starving for it.
Annual Rainfall:
When it comes to describing locations on planet Earth in terms of “wet”, some clarifications are needed. What we are talking about is average annual precipitation – i.e. rainfall, snow, drizzle, fog, etc. – measured in mm (or inches). This is necessary because otherwise, the “wettest” place on Earth would be the Mariana Trench, which has over 10,000 meters (36,000 feet) of water on top of it.
Cherrapunji, one of the wettest places on Earth. Credit: Public Domain
Also, based on rainfall. the wettest place on Earth has been known to change from time to time. In recent years, that title has gone to the town of Mawsynram, a village located in the East Khasi Hills district of northeastern, India. With an average annual rainfall of 11,872 millimetres (467.4 in), it is arguably the wettest place on Earth.
However, it is often in competition with the neighboring town of Cherrapunjee, which is located just 15 km (9.3 mi) to the west of Mawsynram in the East Khasi Hills district in northeastern India. The city’s yearly rainfall average stands at 11,777 millimetres (463.7 in), so it too has held the title.
The reason for these town experiencing so much precipitation has to do with the local climate. Situated within a subtropical highland climate zone, it experiences a lengthy and powerful monsoon season. In once instance, the monsoon season lasted for 2 years straight with no reported break in the rain!
Surprisingly, the high rainfall is a result of the region’s elevation and not the monsoon season alone. Huge amounts of warm air condense and fall as rain when they encounter the Khasi Hills. The topography of the region forces the very moist clouds up and down, forcing them to empty their accumulated water over the region.
Seven Sisters’ falls, located in the East Khasi Hills district. Credit: Wikipedia Commons/Rishav999
Other Locations:
Beyond northeastern India, there are several other locations on the planet that experience over 10 meters (32.8 feet) of annual precipitation. For instance, the town of Tutunendo, Colombia, experiences an average of 11,770 mm (463.38 in) of annual rainfall. The area actually experiences two rainy seasons a year, so precipitation is pretty much the norm.
Next up, there is Mount Waialeale, a shield volcano located on the island of Kaua’i on the Hawaiian Islands. As the the second highest point on the island, its name literally means “rippling water” (or “overflowing water”), and for good reason! This mountain has had an average of 11,500 mm (452 in) of rainfall since 1912.
However, in 1982, its summit experienced 17,300 mm (683 in), making it the wettest place on Earth in that year. And between 1978-2007, Big Bog – a spot in Haleakala National Park on the island of Maui, Hawaii – experienced an average of 10,300 mm (404 in) of rainfall, putting it in the top ten.
Waialeale (or ‘Rippling Waters’) Lake, located atop Mount Waialeale on the island of Kaua’i, Hawaii. Credit: Wikipedia Commons/Volcantrek8
As already noted, the “wettest place on Earth” changes over time. This should come as no surprise, considering that weather patterns have been known to shift, not only in the course of an average year, but also over the course of centuries and millennia.
Nevertheless, those places that experience over 10 meters of precipitation are generally found within the tropical regions of the world, places known for experiencing intense and prolonged rainy seasons, and where lush tropical rainforests have existed for thousands of years. Here is a recent list of the top 10 locations.
But with anthropogenic climate change becoming a growing factor in planetary weather systems, this too could be subject to change. In the coming decades, and centuries, who’s to say where the most precipitation will fall on planet Earth?
A brand new crater on the Moon! This new 12 meter (39 foot) diameter impact crater formed between 25 October 2012 and 21 April 2013 Credit: NASA/GSFC/Arizona State University].
Animation of a temporal pair of the new 39-foot (12-meter) impact crater on the moon photographed by NASA’s Lunar Reconnaissance Orbiter Credit: NASA/GSFC/Arizona State University
We often hear how the Moon’s appearance hasn’t changed in millions or even billions of years. While micrometeorites, cosmic rays and the solar wind slowly grind down lunar rocks, the Moon lacks erosional processes such as water, wind and lurching tectonic plates that can get the job done in a hurry.
One of a series of photos Apollo 11 astronaut Edwin Aldrin made of his bootprint in the dusty, sandy lunar soil, called regolith. Based on a newy study, the impression may disappear in a few tens of thousands of years instead a few million. Credit: NASA
Remember Buzz Aldrin’s photo of his boot print in the lunar regolith? It was thought the impression would last up to 2 million years. Now it seems that estimate may have to be revised based on photos taken by the Lunar Reconnaissance Orbiter (LRO) that reveal that impacts are transforming the surface much faster than previously thought.
This map shows the distribution of new impact craters (yellow dots) discovered by analyzing 14,000 narrow-angle camera (NAC) temporal pairs. The two red dots mark the location of the March 17, 2013 and September 11, 2013 impacts that were recorded by Earth-based video monitoring. LRO’s mission was recently extended an addition two years through September 2018. Credit: NASA/GSFC/ASUThe LRO’s high resolution camera, which can resolve features down to about 3 feet (1-meter) across, has been peering down at the Moon from orbit since 2009. Taking before and after images, called temporal pairs, scientists have identified 222 impact craters that formed over the past 7 years. The new craters range from 10 feet up to 141 feet (3-43 meters) in diameter.
By analyzing the number of new craters and their size, and the time between each temporal pair, a team of scientists from Arizona State University and Cornell estimated the current cratering rate on the Moon. The result, published in Nature this week, was unexpected: 33% more new craters with diameters of at least 30 feet (10 meters) were found than anticipated by previous cratering models.
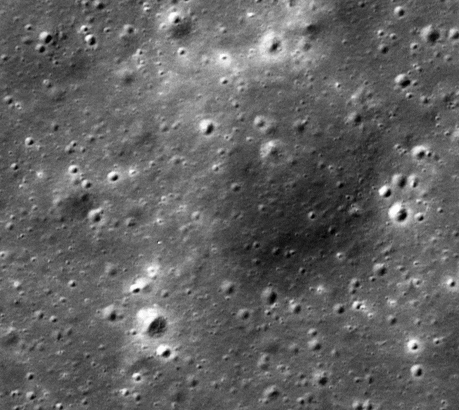
LRO before and after images of an impact event on March 17, 2013. The newly formed crater is 59 feet (18 meters) in diameter. Subsurface regolith not exposed to sunlight forms a bright halo around the new crater. There also appears to be a larger nimbus of darker reflectance material visible much further beyond but centered on the impact. Credit: NASA/GSFC/Arizona State University
Similar to the crater that appeared on March 17, 2013 (above), the team also found that new impacts are surrounded by light and dark reflectance patterns related to material ejected during crater formation. Many of the larger impact craters show up to four distinct bright or dark reflectance zones. Nearest to the impact site, there are usually zone of both high and low reflectance. These two zones likely formed as a layer of material that was ejected from the crater during the impact shot outward to about 2½ crater diameters from the rim.
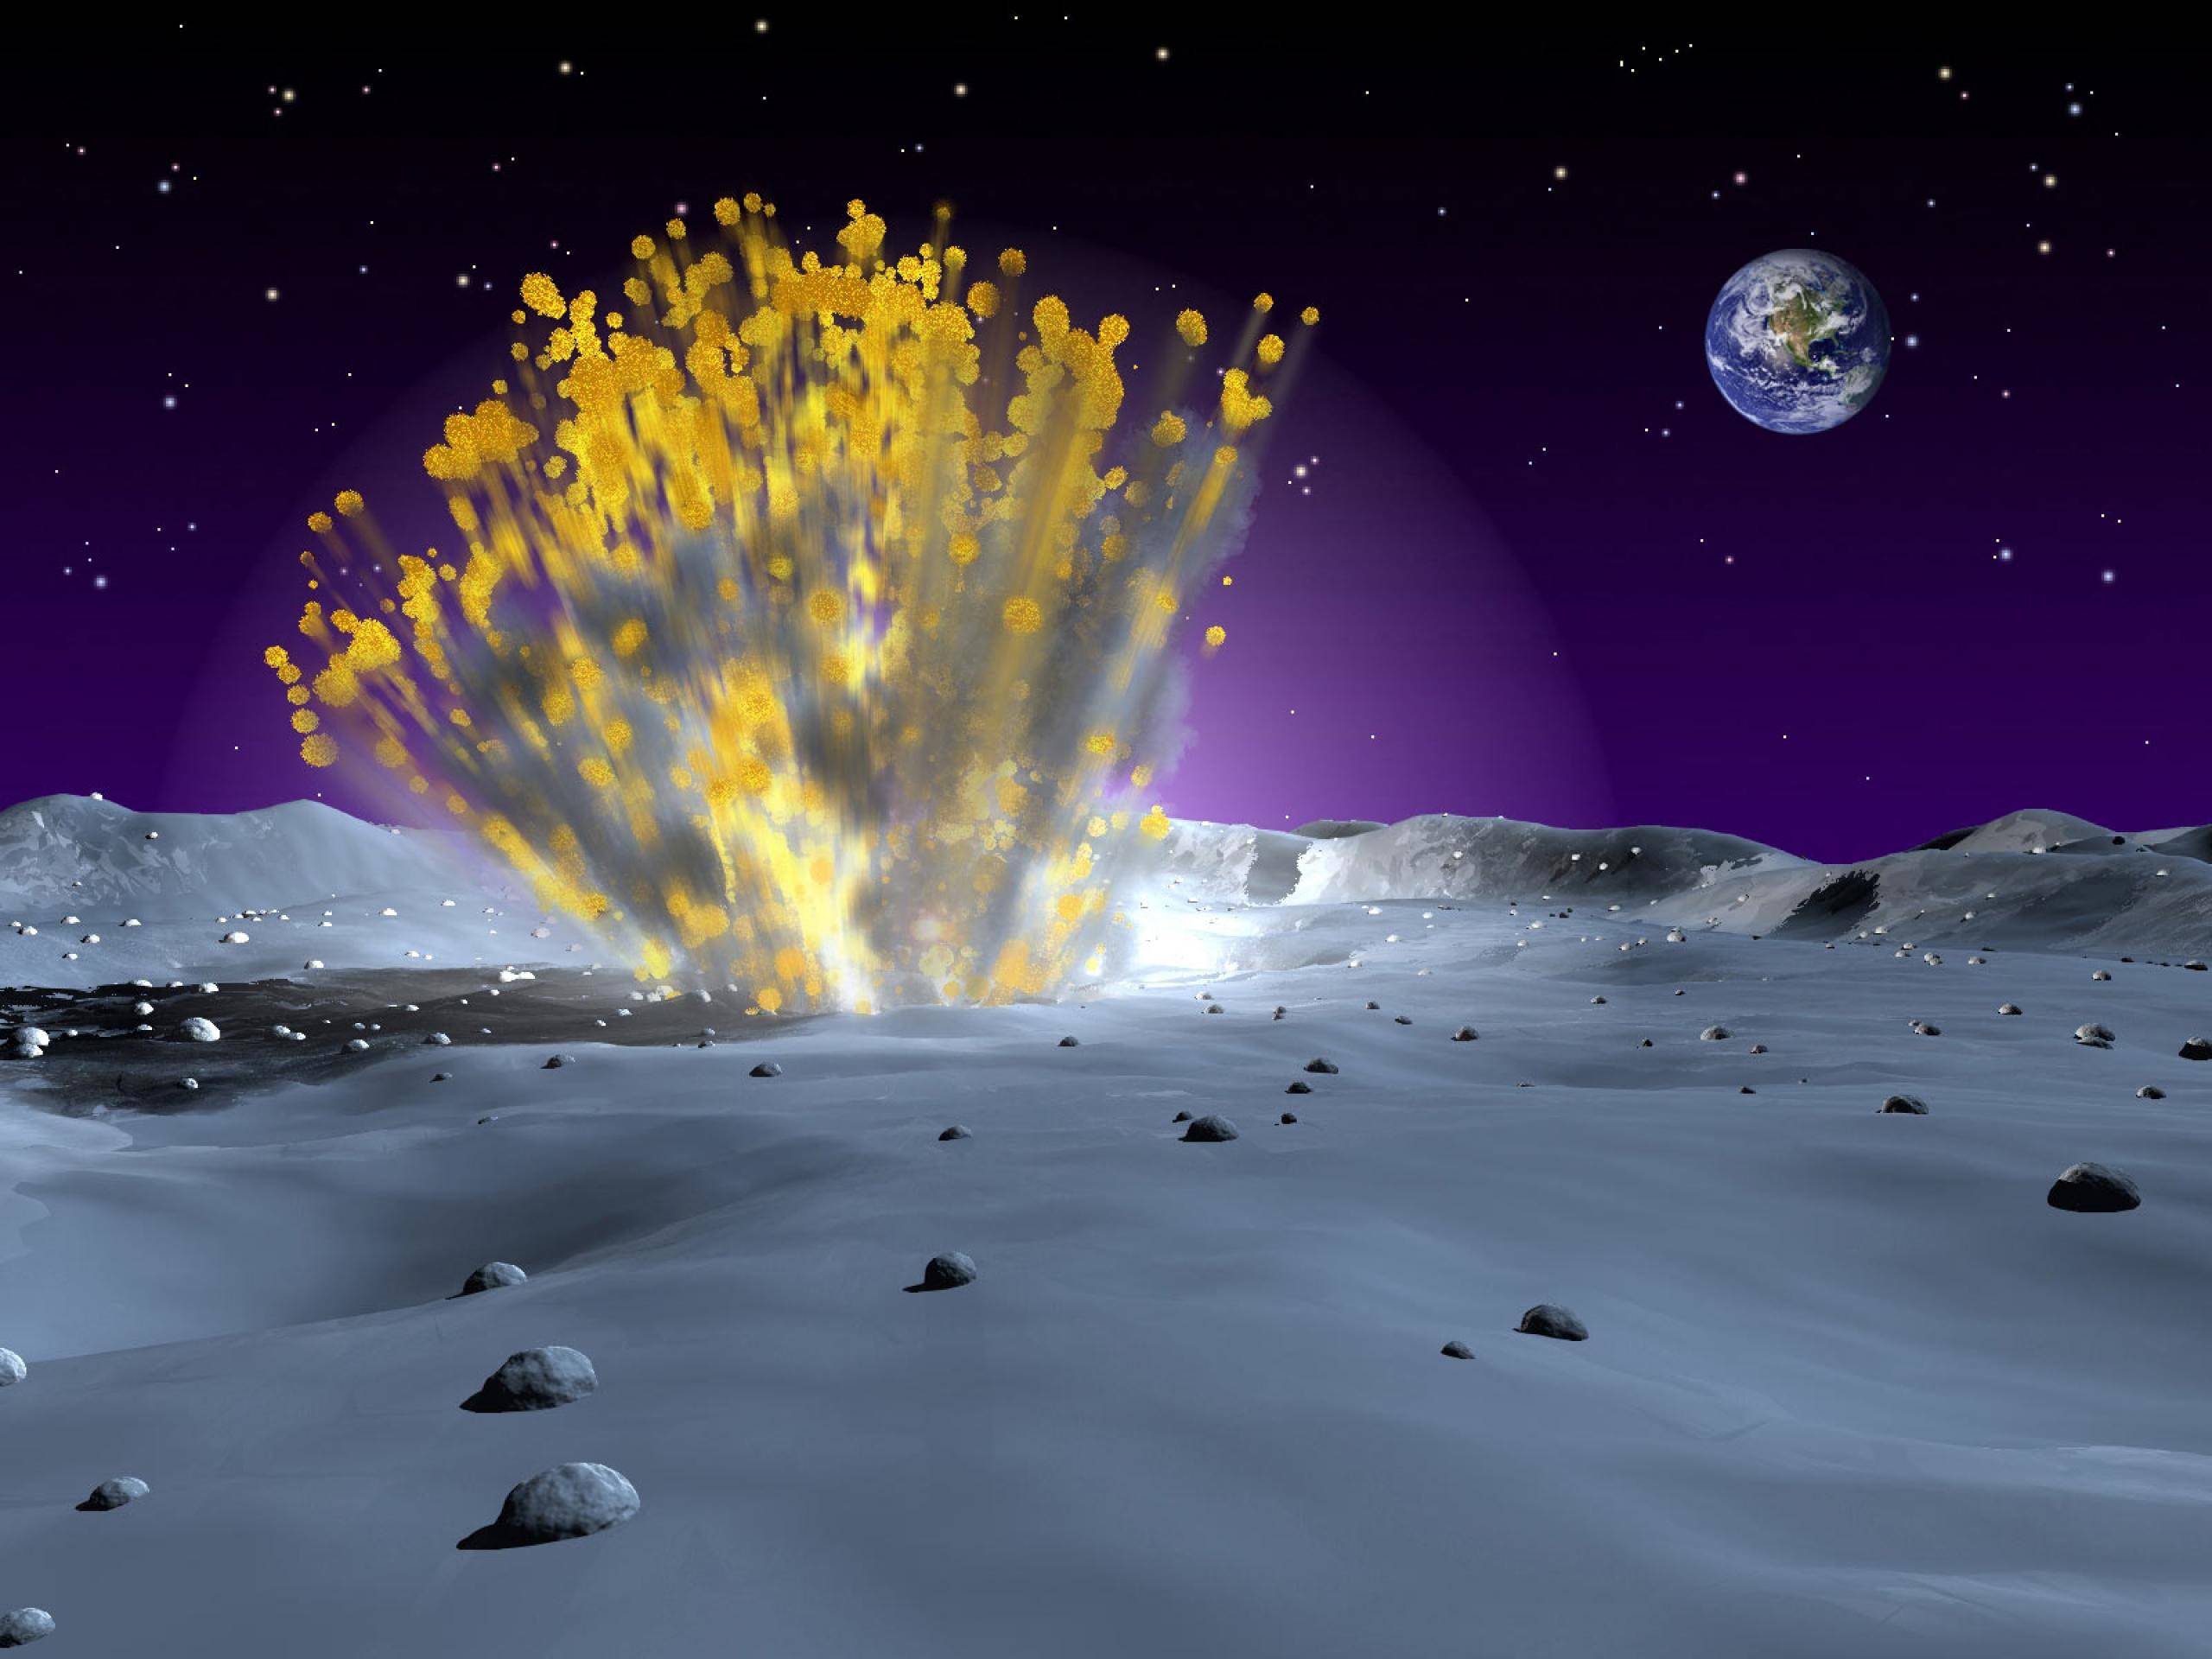
An artist’s illustration of a meteoroid impact on the Moon. Impacts dig up fresh material from below as well as send waves of hot rock vapor and molten rock across the lunar landscape, causing a much faster turnover of the moon soil than previously thought. Credit: NASA
From analyzing multiple impact sites, far flung ejecta patterns wrap around small obstacles like hills and crater rims, indicating the material was traveling nearly parallel to the ground. This kind of path is only possible if the material was ejected at very high speed around 10 miles per second or 36,000 miles per hour! The jet contains vaporized and molten rock that disturb the upper layer of lunar regolith, modifying its reflectance properties.
How LRO creates temporal pairs and scientists use them to discover changes on the moon’s surface.
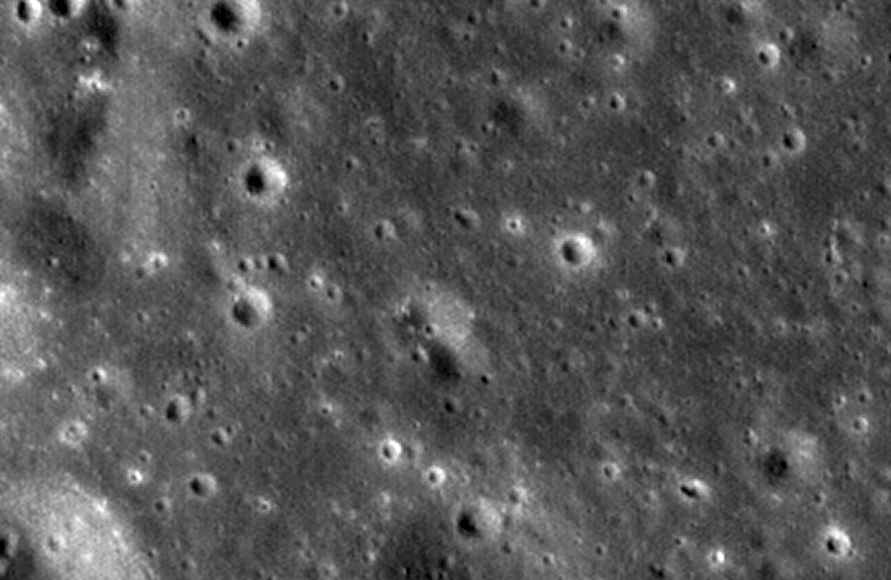
In addition to discovering impact craters and their fascinating ejecta patterns, the scientists also observed a large number of small surface changes they call ‘splotches’ most likely caused by small, secondary impacts. Dense clusters of these splotches are found around new impact sites suggesting they may be secondary surface changes caused by material thrown out from a nearby primary impact. From 14,000 temporal pairs, the group identified over 47,000 splotches so far.
Here are two examples of a low reflectance (top) and high reflectance (bottom) splotch created either by a small impactor or more likely from secondary ejecta. In either case, the top few inches of the regolith (soil) was churned Credit: NASA/GSFC/Arizona State UniversityBased on estimates of size, depth and frequency of formation, the group estimated that the relentless churning caused by meteoroid impacts will turn over 99% of the lunar surface after about 81,000 years. Keep in mind, we’re talking about the upper regolith, not whole craters and mountain ranges. That’s more than 100 times faster than previous models that only took micrometeorites into account. Instead of millions of years for those astronaut boot prints and rover tracks to disappear, it now appears that they’ll be wiped clean in just tens of thousands!
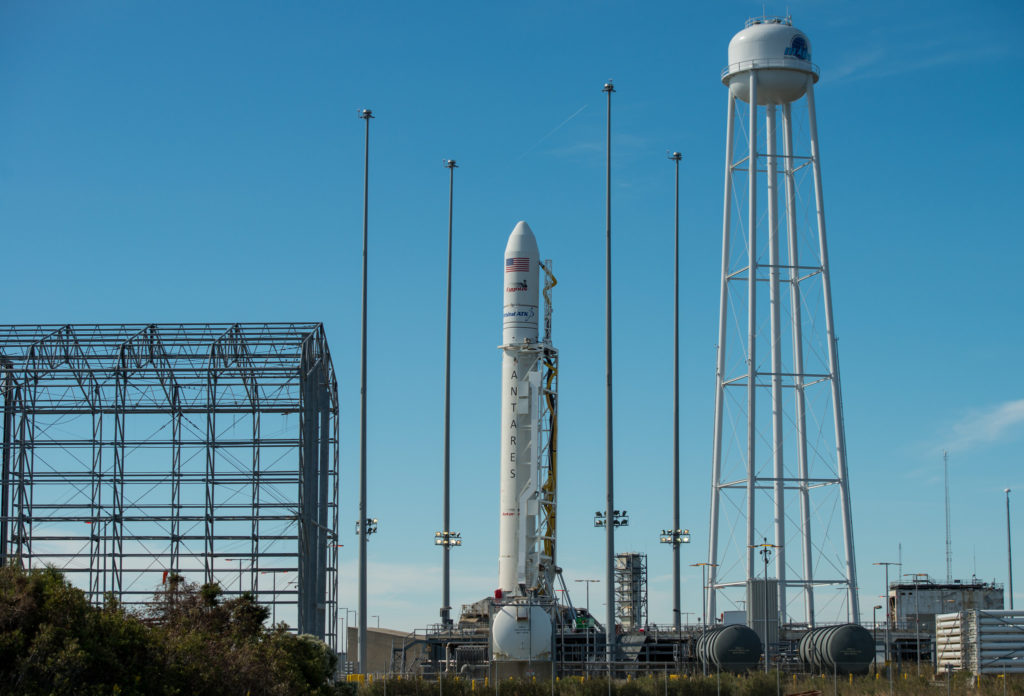
The Orbital ATK Antares rocket, with the Cygnus spacecraft onboard, is raised into the vertical position on launch Pad-0A, Friday, Oct. 14, 2016 at NASA's Wallops Flight Facility in Virginia. Credit: NASA/Bill Ingalls
The Orbital ATK Antares rocket, with the Cygnus spacecraft onboard, is raised into the vertical position on launch Pad-0A, Friday, Oct. 14, 2016 at NASA’s Wallops Flight Facility in Virginia. Credit: NASA/Bill Ingalls
NASA WALLOPS FLIGHT FACILITY, VA – After a two year stand down, an upgraded commercial Antares rocket was rolled out to the NASA Wallops launch pad on Virginia’s eastern shore and raised to its launch position today in anticipation of a spectacular Sunday night liftoff, Oct. 16, to the International Space Station (ISS) on a critical resupply mission for NASA.
Blastoff of the re-engined Orbital ATK Antares rocket is slated for 8:03 p.m. EDT on Oct. 16 from the Mid-Atlantic Regional Spaceport pad 0A at NASA’s Wallops Flight Facility on Virginia’s picturesque Eastern shore.
Officials had to postpone this commercial resupply mission – dubbed OA-5 – from mid-week due to Cat 3 Hurricane Nicole which slammed into Bermuda yesterday, Oct. 13, packing winds of about 125 mph, and is home to a critical NASA launch tracking station.
After the storm passed, engineers found the tracking station only suffered minor damage – so the GO was given to proceed with preparation for Sunday’s nighttime launch.
“Repairs to the station have been made and the team is currently readying to support the launch,” according to NASA officials.
Engineers are still testing the station to ensure its readiness.
“The Bermuda site provides tracking, telemetry and flight terminations support for Antares launches from NASA’s Wallops Flight Facility on Virginia’s Eastern Shore. Final testing is scheduled to be conducted the morning of Oct. 15 prior to the launch readiness review later that day.”
The Orbital ATK Antares rocket, with the Cygnus spacecraft onboard, is rolled out of the Horizontal Integration Facility (HIF) to begin the approximately half-mile journey to launch Pad-0A, Thursday, Oct. 13, 2016 at NASA’s Wallops Flight Facility in Virginia. Orbital ATK’s sixth contracted cargo resupply mission with NASA to the International Space Station. Credit: (NASA/Bill Ingalls)
If all goes well Antares is sure to provide a dazzling nighttime skyshow from NASA’s Virginia launch base Sunday night – and potentially offering a thrilling spectacle to millions of US East Coast spectators.
The launch window last five minutes and the weather outlook is currently favorable.
The launch will air live on NASA TV and the agency’s website beginning at 7 p.m. EDT Oct 16.
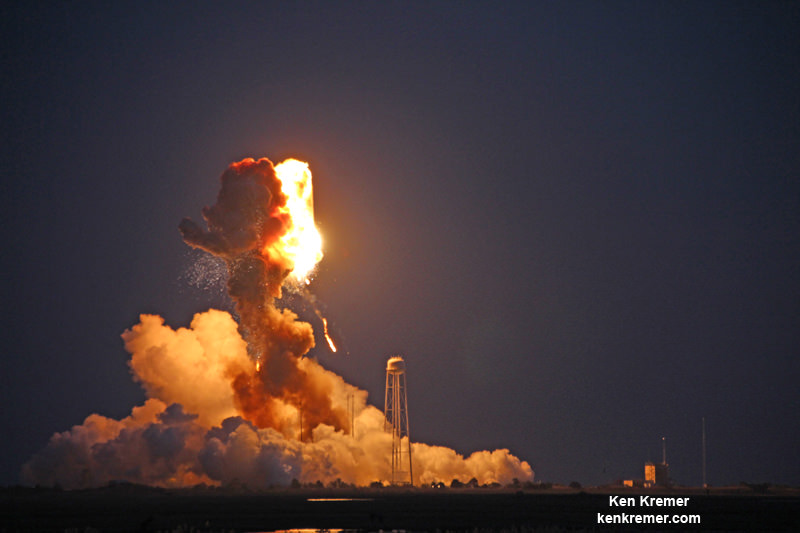
Antares rocket stands erect, reflecting off the calm waters the night before a launch from NASA’s Wallops Flight Facility, VA, on Oct. 28, 2014. Credit: Ken Kremer/kenkremer.com
The 133-foot-tall (40-meter) Antares was rolled out to pad 0A on Thursday, Oct. 13 – three days prior to the anticipated launch date – and raised to the vertical launch position this afternoon.
The two stage Antares will carry the Orbital OA-5 Cygnus cargo freighter to orbit on a flight bound for the ISS and its multinational crew of astronauts and cosmonauts.
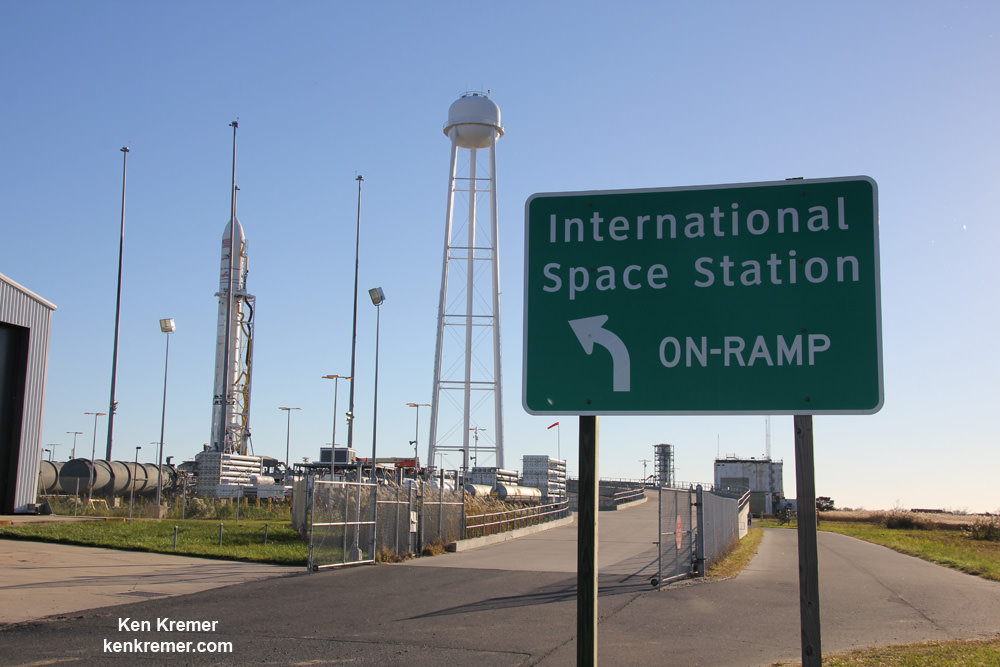
On-Ramp to the Orbital Sciences Antares rocket and International Space Station – ready for blastoff from NASA Wallops in this file photo. Credit: Ken Kremer – kenkremer.com
The launch marks the first nighttime liftoff of the Antares – and it could be visible up and down the eastern seaboard if weather and atmospheric conditions cooperate to provide a spectacular viewing opportunity to the most populated region in North America.
The 14 story tall commercial Antares rocket also will launch for the first time in the upgraded 230 configuration – powered by new Russian-built first stage engines.
Orbital ATK’s Antares commercial rocket had to be overhauled with the completely new RD-181 first stage engines – fueled by LOX/kerosene – following the destruction of the Antares rocket and Cygnus supply ship two years ago.
The RD-181 replaces the previously used AJ26 engines which failed moments after liftoff during the last launch on Oct. 28, 2014 resulting in a catastrophic loss of the rocket and Cygnus cargo freighter.
The launch mishap was traced to a failure in the AJ26 first stage engine turbopump and caused Antares launches to immediately grind to a halt.
The new RD-181 engines are installed on the Orbital ATK Antares first stage core ready to support a full power hot fire test at the NASA Wallops Island launch pad in March 2016. New thrust adapter structures, actuators, and propellant feed lines are incorporated between the engines and core stage. Credit: Ken Kremer/kenkremer.com
For the OA-5 mission, the Cygnus advanced maneuvering spacecraft will be loaded with approximately 2,400 kg (5,290 lbs.) of supplies and science experiments for the International Space Station (ISS).
“Cygnus is loaded with the Saffire II payload and a nanoracks cubesat deployer,” Frank DeMauro, Orbital ATK Cygnus program manager, told Universe Today in a interview.
Among the science payloads aboard the Cygnus OA-5 mission is the Saffire II payload experiment to study combustion behavior in microgravity. Data from this experiment will be downloaded via telemetry. In addition, a NanoRack deployer will release Spire Cubesats used for weather forecasting. These secondary payload operations will be conducted after Cygnus departs the space station.
Other experiments include a study on the effect of lighting on sleep and daily rhythms, collection of health-related data, and a new way to measure neutrons.
Watch for Ken’s continuing Antares/Cygnus mission and launch reporting. He will be reporting from on site at NASA’s Wallops Flight Facility, VA during the launch campaign.
Orbital Sciences Antares rocket explodes moments after blastoff from NASA’s Wallops Flight Facility, VA, on Oct. 28, 2014, at 6:22 p.m. Credit: Ken Kremer – kenkremer.com
The Cygnus spacecraft for the OA-5 mission is named the S.S. Alan G. Poindexter in honor of former astronaut and Naval Aviator Captain Alan Poindexter.
Under the Commercial Resupply Services (CRS) contract with NASA, Orbital ATK will deliver approximately 28,700 kilograms of cargo to the space station. OA-5 is the sixth of these missions.
The Orbital ATK Antares rocket, with the Cygnus spacecraft aboard. Credit: NASA/Bill Ingalls
Stay tuned here for Ken’s continuing Earth and Planetary science and human spaceflight news.


![Distribution of new impact craters (yellow dots) discovered by analyzing 14,000 NAC temporal pairs. The two red dots mark the location of the 17 March 2013 and the 11 September 2013 impacts that were recorded by Earth-based video monitoring [NASA/GSFC/Arizona State University]](https://www.universetoday.com/wp-content/uploads/2016/10/Moon-new-crater-distribution-NASA-GSFC-ASU.jpg)
![Example of a low reflectance (top) and high reflectance (bottom) splotch created either by a small impactor or more likely from secondary ejecta. In either case, the top few centimeters of the regolith (soil) was churned [NASA/GSFC/Arizona State University].](https://www.universetoday.com/wp-content/uploads/2016/10/Moon-craters-splotches-NASA.gif)