NASA Finds 2011 is Ninth-Warmest Year on Record

While average global temperature will still fluctuate from year to year, scientists focus on the decadal trend. Nine of the 10 warmest years since 1880 have occurred since the year 2000, as the Earth has experienced sustained higher temperatures than in any decade during the 20th century. As greenhouse gas emissions and atmospheric carbon dioxide levels continue to rise, scientists expect the long-term temperature increase to continue as well. (Data source: NASA Goddard Institute for Space Studies. Image credit: NASA Earth Observatory, Robert Simmon)

[/caption]

From a NASA press release:

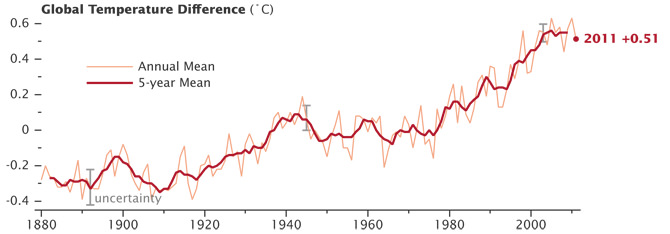
The global average surface temperature in 2011 was the ninth warmest since 1880, according to NASA scientists. The finding continues a trend in which nine of the 10 warmest years in the modern meteorological record have occurred since the year 2000.

NASA’s Goddard Institute for Space Studies (GISS) in New York, which monitors global surface temperatures on an ongoing basis, released an updated analysis that shows temperatures around the globe in 2011 compared to the average global temperature from the mid-20th century. The comparison shows how Earth continues to experience warmer temperatures than several decades ago. The average temperature around the globe in 2011 was 0.92 degrees F (0.51 C) warmer than the mid-20th century baseline.

“We know the planet is absorbing more energy than it is emitting,” said GISS Director James E. Hansen. “So we are continuing to see a trend toward higher temperatures. Even with the cooling effects of a strong La Niña influence and low solar activity for the past several years, 2011 was one of the 10 warmest years on record.”

The difference between 2011 and the warmest year in the GISS record (2010) is 0.22 degrees F (0.12 C). This underscores the emphasis scientists put on the long-term trend of global temperature rise. Because of the large natural variability of climate, scientists do not expect temperatures to rise consistently year after year. However, they do expect a continuing temperature rise over decades.

The first 11 years of the 21st century experienced notably higher temperatures compared to the middle and late 20th century, Hansen said. The only year from the 20th century in the top 10 warmest years on record is 1998.

Global temperatures have warmed significantly since 1880, the beginning of what scientists call the “modern record.” At this time, the coverage provided by weather stations allowed for essentially global temperature data. As greenhouse gas emissions from energy production, industry and vehicles have increased, temperatures have climbed, most notably since the late 1970s. In this animation of temperature data from 1880-2011, reds indicate temperatures higher than the average during a baseline period of 1951-1980, while blues indicate lower temperatures than the baseline average. (Data source: NASA Goddard Institute for Space Studies. Visualization credit: NASA Goddard Space Flight Center Scientific Visualization Studio)

Higher temperatures today are largely sustained by increased atmospheric concentrations of greenhouse gases, especially carbon dioxide. These gases absorb infrared radiation emitted by Earth and release that energy into the atmosphere rather than allowing it to escape to space. As their atmospheric concentration has increased, the amount of energy “trapped” by these gases has led to higher temperatures.

The carbon dioxide level in the atmosphere was about 285 parts per million in 1880, when the GISS global temperature record begins. By 1960, the average concentration had risen to about 315 parts per million. Today it exceeds 390 parts per million and continues to rise at an accelerating pace.

The temperature analysis produced at GISS is compiled from weather data from more than 1,000 meteorological stations around the world, satellite observations of sea surface temperature and Antarctic research station measurements. A publicly available computer program is used to calculate the difference between surface temperature in a given month and the average temperature for the same place during 1951 to 1980. This three-decade period functions as a baseline for the analysis.

The resulting temperature record is very close to analyses by the Met Office Hadley Centre in the United Kingdom and the National Oceanic and Atmospheric Administration’s National Climatic Data Center in Asheville, N.C.

Hansen said he expects record-breaking global average temperature in the next two to three years because solar activity is on the upswing and the next El Niño will increase tropical Pacific temperatures. The warmest years on record were 2005 and 2010, in a virtual tie.

“It’s always dangerous to make predictions about El Niño, but it’s safe to say we’ll see one in the next three years,” Hansen said. “It won’t take a very strong El Niño to push temperatures above 2010.”

For more information:

More information on the GISS temperature analysis
2010: Despite Subtle Differences, Global Temperature Records in Close Agreement (01.13.11)

Desperately Seeking a Snow Day: Why So Little Snow in 2012?

Ah, for the days of Snowmageddon and Snowpocalypse back in 2010 and 2011. So far, 2012 is turning out to be a dud as far as getting a snow day or two off from work or school. Even though the Pacific Northwest in the US just got a major snowstorm, on the whole the US isn’t seeing much snowfall this winter. Why such a difference in just one year? In this ScienceCast, JPL climatologist Bill Patzert explains what’s going on.

A Balanced Budget on Titan

Titan and Dione seen on December 10, 2011 by the Cassini spacecraft. (NASA/JPL/SSI/J. Major)

[/caption]

It’s been said many times that the most Earthlike world in our solar system is not a planet at all, but rather Saturn’s moon Titan. At first it may not seem obvious why; being only a bit larger than the planet Mercury and coated in a thick opaque atmosphere containing methane and hydrocarbons, Titan sure doesn’t look like our home planet. But once it’s realized that this is the only moon known to even have a substantial atmosphere, and that atmosphere creates a hydrologic cycle on its surface that mimics Earth’s – complete with weather, rain, and gully-carving streams that feed liquid methane into enormous lakes – the similarities become more evident. Which, of course, is precisely why Titan continues to hold such fascination for scientists.

Now, researchers have identified yet another similarity between Saturn’s hazy moon and our own planet: Titan’s energy budget is in equilibrium, making it much more like Earth than the gas giant it orbits.

A team of researchers led by Liming Li of the Department of Earth and Atmospheric Sciences at the University of Houston in Texas has completed the first-ever investigation of the energy balance of Titan, using data acquired by telescopes and the Cassini spacecraft from 2004 to 2010.

Energy balance (or “budget”) refers to the radiation a planet or moon receives from the Sun versus what it puts out. Saturn, Jupiter and Neptune emit more energy than they receive, which indicates an internal energy source. Earth radiates about the same amount as it receives, so it is said to be in equilibrium… similar to what is now shown to be the case for Titan.

Blue hazes hover high above thicker orange clouds over Titan's south pole (NASA/JPL/SSI)

The energy absorption and reflection rates of a planet’s – or moon’s! – atmosphere are important clues to the state of its climate and weather. Different balances of energy or changes in those balances can indicate climate change – global cooling or global warming, for instance.

Of course, this doesn’t mean Titan is a balmy world. At nearly 300 degrees below zero (F) it has an environment that even the most extreme Earth-based life would find inhospitable. Although Titan’s atmosphere is ten times thicker than Earth’s its composition is very different, permitting easy passage of infrared radiation (a.k.a. “heat”) and thus exhibits an “anti-greenhouse” effect, unlike Earth or, on the opposite end of the scale, Venus.

Still, some stable process is in place on Saturn’s moon that allows for distribution of solar energy across its surface, within its atmosphere and back out into space. With results due in from Cassini from a flyby on Jan. 2, perhaps there will soon be even more clues as to what that may be.

Read more about Earth’s changing energy budget here.

The team’s report was published in the AGU’s Geophysical Research Letters on December 15, 2011. Li, L., et al. (2011), The global energy balance of Titan, Geophys. Res. Lett., 38, L23201, doi:10.1029/2011GL050053.

Michael Mann on Climate: “There’s Still Time to Make the Right Choices”

Climate scientist Michael Mann from Penn State recently spoke at a TED event, and what he says in this video is nearly the same as in the article I wrote a year ago after hearing Mann speak — but now you can hear it from Mann himself.

The real shame here is that he needs to keep telling these same stories despite the overwhelming scientific evidence for anthropogenic climate change.

NASA’s New Climate and Weather Satellite Launches

The National Polar-orbiting Operational Environmental Satellite System Preparatory Project, or NPP, launched successfully on a Delta 2 rocket early today at at 5:48 a.m. EDT 09:48 GMT (or precisely at 2:48:01.828 a.m. PDT, according to NASA’s Twitter feed). The next generation satellite will measure both global climate changes and key weather variables, as well as test new technologies for future Earth observing satellites.

The spacecraft has also successfully separated and is now in orbit. The separation video is below.

Continue reading “NASA’s New Climate and Weather Satellite Launches”

Next Generation Climate and Weather Satellite Ready for Friday Launch

A new satellite that will test key technologies and instruments for the next generation of climate and weather-monitoring satellites is scheduled to launch on Friday, Oct. 28, 2011. The NPOESS Preparatory Project (NPP) mission has a planned liftoff from Vandenberg Air Force Base in California at 5:48 a.m. EDT/2:48 a.m. PDT.

“This is the first mission designed to provide observations for both weather forecasters and climate researchers and will provide data that is critical to climate research,” said Jim Gleason, NPP project scientist during a news briefing last week.
Continue reading “Next Generation Climate and Weather Satellite Ready for Friday Launch”

Scientists Predict Arctic Could Be Ice-Free Within Decades

Sea ice data through mid- March 2011. Credit: National Snow and Ice Data Center

[/caption]

Bad news for what is now the beginning of the “melt season” in the Arctic. Right now, the sea ice extent maximum appears to be tied for the lowest ever measured by satellites as the spring begins, according to scientists at the University of Colorado Boulder’s National Snow and Ice Data Center. And because of the trend of how the amount of Arctic sea ice has been spiraling downward in the last decade, some scientists are predicting the Arctic Ocean may be ice free in the summers within the next several decades.

“I’m not surprised by the new data because we’ve seen a downward trend in winter sea ice extent for some time now,” said Walt Meier, a research scienitist with the NSIDC.

The seven lowest maximum Arctic sea ice extents measured by satellites all have occurred in the last seven years, and the from the latest data, the NSIDC research team believes the lowest annual maximum ice extent of 5,650,000 square miles occurred on March 7 of this year.

The maximum ice extent was 463,000 square miles below the 1979-2000 average, an area slightly larger than the states of Texas and California combined. The 2011 measurements were tied with those from 2006 as the lowest maximum sea ice extents measured since satellite record keeping began in 1979.

Virtually all climate scientists believe shrinking Arctic sea ice is tied to warming temperatures in the region caused by an increase in human-produced greenhouse gases being pumped into Earth’s atmosphere.

Meier said the Arctic sea ice functions like an air conditioner for the global climate system by naturally cooling air and water masses, playing a key role in ocean circulation and reflecting solar radiation back into space. In the Arctic summer months, sunlight is absorbed by the growing amounts of open water, raising surface temperatures and causing more ice to melt.

“I think one of the reasons the Arctic sea ice maximum extent is declining is that the autumn ice growth is delayed by warmer temperatures and the ice extent is not able to ‘catch up’ through the winter,” said Meier. “In addition, the clock runs out on the annual ice growth season as temperatures start to rise along with the sun during the spring months.”

Since satellite record keeping began in 1979, the maximum Arctic sea ice extent has occurred as early as Feb. 18 and as late as March 31, with an average date of March 6. Since the researchers determine the maximum sea ice extent using a five-day running average, there is small chance the data could change.

As of March 22, ice extent declined for five straight days. But February and March tend to be quite variable, so there is still a chance that the ice extent could expand again. Ice near the edge is thin and is highly sensitive to weather, scientists say, moving or melting quickly in response to changing winds and temperatures, and it often oscillates near the maximum extent for several days or weeks, as it has done this year.

In early April the NSIDC will issue a formal announcement on the 2011 maximum sea ice extent with a full analysis of the winter ice growth season, including graphics comparing 2011 to the long-term record.

Source: NSIDC, University of Colorado-Boulder

Study: Thawing Permafrost Could Accelerate Global Warming

From a press release from the University of Colorado Boulder:

Up to two-thirds of Earth’s permafrost likely will disappear by 2200 as a result of warming temperatures, unleashing vast quantities of carbon into the atmosphere, says a new study by the University of Colorado Boulder’s Cooperative Institute for Research in Environmental Sciences (CIRES).

The carbon resides in permanently frozen ground that is beginning to thaw in high latitudes from warming temperatures, which will impact not only the climate but also international strategies to reduce fossil fuel emissions, said CU-Boulder’s Kevin Schaefer, lead study author. “If we want to hit a target carbon dioxide concentration, then we have to reduce fossil fuel emissions that much lower than previously thought to account for this additional carbon from the permafrost,” he said. “Otherwise we will end up with a warmer Earth than we want.”
Continue reading “Study: Thawing Permafrost Could Accelerate Global Warming”

Desertification

Desertification Image Credit: Ewan Robinson

[/caption]

The Sahelian-drought, that began in 1968 and took place in sub-Saharan Africa, was responsible for the deaths of between 100,000 to 250,000 people, the displacement of millions more and the collapse of the agricultural base for several African nations. In North America during the 1930’s, parts of the Canadian Prairies and the “Great Planes” in the US turned to dust as a result of drought and poor farming practices. This “Dust Bowl” forced countless farmers to abandon their farms and way of life and made a fragile economic situation even worse. In both cases, a combination of factors led to the process known as Desertification. This is defined as the persistent degradation of dryland ecosystems due to natural and man-made factors, and it is a complex process.

Desertification can be caused by climactic variances, but the chief cause is human activity. It is principally caused by overgrazing, overdrafting of groundwater and diversion of water from rivers for human consumption and industrial use. Add to that overcultivation of land which exhausts the soil and deforestation which removes trees that anchor the soil to the land, and you have a very serious problem! Today, desertification is devouring more than 20,000 square miles of land worldwide every year. In North America, 74% of the land in North America is affected by desertification while in the Mediterranean, water shortages and poor harvests during the droughts of the early 1990s exposed the acute vulnerability of the Mediterranean region to climatic extremes.

In Africa, this presents a serious problem where more than 2.4 million acres of land, which constitutes 73% of its drylands, are affected by desertification. Increased population and livestock pressure on marginal lands have accelerated this problem. In some areas, where nomads still roam, forced migration causes these people to move to new areas and place stress on new lands which are less arid and hence more vulnerable to overgrazing and drought. Given the existing problems of overpopulation, starvation, and the fact that imports are not a readily available option, this phenomenon is likely to lead to greater waves of starvation and displacement in the near future.

Against this backdrop, the prospect of a major climate change brought about by human activities is a source of growing concern. Increased global mean temperatures will mean more droughts, higher rates of erosion, and a diminished supply land water; which will seriously undermine efforts to combat drought and keep the world’s deserts from spreading further. The effects will be felt all over the world but will hit the equatorial regions of the world especially hard, regions like Sub-Saharan Africa, the Mediterranean, Central and South America, where food shortages are already a problem and are having serious social, economic and political consequences.

We have written many articles about desertification for Universe Today. Here’s an article about the largest desert on Earth, and here’s an article about the Atacama Desert.

If you’d like more info on desertification, check out Visible Earth Homepage. And here’s a link to NASA’s Earth Observatory.

We’ve also recorded an episode of Astronomy Cast all about planet Earth. Listen here, Episode 51: Earth.

Sources:
http://en.wikipedia.org/wiki/Desertification
http://www.greenfacts.org/en/desertification/index.htm
http://archive.greenpeace.org/climate/science/reports/desertification.html
http://pubs.usgs.gov/gip/deserts/desertification/
http://didyouknow.org/deserts/
http://en.wikipedia.org/wiki/Overdrafting

New Galaxy Zoo Project Crowd-sources Old Climate Data

The newest citizen science project from the Galaxy Zoo team lets the public travel back in time and join the crews of over 280 different World War I royal navy warships. While an engaging historical journey, the project will help scientists better understand the climate of the past. There are gaps in weather and climate data records, particularly before 1920, prior to when weather station observations were accurately recorded. But old naval ships routinely recorded the weather they encountered – marking down temperatures and conditions even while in battle. The information in many of these weather logbooks has not been utilized – until now, as the “Old Weather” project has made its debut as the newest way for the public to contribute in scientific research.

The project is designed to provide a detailed map of the world’s climate around 100 years ago, which will help tell us more about the climate today. Anyone can take part, read the logs, follow events aboard the vessels and contribute to this fun and historical project, which could tell us more about our climate’s future.

“These naval logbooks contain an amazing treasure trove of information but because the entries are handwritten they are incredibly difficult for a computer to read,’ said Dr. Chris Lintott of Oxford University, a Galaxy Zoo founder and developer of the OldWeather.org project. “By getting an army of online human volunteers to retrace these voyages and transcribe the information recorded by British sailors we can relive both the climate of the past and key moments in naval history.”

By transcribing information about weather, and any interesting events, from images of each ship’s logbook web volunteers will help scientists to build a more accurate picture of how our climate has changed over the last century, as well as adding to our knowledge of this important period of British history.

HMS Acacia, one of the ships in the Old Weather project.

“Historical weather data is vital because it allows us to test our models of the Earth’s climate,”said Dr. Peter Stott, Head of Climate Monitoring and Attribution at the British meteorology, or Met Office. “If we can correctly account for what the weather was doing in the past, then we can have more confidence in our predictions of the future. Unfortunately, the historical record is full of gaps, particularly from before 1920 and at sea, so this project is invaluable.”

Weather observations by Royal Navy sailors were made every four hours without fail, said Dr. Robert Simpson of Oxford University, who added that this project is almost like “launching a weather satellite into the skies at a time when manpowered flight was still in its infancy.”

What is Old Weather from National Maritime Museum on Vimeo.

If you are not yet familiar yet with the Zooniverse, which includes citizen science projects like Galaxy Zoo and Moon Zoo, you are really missing out on a fun and engaging way to do actual, meaningful science. In those projects, 320,000 people have made over 150 million classifications and published several scientific papers – which shown that ordinary web users can make observations that are as accurate as those made by experts.

Old Weather is unique among the eight scientific projects encompassed by the Zooniverse because of how old the data is, and participating really is a trip back in time. The ‘virtual sailors’ visiting OldWeather.org are rewarded for their efforts by a rise through the ratings from cadet to captain of a particular ship according to the number of pages they transcribe. Historians are also hoping that a look into these old records will provide a fresh insight into naval history and encourage people to find out more about the past.

Here’s a tutorial on how to participate in Old Weather:

Old Weather – Getting Started from The Zooniverse on Vimeo.

To find out more, and participate visit OldWeather.org. There’s also an Old Weather blog at http://blogs.zooniverse.org/oldweather

You can also follow the project on Twitter (@OldWeather) and Facebook.