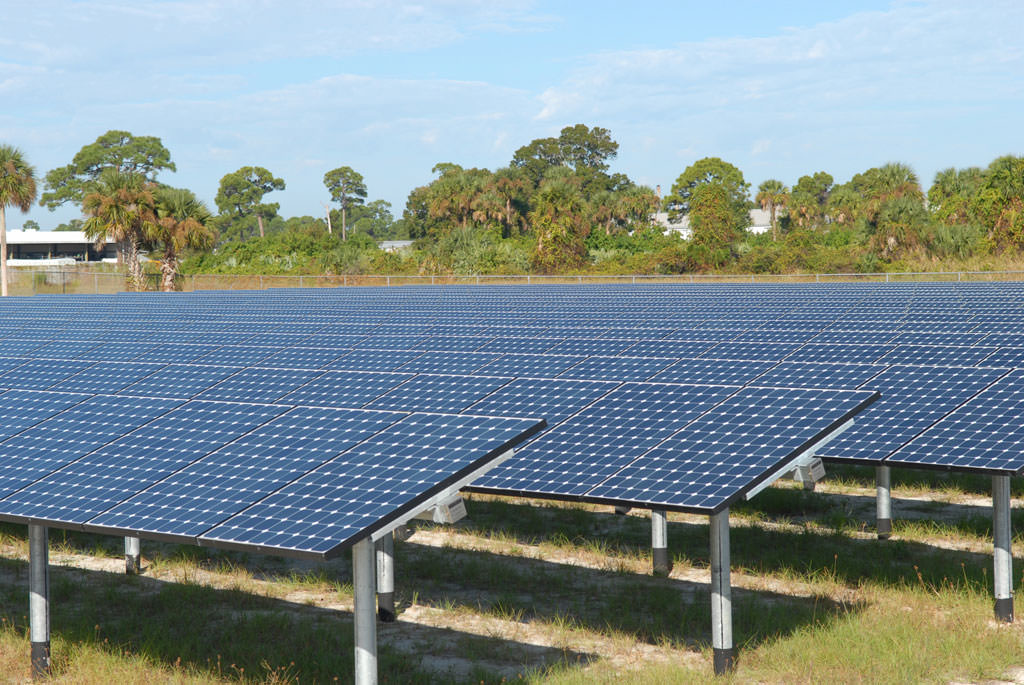
More than 3,300 solar panels have been erected on a vacant five acres at NASA's Kennedy Space Center. Credit: NASA/Jim Grossman
[/caption]
Today, the total oil and natural gas production provides about 60 percent of global energy consumption. This percentage is expected to peak about 10 to 30 years from now, and then be followed by a rapid decline, due to declining oil reserves and, hopefully, sources of renewable energy that technologies that will become more economically viable. But will there be the technology breakthroughs needed to make clean and exhaustible energy cost effective?
Nobel prize winner Walter Kohn, Ph.D., from the University of California Santa Barbara said that the continuous research and development of alternate energy could soon lead to a new era in human history in which two renewable sources — solar and wind — will become Earth’s dominant contributor of energy.
“These trends have created two unprecedented global challenges”, Kohn said, speaking at the American Chemical Society’s national meeting. “One is the threatened global shortage of acceptable energy. The other is the unacceptable, imminent danger of global warming and its consequences.”
The nations of the world need a concerted commitment to a changeover from the current era, dominated by oil plus natural gas, to a future era dominated by solar, wind, and alternative energy sources, Kohn said, and he sees that beginning to happen.
The global photovoltaic energy production increased by a factor of about 90 and wind energy by a factor of about 10 over the last decade. Kohn expects vigorous growth of these two energies to continue during the next decade and beyond, thereby leading to a new era, what he calls the SOL/WIND era, in human history, in which solar and wind energy have become the earth’s dominant alternative energies.
Kohn noted that this challenge require a variety of responses. “The most obvious is continuing scientific and technical progress providing abundant and affordable alternative energies, safe, clean and carbon-free,” he said.
One of the biggest challenges might be leveling off global population, as well as energy consumption levels.
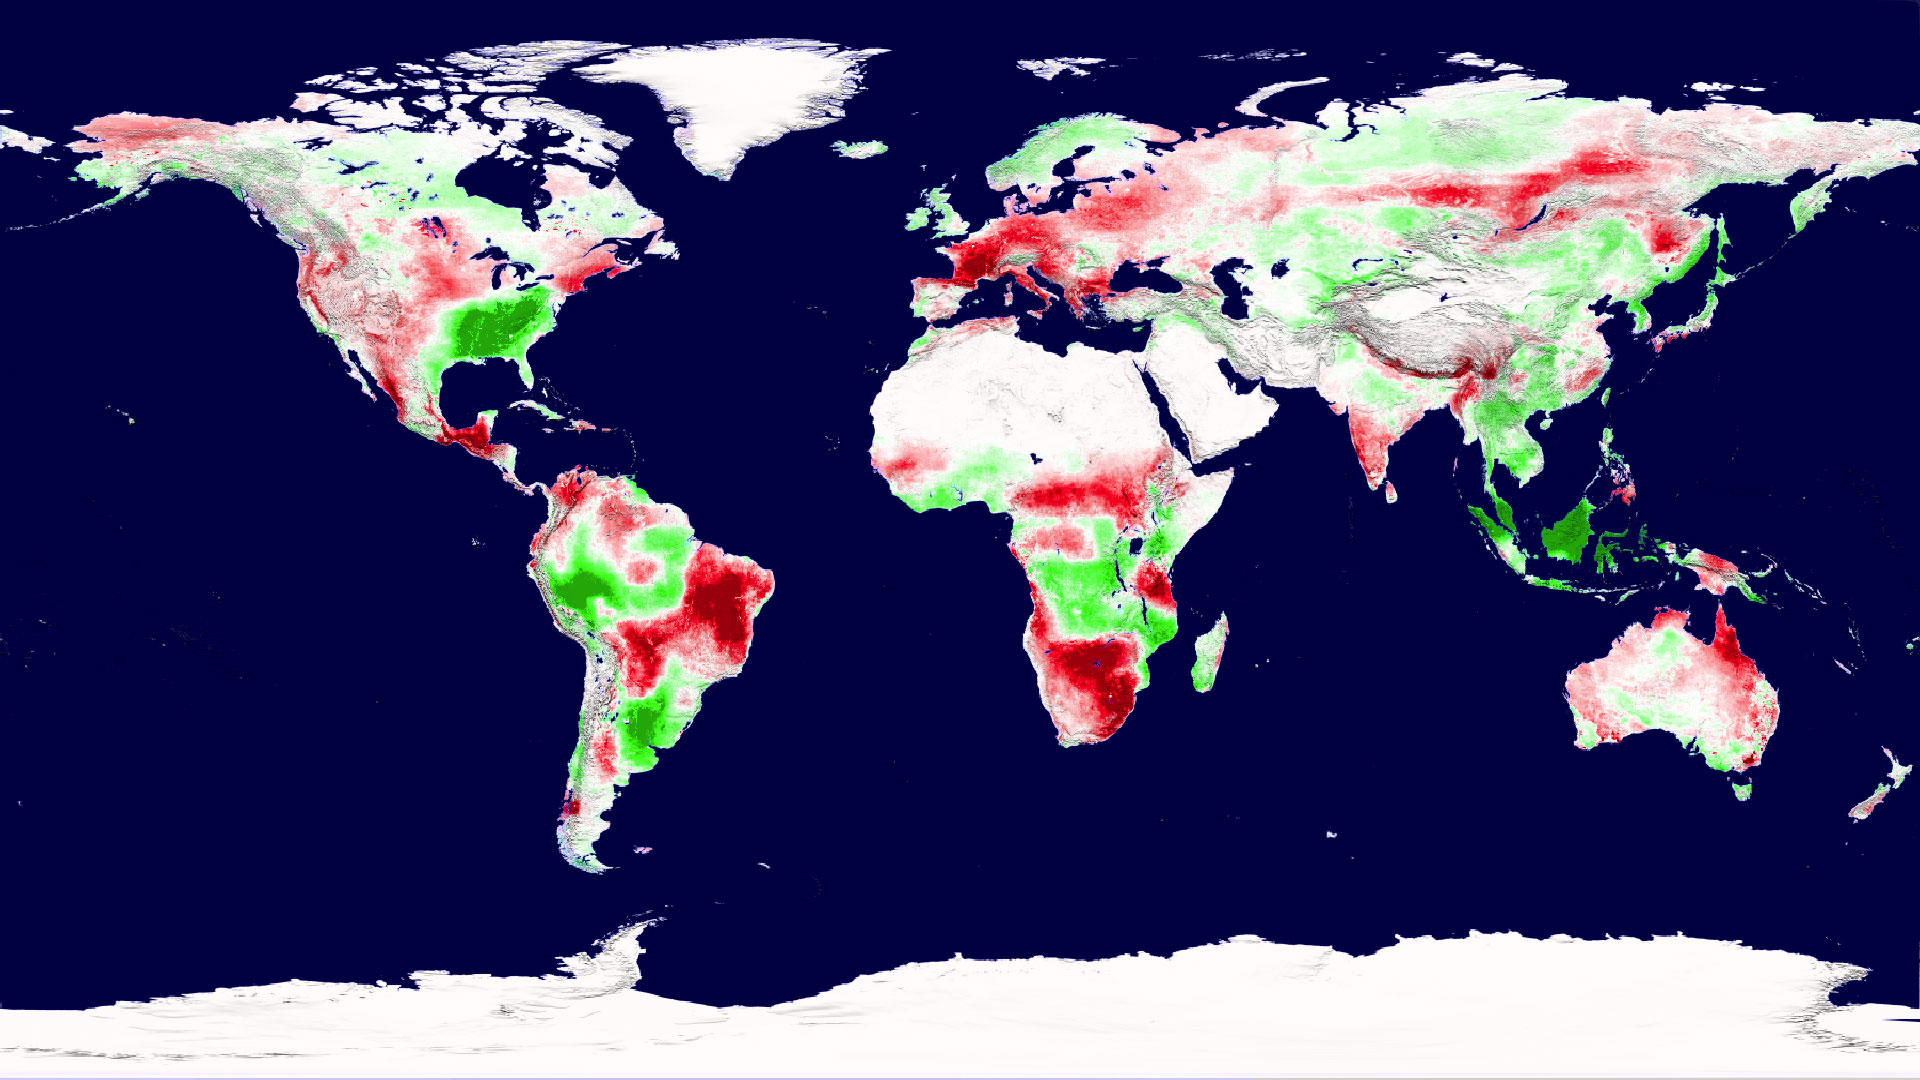
Caption: A snapshot of Earth's plant productivity in 2003 shows regions of increased productivity (green) and decreased productivity (red). Credit: NASA Goddard Space Flight Center Scientific Visualization Studio
[/caption]
One idea about climate change suggested that higher temperatures would boost plant growth and food production. That may have been a trend for awhile, where plant growth flourished with a longer growing season, but the latest analysis of satellite data shows that rising global temperatures has reached a tipping point where instead of being beneficial, higher temperatures are causing drought, which is now decreasing plant growth on a planetary scale. This could impact food security, biofuels, and the global carbon cycle. “This is a pretty serious warning that warmer temperatures are not going to endlessly improve plant growth,” said Steven Running from the University of Montana.
During the 1980s and 1990s global terrestrial plant productivity increased as much as six percent. Scientists say that happened because during that time, temperature, solar radiation and water availability — influenced by climate change — were favorable for growth.
During the past ten years, the decline in global plant growth is slight – just one percent. But it may signify a trend.
Interannual shifts in plant productivity (green line) fluctuated in step with shifts in atmospheric carbon dioxide (red line) between 2000 through 2009. Credit: Maosheng Zhao and Steven Running
“These results are extraordinarily significant because they show that the global net effect of climatic warming on the productivity of terrestrial vegetation need not be positive — as was documented for the 1980’s and 1990’s,” said Diane Wickland, of NASA Headquarters and manager of NASA’s Terrestrial Ecology research program.
A 2003 paper in Science led by then University of Montana scientist Ramakrishna Nemani (now at NASA Ames Research Center, Moffett Field, Calif.) showed that land plant productivity was on the rise.
Running and co-author Maosheng Zhao originally set out to update Nemani’s analysis, expecing to see similar results as global average temperatures have continued to climb. Instead, they found that the impact of regional drought overwhelmed the positive influence of a longer growing season, driving down global plant productivity between 2000 and 2009.
The discovery comes from an analysis of plant productivity data from the Moderate Resolution Imaging Spectroradiometer (MODIS) on NASA’s Terra satellite, combined with growing season climate variables including temperature, solar radiation and water. The plant and climate data are factored into an algorithm that describes constraints on plant growth at different geographical locations.
For example, growth is generally limited in high latitudes by temperature and in deserts by water. But regional limitations can vary in their degree of impact on growth throughout the growing season.
Zhao and Running’s analysis showed that since 2000, high-latitude northern hemisphere ecosystems have continued to benefit from warmer temperatures and a longer growing season. But that effect was offset by warming-associated drought that limited growth in the southern hemisphere, resulting in a net global loss of land productivity.
“This past decade’s net decline in terrestrial productivity illustrates that a complex interplay between temperature, rainfall, cloudiness, and carbon dioxide, probably in combination with other factors such as nutrients and land management, will determine future patterns and trends in productivity,” Wickland said.
The researchers plan on maintaining a record of the trends into the future. For one reason, plants act as a carbon dioxide “sink,” and shifting plant productivity is linked to shifting levels of the greenhouse gas in the atmosphere. Also, stresses on plant growth could challenge food production.
“The potential that future warming would cause additional declines does not bode well for the ability of the biosphere to support multiple societal demands for agricultural production, fiber needs, and increasingly, biofuel production,” Zhao said.
“Even if the declining trend of the past decade does not continue, managing forests and croplands for multiple benefits to include food production, biofuel harvest, and carbon storage may become exceedingly challenging in light of the possible impacts of such decadal-scale changes,” Wickland said.
The team published their findings Aug. 20 in Science.
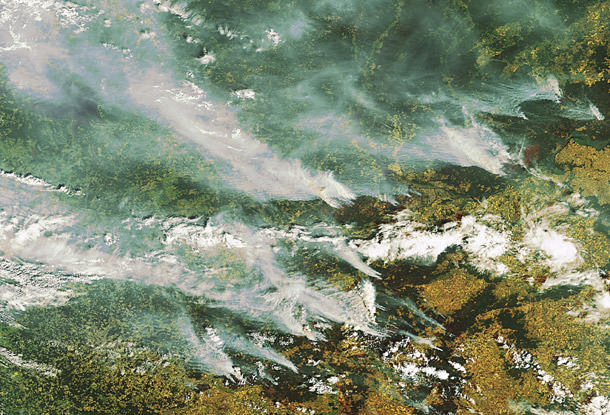
Wildfires in Russia as seen from space by ESA's Envisat satellite. Credit: ESA
[/caption]
Massive rains in Pakistan, China and Iowa in the US. Drought, heat and unprecedented fires in Russia and western Canada. 2010 is going down as the year of crazy, extreme weather. Is this just a wacky year or a trend of things to come? According to meteorologists, unusual holding patterns in the jet stream in the northern hemisphere are to blame for the extreme weather in Pakistan and Russia. But also, the World Meteorological Organization and other scientists say this type of weather fits patterns predicted by climate scientists, and could be the result of climate change.
“All these things are the kinds of things we would expect to happen as the planet warms up,” said Tom Wagner, a NASA scientist who studies the cryosphere, during an interview on CNN on August 11. “And we are seeing that the planet is warming about .35 degrees per decade. Places like Greenland are warming even faster, like 3.5 degrees per decade. And all these events from heat waves to stronger monsoons, to loss of ice are all consistent with that. Where it gets a little tricky is assigning any specific event to say, the cause of this event is definitely global warming, that is where we get to the edge of the research.”
“This weather is very unusual but there are always extremes every year,” said Andrew Watson from the University of East Anglia’s Environmental Studies. “We can never say that weather in a single year is unequivocal evidence of climate change, if you get many years of extreme weather then that can point to climate change.”
The Intergovernmental Panel on Climate Change (IPCC) has long predicted that rising global temperatures would produce more frequent and intense heat waves, and more severe rainfalls. In its 2007 report, the panel said these trends have already been observed, with an increase in heat waves since 1950, for example.
NOAA measurements show that the combined global surface temperatures for June 2010 are the warmest on record, and Wagner said there are larger conclusions to be drawn from the definite global warming trend. “We are seeing things that haven’t really happened before on the planet, like warming at this specific rate. We think it is very well tied to increasing carbon dioxide in the atmosphere since the late 1800’s caused by humans.”
This graph, based on the comparison of atmospheric samples contained in ice cores and more recent direct measurements, provides evidence that atmospheric CO2 has increased since the Industrial Revolution. (Source: NOAA)
“Not just over 10 years, but we have satellites images, weather station records and other good records going back to the late 1800’s that tells us all about how the planet is warming up,” Wagner said. “Not only that but we have evidence from geologic records, ice cores, and sediment cores from ocean cores. All of this feeds together to show us how the planet is changing.”
Asked if the cycle can be reversed, Wagner replied, “That is the million dollar question. One thing we have to think about is that the planet is changing and we have to deal with that. Ice around Antarctica and Greenland is melting. Sea level is rising right now at 3 millimeters a year. If you just extrapolate that to 100 years, it will rise to at least a foot of sea level rise. But there is the possibility it could be more than that. These are the types of things we need to think about and come up with mitigation strategies to deal with them. We’re doing the research to try and nail down these questions a little more tightly to see how much sea level is going to rise, how much temperatures are going to rise and how are weather patterns going to change.”
Reducing emissions is one thing that everyone can do to help protect the planet and the climate, and climate experts have been saying for years that there needs to be sharp cutbacks in emissions of carbon dioxide and other heat-trapping gases that go into the atmosphere from automobiles, power plants, and other fossil fuel-burning industrial and residential sources.
In the news this week was the huge ice chunk coming loose from a Greenland glacier. Not only is this an indication of warming water, but other problems could develop, such as the large ice chunks getting in the way of shipping lanes or heading towards oil rigs. The high temperatures and fires in Russia are affecting big percentage of the world’s wheat production, and could have an effect on our food supply this coming year.
Not only that, but the wildfires have created a noxious soup of air pollution that is affecting life far beyond just the local regions, JPL reports. Among the pollutants created by wildfires is carbon monoxide, a gas that can pose a variety of health risks at ground level. Carbon monoxide is also an ingredient in the production of ground-level ozone, which causes numerous respiratory problems. As the carbon monoxide from these wildfires is lofted into the atmosphere, it becomes caught in the lower bounds of the mid-latitude jet stream, which swiftly transports it around the globe.
Two movies were created using continuously updated data from the “Eyes on the Earth 3-D” feature, also on NASA’s global climate change website. They show three-day running averages of daily measurements of carbon monoxide present at an altitude of 5.5 kilometers (18,000) feet, along with its global transport.
And in case you are wondering, the recent solar flares have nothing to do with the wildfires — as Ian O’Neill from Discovery space deftly points out.
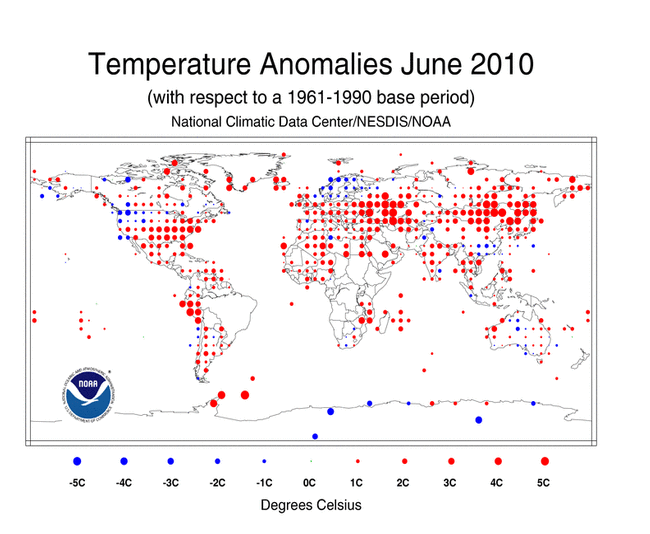
June Land Surface Temperature Anomalies in degrees Celsius. Credit: NOAA
[/caption]
Was last month warm where you live? If so, you weren’t alone. According measurements taken by the National Oceanic and Atmospheric Administration (NOAA) June 2010 was the hottest June on record worldwide. But this is not a new trend, at least for this year. March, April, and May 2010 were also the warmest on record. This was also the 304th consecutive month with a global temperature above the 20th century average. The last month with below-average temperature was February 1985.
Here are some of the numbers:
* The combined global land and ocean average surface temperature for June 2010 was the warmest on record at 16.2°C (61.1°F), which is 0.68°C (1.22°F) above the 20th century average of 15.5°C (59.9°F). The previous record for June was set in 2005.
* The June worldwide averaged land surface temperature was 1.07°C (1.93°F) above the 20th century average of 13.3°C (55.9°F)—the warmest on record.
* It was the warmest April–June (three-month period) on record for the global land and ocean temperature and the land-only temperature. The three-month period was the second warmest for the world’s oceans, behind 1998.
* It was the warmest June and April–June on record for the Northern Hemisphere as a whole and all land areas of the Northern Hemisphere.
* It was the warmest January–June on record for the global land and ocean temperature. The worldwide land on average had its second warmest January–June, behind 2007. The worldwide averaged ocean temperature was the second warmest January–June, behind 1998.
* Sea surface temperature (SST) anomalies in the central and eastern equatorial Pacific Ocean continued to decrease during June 2010. According to NOAA’s Climate Prediction Center, La Niña conditions are likely to develop during the Northern Hemisphere summer 2010.
Some regions on the planet, however, had cool temps for a northern hemisphere summer. Spain had its coolest June temperatures since 1997, and Guizhou in southern China had its coolest June since their records began in 1951.
Still, with those cool temperatures, the planet on the whole was warmer.
Arctic sea ice extent for June 2010 was 10.87 million square kilometers (4.20 million square miles). Credit: NSIDC
Other satellite data from the US National Snow and Ice Data Center in Colorado shows that the extent of sea ice in the Arctic was at its lowest for any June since satellite records started in 1979. The ice cover on Arctic Ocean grows each winter and shrinks in summer, reaching its annual low point in September. The monthly average for June 2010 was 10.87 km sq. The ice was declining an average of 88,000 sq km per day in June. This rate of decline is the fastest measured for June.
During June, ice extent was below average everywhere except in the East Greenland Sea, where it was near average.

 fluctuated in step with shifts in atmospheric carbon dioxide (red line) between 2000 through 2009. Credit: Maosheng Zhao and Steven Running")
")
. Credit: NSIDC")