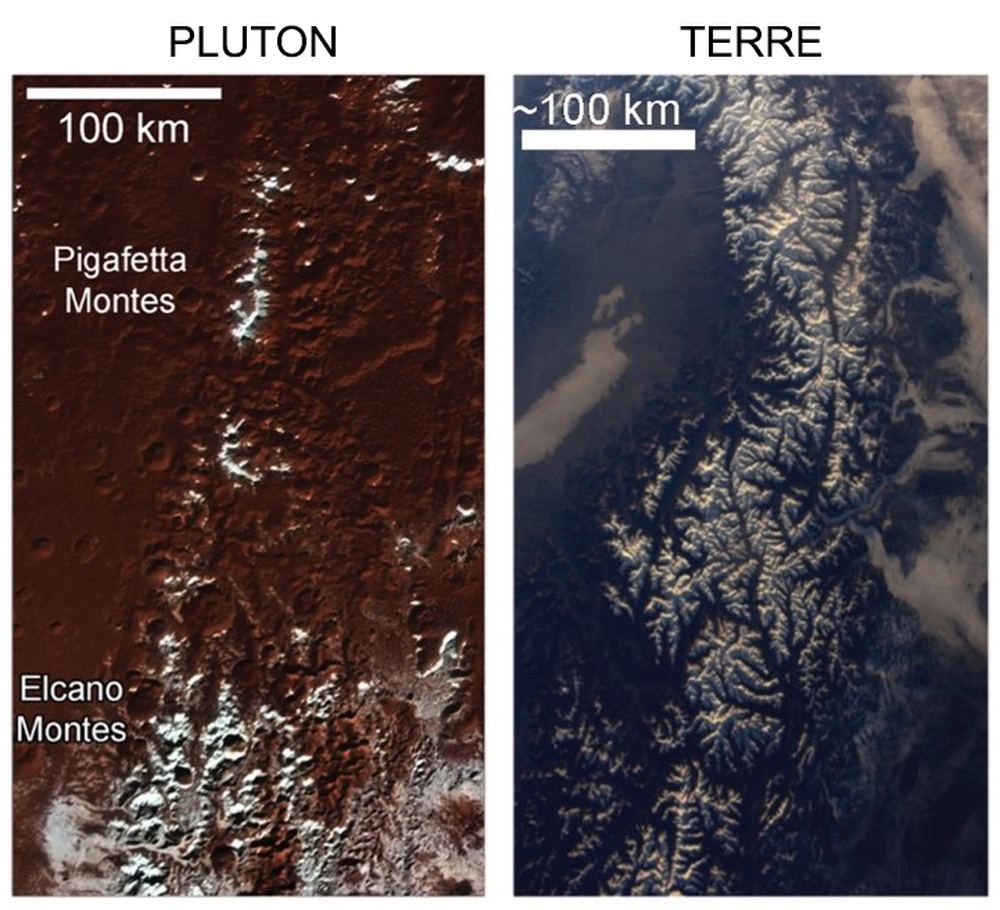
We can thank NASA’s New Horizons spacecraft for opening our eyes up to Pluto’s complexity. On July 14th, 2015, the spacecraft came within 12,500 km (7,800 mi) of the dwarf planet. During the flyby, New Horizons was able to characterize Pluto’s atmosphere and its surface.
Among the things New Horizons saw was a region of snowcapped mountains.
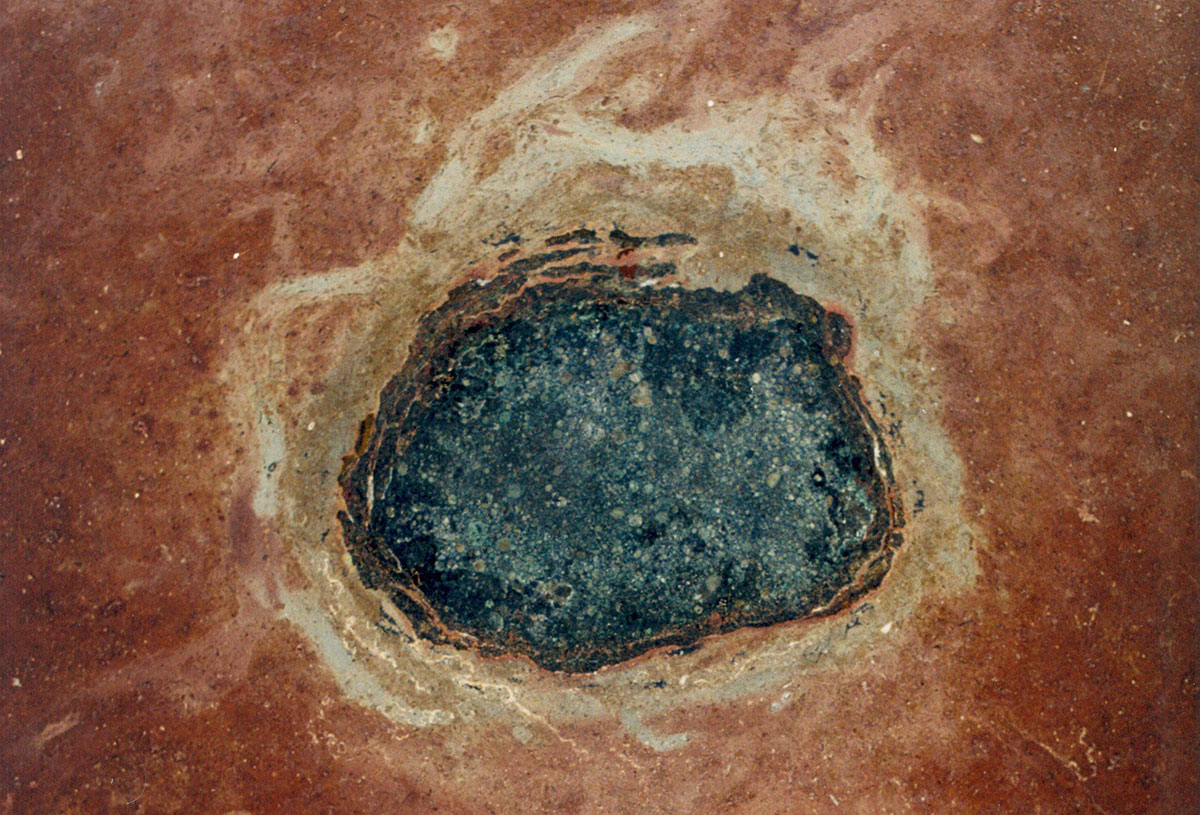
Fossil meteorites from the mid-Ordovician period, around 460 million years ago, indicate that Earth may have been hit by debris from an asteroid collision at that time. Image credit - Birger Schmitz
Comets visit the inner Solar System, and leave without saying goodbye. Maybe they leave a trail of dust behind, and when the Earth passes through it, we get a pretty light show in the night sky, in the form of a meteor shower. Likewise, asteroids frequently go whizzing by, though they don’t leave us with a pyrotechnic display.
Sometimes these rocky interlopers head straight for Earth. And when they do, the results can be cataclysmic, like when an asteroid struck Earth about 66 million years ago, wiping out the dinosaurs and 75% of life on Earth. Other times, it’s not quite as cataclysmic, but still devastating, like in about 2350 BC, when debris from a disintegrating comet may have caused the collapse of an ancient empire.
But regardless of the severity of any of these individual events, the conclusion is crystal clear: Earth’s history is intertwined with the coming and going of space rocks. The evidence is all around us, sort of.
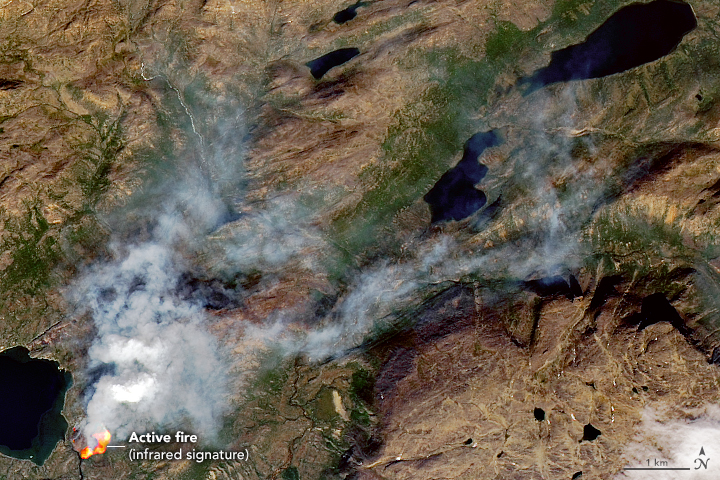
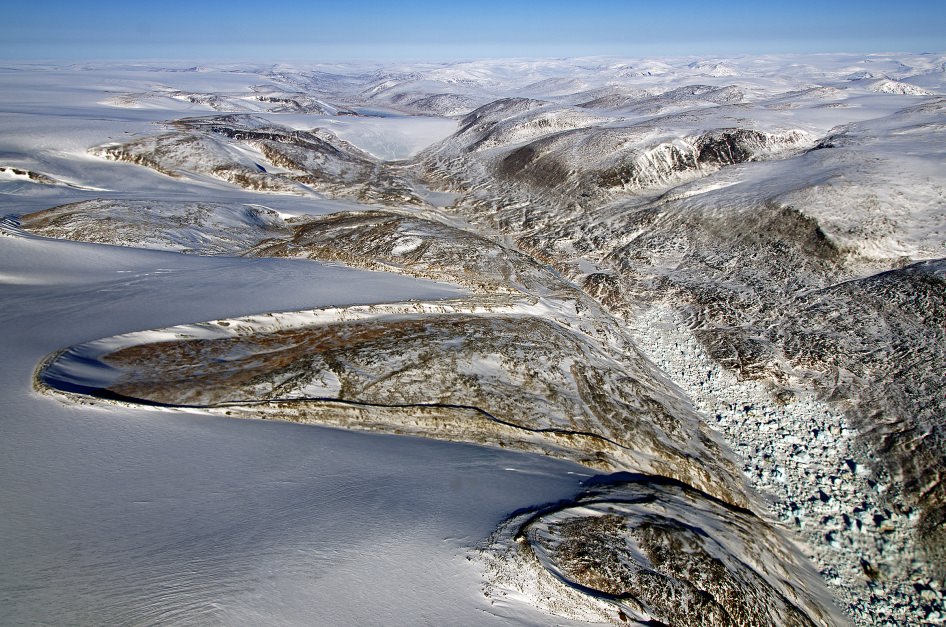
This fire in Greenland is near Sisimiut, in Western Greenland. It was likely caused by a hiker. Image Credit: NASA Earth Observatory
As global warming ramps up, expect to see Greenland in the news a lot. That’s because its ice sheet is under threat of melting. But that’s not the only reason. The other reason is fire.
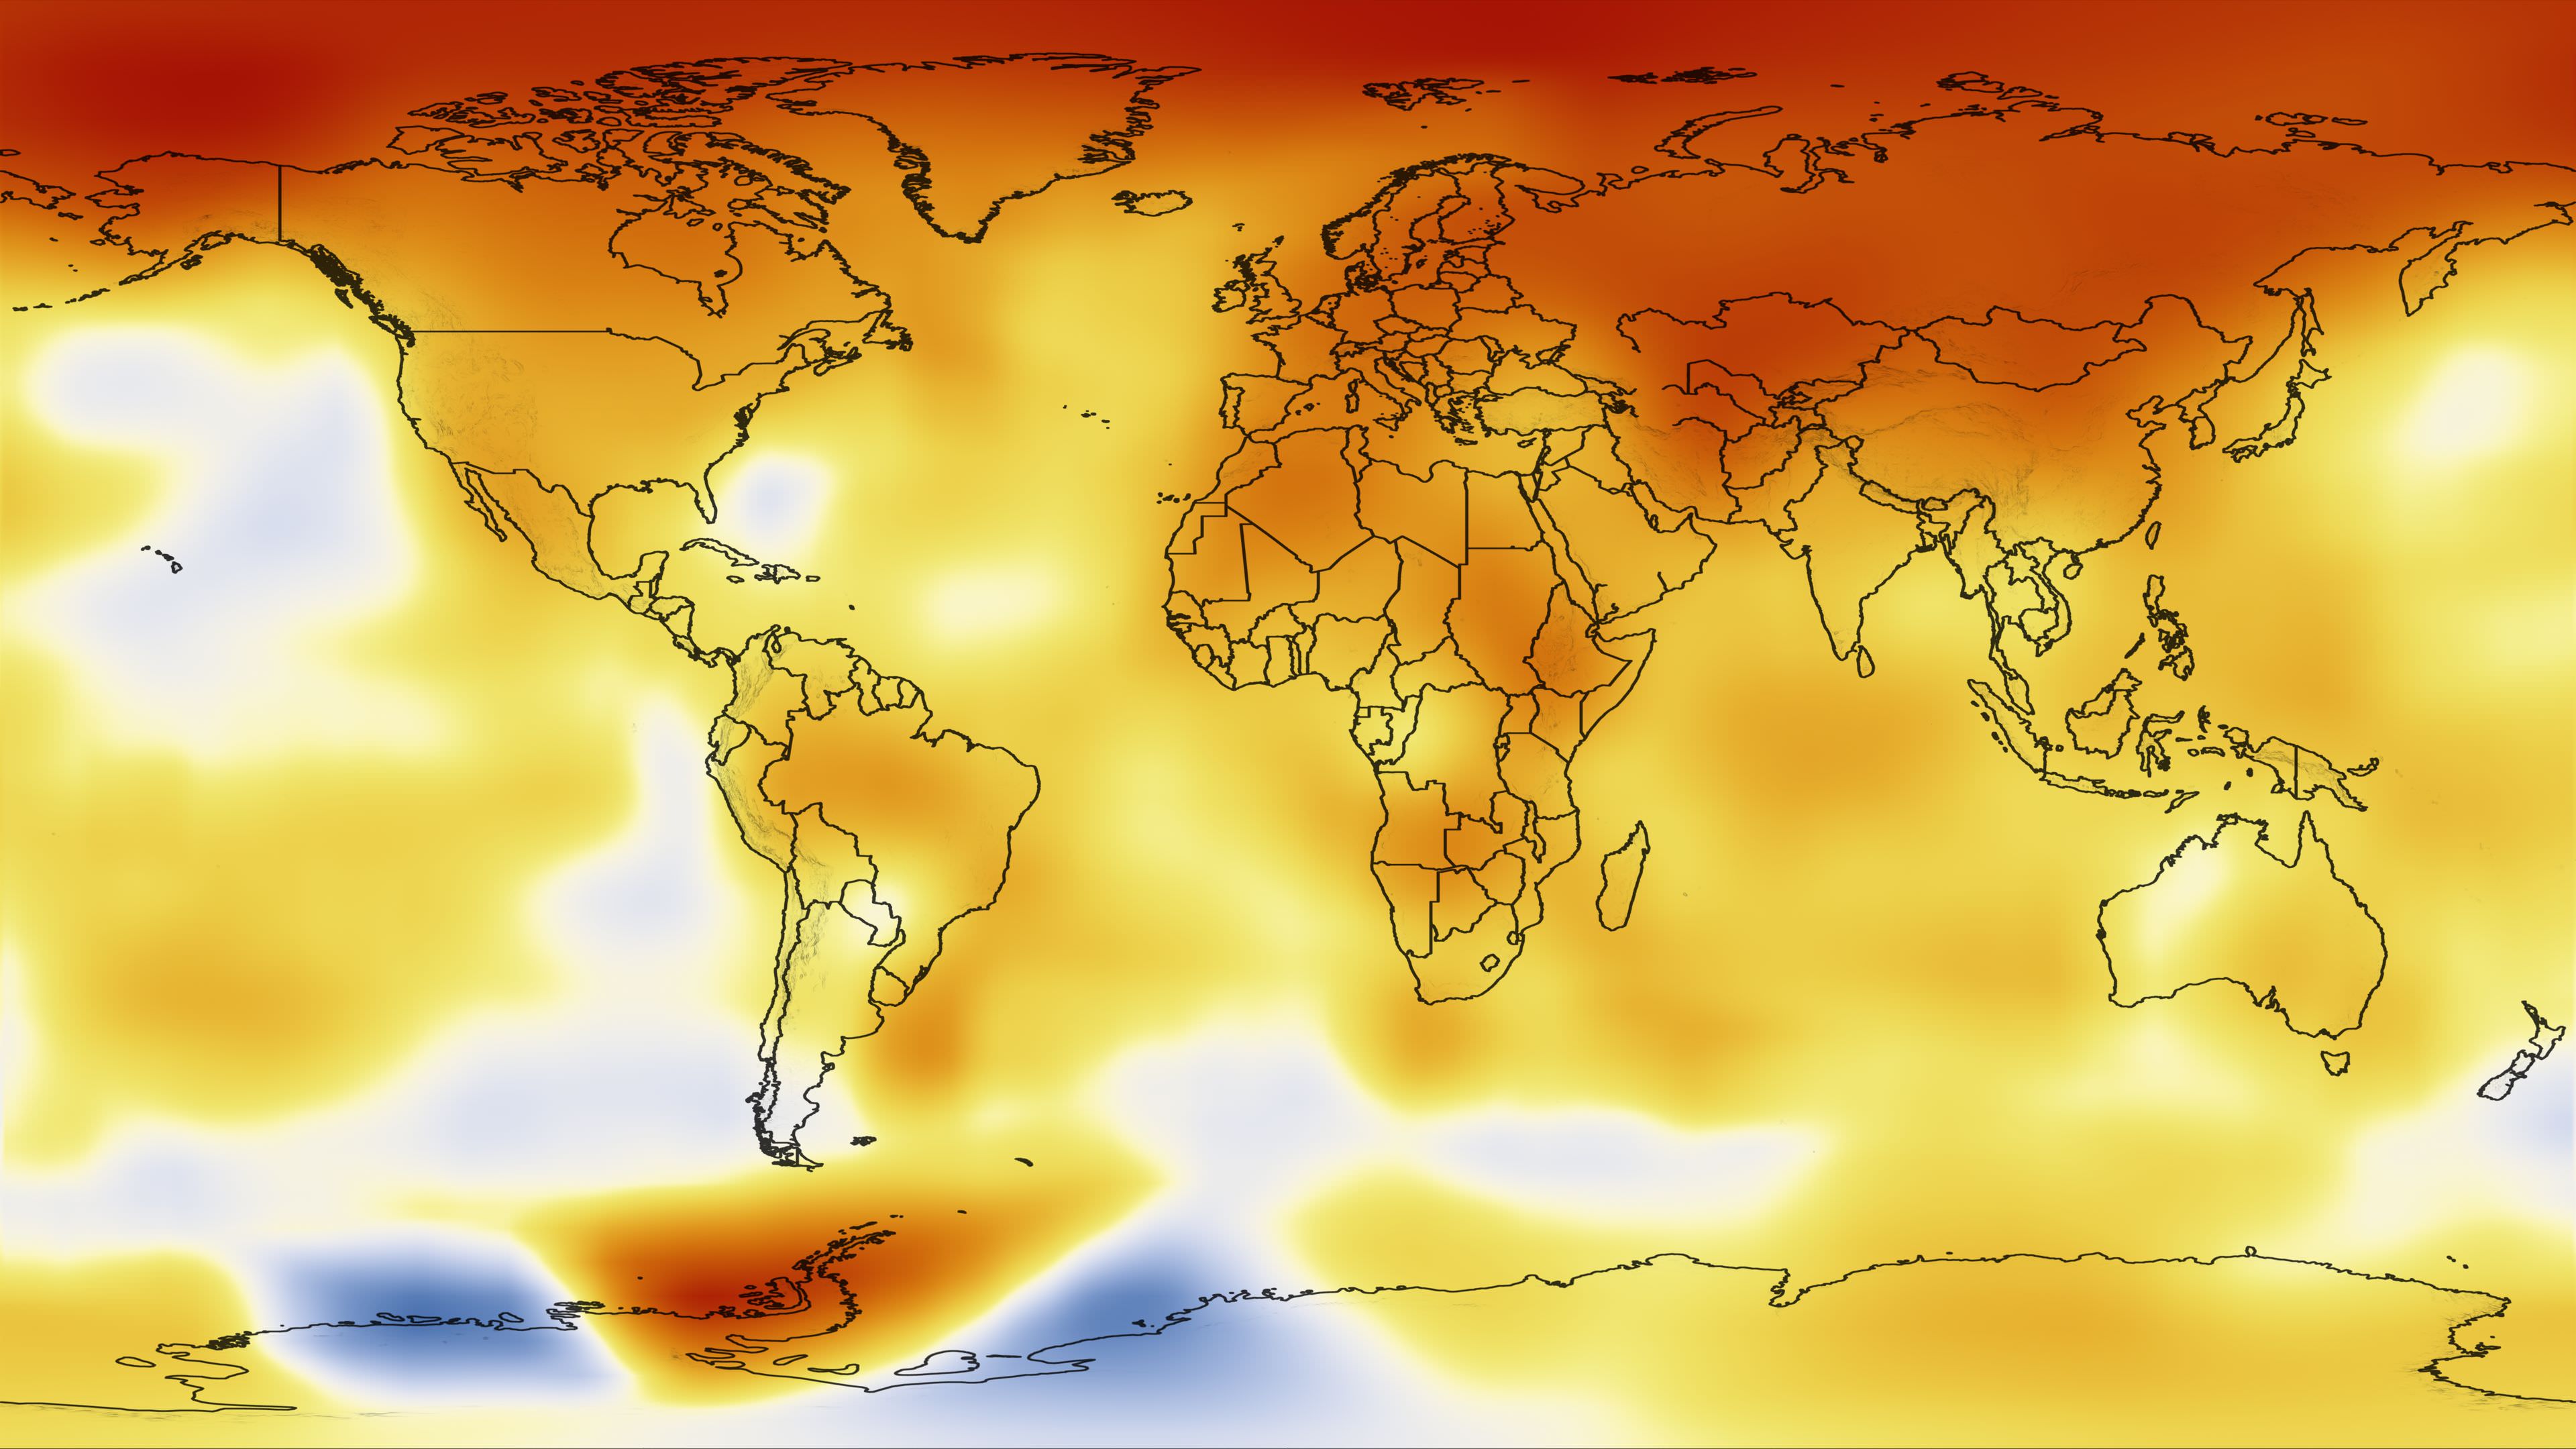
The map shows temperature changes for the last decade—January 2000 to December 2009—relative to the 1951-1980 mean. Credit: NASA
There are a handful of major science institutions around the world that keep track of the Earth’s temperature. They all clearly show that the world’s temperature has risen in the past few decades. One of those institutions is NASA.
It’s cold right now. Okay, fine, here on Vancouver Island, it’s actually pretty warm. But for the rest of Canada and big parts of the US, it’s terrifyingly cold. Colder than Mars or the North Pole cold. This is all thanks to the break up of the polar vortex. What are polar vertices, how do they form, and where else to we find them in the Solar System?
25 years of satellite data from the European Space Agency show the rate at which Earth is losing its ice speeding up. Image Credit: ESA
The rate at which Greenland is losing its ice is accelerating. This unsurprising conclusion comes from a new study based on 25 years of satellite data from the European Space Agency. The new study was published in Earth and Planetary Science Letters. Continue reading “Ice loss in Greenland is Accelerating”
Our beautiful, precious, life-supporting Earth as seen on July 6, 2015 from a distance of one million miles by a NASA scientific camera aboard the Deep Space Climate Observatory spacecraft. Credits: NASA
If climate change models are correct, humanity is working itself—and dragging the rest of life on Earth with it—into a corner. Scientific pleas to control emissions and battle climate change are starting to have some effect, but not enough. So now we have some tough decisions looming.
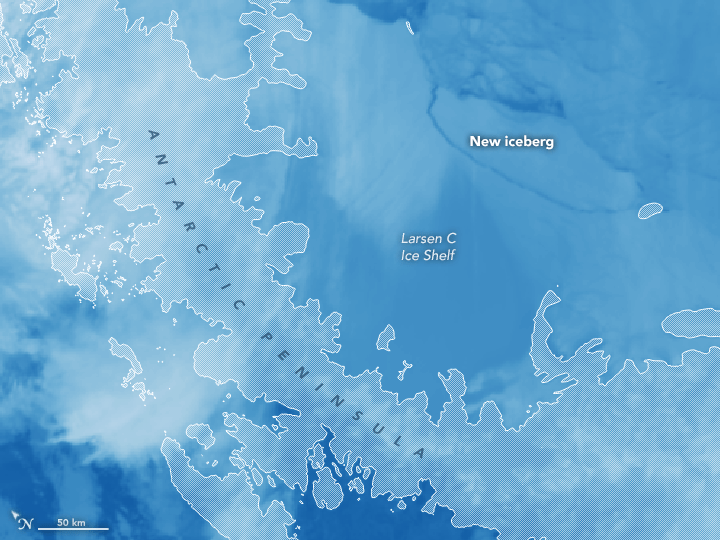
The Moderate Resolution Imaging Spectroradiometer (MODIS) on NASA’s Aqua satellite captured this image of the gigantic new iceberg on July 12, 2017. NASA Earth Observatory image by Joshua Stevens, using MODIS data from LANCE/EOSDIS Rapid Response.
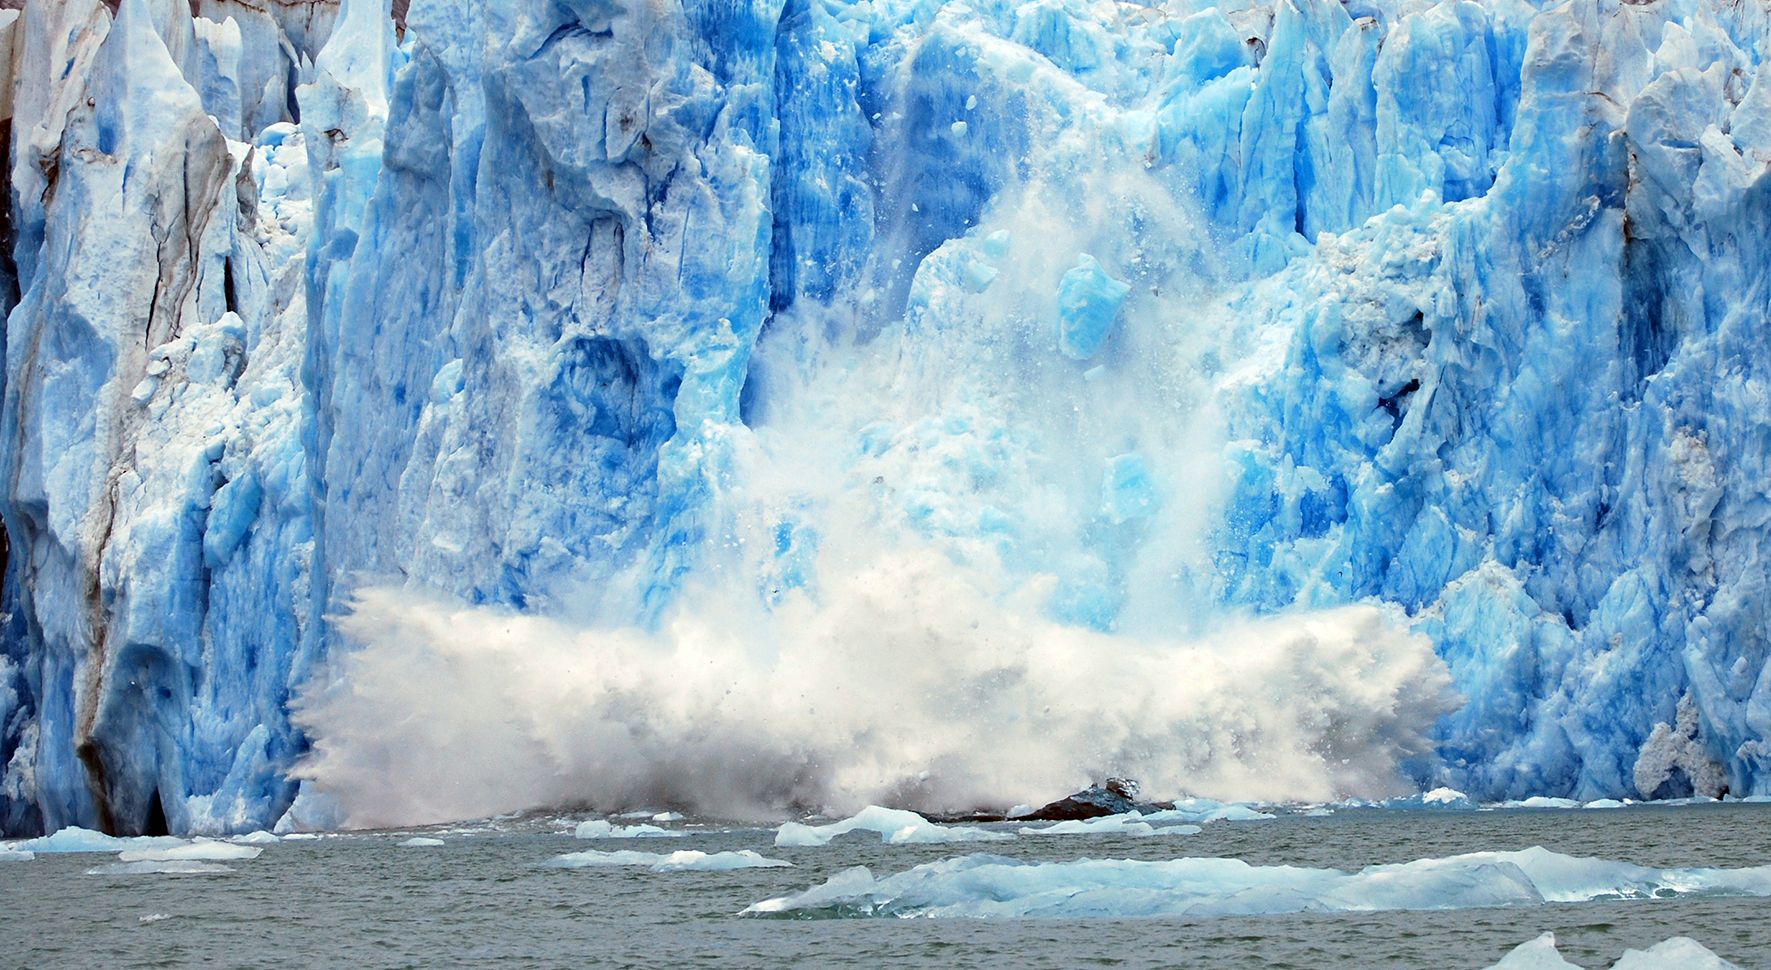
For several months, scientists have been keeping an eye on a piece of Antarctica’s Larsen C ice shelf, waiting for the inevitable. And now it has happened.
Sometime between July 10 and July 12, 2017 a trillion ton iceberg split off, “changing the outline of the Antarctic Peninsula forever,” said one scientist.
The new iceberg is now called A68, and at 2,240 square miles (5,800 square km) it is one of the biggest ever recorded, about the size of Delaware in the US, or twice the size of Luxembourg.
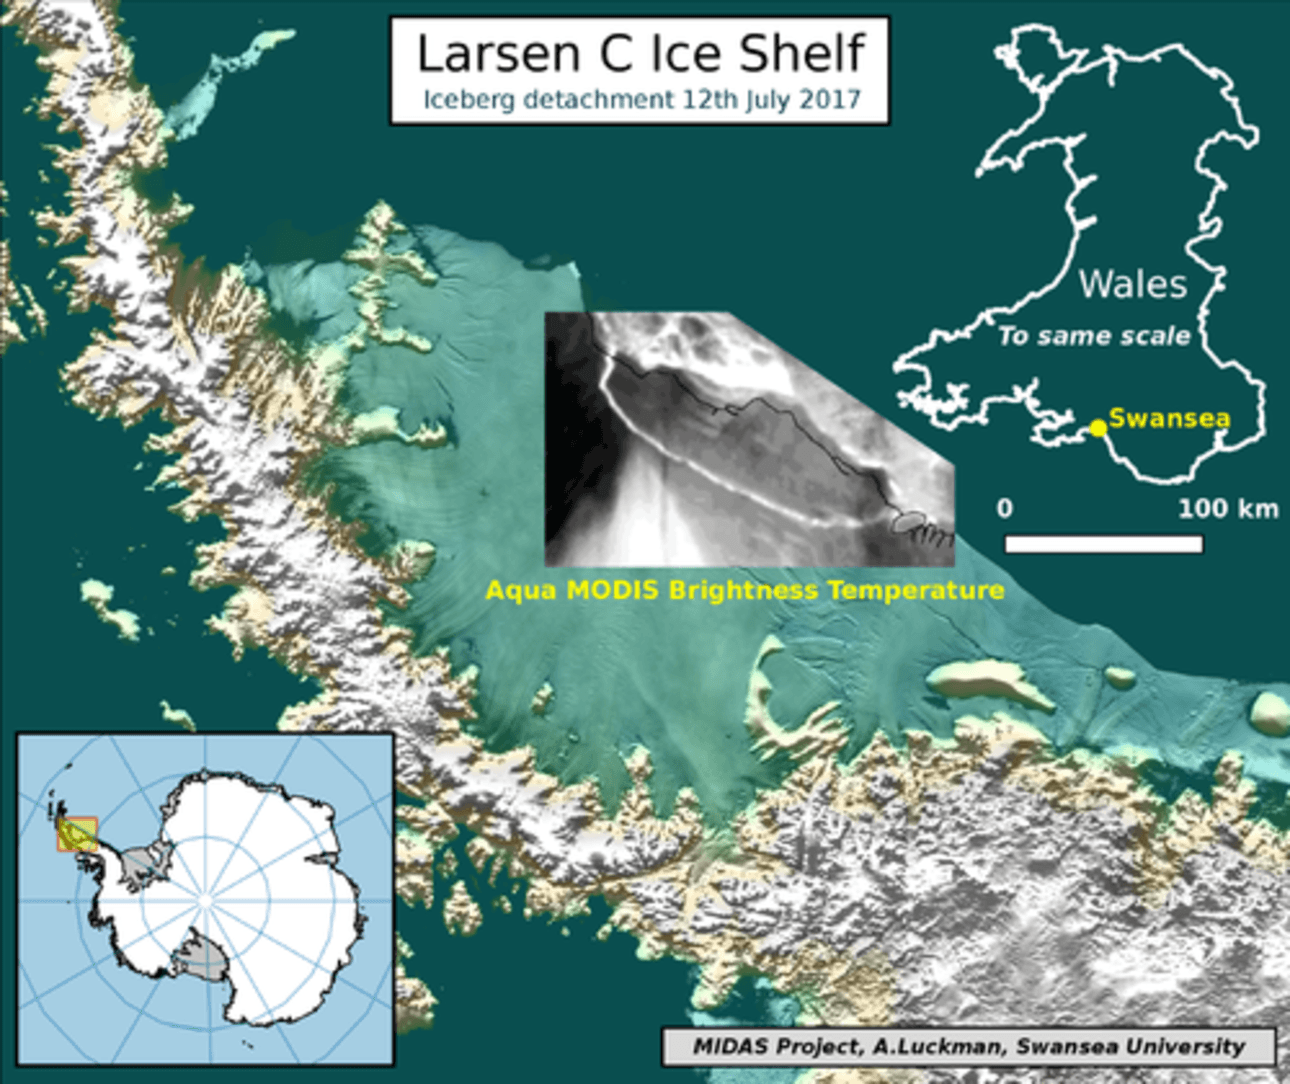
A fissure on the ice shelf first appeared several years ago, but seemed relatively stable until January 2016, when it began to lengthen. In January 2017 alone, the crack grew by 20 km, reaching a total length of about 175 km.
Witnessed by the Copernicus Sentinel-1 mission on 12 July 2017, a large iceberg has broken off the Larsen-C ice shelf, one of the largest icebergs on record. Credit: Modified Copernicus Sentinel data (2017), processed by ESA.
The calving of the iceberg was confirmed by the Visible Infrared Imaging Radiometer Suite (VIIRS) on the Suomi NPP satellite and was reported this morning by Project MIDAS, an Antarctic research project based in the UK.
The MODIS instrument on NASA’s Aqua satellite also confirmed the complete separation of the iceberg.
Larsen C is a floating platform of glacial ice on the east side of the Antarctic Peninsula, is the fourth largest ice shelf ringing Earth’s southernmost continent. With the break-off of this iceberg, the Larsen C shelf area has shrunk by approximately 10 percent.
Some scientists say the Larsen C rift and iceberg calving is not a warning of imminent sea level rise, and linking climate change to this specific event is complicated. Adrian Luckman, Professor of Glaciology and Remote Sensing from Swansea University wrote a detailed explanation of this for The Conversation.
The new iceberg would barely fit inside Wales. Credit: Adrian Luckman / MIDAS
David Vaughan, glaciologist and Director of Science at British Antarctic Survey (BAS), said, “Larsen C itself might be a result of climate change, but, in other ice shelves we see cracks forming, which we don’t believe have any connection to climate change. For instance on the Brunt Ice Shelf where BAS has its Halley Station, there those cracks are a very different kind which we don’t believe have any connection to climate change.”
While Vaughan said they see no obvious signal that climate warming is causing the whole of Antarctica to break up, he added that there is little doubt that climate change is causing ice shelves to disappear in some parts of Antarctica at the moment.
“Around the Antarctic Peninsula, where we saw several decades of warming through the latter half of the 20th century, we have seen these ice shelves collapsing and ice loss increasing,” he said. “There are other parts of the Antarctica that which are losing ice to the oceans but those are affected less by atmospheric warming and more by ocean change.
Scientists said the loss of such a large piece is of interest because ice shelves along the peninsula play an important role in ‘buttressing’ glaciers that feed ice seaward, effectively slowing their flow.
“The interesting thing is what happens next, how the remaining ice shelf responds,” said Kelly Brunt, a glaciologist with NASA’s Goddard Space Flight Center in Greenbelt, Maryland, and the University of Maryland in College Park. “Will the ice shelf weaken? Or possibly collapse, like its neighbors Larsen A and B? Will the glaciers behind the ice shelf accelerate and have a direct contribution to sea level rise? Or is this just a normal calving event?”
The U.S. National Ice Center will monitor the trajectory of the new iceberg, but they don’t expect it to travel far very fast, and it shouldn’t cause any immediate problems for navigation of ships.
Artist's impression of ice age Earth at glacial maximum. Credit: Wikipedia Commons/Ittiz
Scientists have known for some time that the Earth goes through cycles of climatic change. Owing to changes in Earth’s orbit, geological factors, and/or changes in Solar output, Earth occasionally experiences significant reductions in its surface and atmospheric temperatures. This results in long-term periods of glaciation, or what is more colloquially known as an “ice age”.
These periods are characterized by the growth and expansion of ice sheets across the Earth’s surface, which occurs every few million years. By definition we are still in the last great ice age – which began during the late Pliocene epoch (ca. 2.58 million years ago) – and are currently in an interglacial period, characterized by the retreat of glaciers.
Definition:
While the term “ice age” is sometime used liberally to refer to cold periods in Earth’s history, this tends to belie the complexity of glacial periods. The most accurate definition would be that ice ages are periods when ice sheets and glaciers expand across the planet, which correspond to significant drops in global temperatures and can last for millions of years.
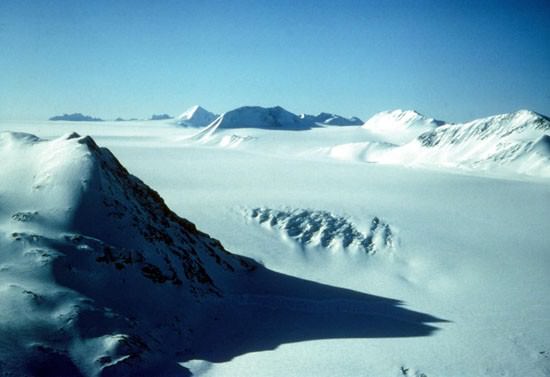
The Antarctic ice sheet, which expanded during the last ice age. Credit: Wikipedia Commons/Stephen Hudson
During an ice age, there are significant temperature differences between the equator and the poles, and temperatures at deep-sea levels have also been shown to drop. This allows for large glaciers (comparable to continents) to expand, covering much of the surface area of the planet. Since the Pre-Cambrian Era (ca. 600 million years ago), ice ages have occurred at widely space intervals about about 200 million years.
History of Study:
The first scientist to theorize about past glacial periods was the 18th century Swiss engineer and geographer Pierre Martel. In 1742, while visiting an Alpine valley, he wrote about the dispersal of large rocks in erratic formations, which the locals attributed to the glaciers having once extended much further. Similar explanations began to emerge in the ensuing decades for similar patterns of boulder distribution in other parts of he world.
From the middle of the 18th century onward, European scholars increasingly began to contemplate ice as a means of transporting rocky material. This included the presence of boulders in coastal areas in the Baltic states and the Scandinavian peninsula. However, it was Danish-Norwegian geologist Jens Esmark (1762–1839) who first argued the existence of a sequence of world wide ice ages.
This theory was detailed in a paper he published in 1824, in which he proposed that changes in Earth’s climate (which were due to changes in its orbit) were responsible. This was followed in 1832 by German geologist and forestry professor Albrecht Reinhard Bernhardi speculating about how the polar ice caps may have once reached as far as the temperate zones of the world.
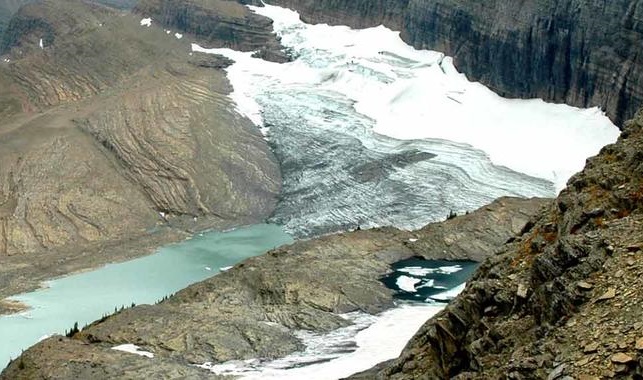
Overlook of the Grinnell Glacier in Glacier National Park, Montana. Credit: USGS
At this same time, German botanist Karl Friedrich Schimper and Swiss-American biologist Louis Agassiz began independently developing their own theory about global glaciation, which led toSchimper coining the term “ice age” in 1837. By the late 19th century, ice age theory gradually began to gain widespread acceptance over the notion that the Earth cooled gradually from its original, molten state.
By the 20th century, Serbian polymath Milutin Milankovic developed his concept of Milankovic cycles, which linked long-term climate changes to periodic changes in the Earth’s orbit around the Sun. This offered a demonstrable explanation for ice ages, and allowed scientists to make predictions about when significant changes in Earth’s climate might occur again.
Evidence for Ice Ages:
There are three forms of evidence for ice age theory, which range from the geological and the chemical to the paleontological (i.e. the fossil record). Each has its particular benefits and drawbacks, and has helped scientists to develop a general understanding of the effect ice ages have had on geological record for the past few billion years.
Geological: Geological evidence includes rock scouring and scratching, carved valleys, the formation of peculiar types of ridges, and the deposition of unconsolidated material (moraines) and large rocks in erratic formations. While this sort of evidence is what led to ice age theory in the first place, it remains temperamental.
For one, successive glaciation periods have different effects on a region, which tends to distort or erase geological evidence over time. In addition, geological evidence is difficult to date exactly, causing problems when it comes to getting an accurate assessment of how long glacial and interglacial periods have lasted.
Horseshoe-shaped lateral moraines at the margin of the Penny Ice Cap on Baffin Island, Nunavut, Canada. Lateral moraines are accumulations of debris along the sides of a glacier formed by material falling from the valley wall. Credit: NASA/Michael Studinger
Chemical: This consists largely of variations in the ratios of isotopes in fossils discovered in sediment and rock samples. For more recent glacial periods, ice cores are used to construct a global temperature record, largely from the presence of heavier isotopes (which lead to higher evaporation temperatures). They often contain bubbles of air as well, which are examined to assess the composition of the atmosphere at the time.
Limitations arise from various factors, however. Foremost among these are isotope ratios, which can have a confounding effect on accurate dating. But as far as the most recent glacial and interglacial periods are concerned (i.e. during the past few million years), ice core and ocean sediment core samples remain the most trusted form of evidence.
Paleontological: This evidence consists of changes in the geographical distribution of fossils. Basically, organisms that thrive in warmer conditions become extinct during glacial periods (or become highly restricted in lower latitudes), while cold-adapted organisms thrive in these same latitudes. Ergo, reduced amounts of fossils in higher latitudes is an indication of the spread of glacial ice sheets.
This evidence can also be difficult to interpret because it requires that the fossils be relevant to the geological period under study. It also requires that sediments over wide ranges of latitudes and long periods of time show a distinct correlation (due to changes in the Earth’s crust over time). In addition, there are many ancient organisms that have shown the ability to survive changes in conditions for millions of years.
As a result, scientists rely on a combined approach and multiple lines of evidence wherever possible.
Ice ages are characterized by a drop in average global temperatures, resulting in the expansion of ice sheets globally. Credit: NASA
Causes of Ice Ages:
The scientific consensus is that several factors contribute to the onset of ice ages. These include changes in Earth’s orbit around the Sun, the motion of tectonic plates, variations in Solar output, changes in atmospheric composition, volcanic activity, and even the impact of large meteorites. Many of these are interrelated, and the exact role that each play is subject to debate.
Earth’s Orbit: Essentially, Earth’s orbit around the Sun is subject to cyclic variations over time, a phenomenon also known as Milankovic (or Milankovitch) cycles. These are characterized by changing distances from the Sun, the precession of the Earth’s axis, and the changing tilt of the Earth’s axis – all of which result in a redistribution of the sunlight received by the Earth.
The most compelling evidence for Milankovic orbital forcing corresponds closely to the most recent (and studied) period in Earth’s history (circa. during the last 400,000 years). During this period, the timing of glacial and interglacial periods are so close to changes in Milankovic orbital forcing periods that it is the most widely accepted explanation for the last ice age.
Tectonic Plates: The geological record shows an apparent correlation between the onset of ice ages and the positions of the Earth’s continents. During these periods, they were in positions which disrupted or blocked the flow of warm water to the poles, thus allowing ice sheets to form.
The Earth’s Tectonic Plates. Credit: msnucleus.org
This in turn increased the Earth’s albedo, which reduces the amount of solar energy absorbed by the Earth’s atmosphere and crust. This resulted in a positive feedback loop, where the advance of ice sheets further increased the Earth’s albedo and allowed for more cooling and more glaciation. This would continue until the onset of a greenhouse effect ended the period of glaciation.
Based on past ice-ages, three configurations have been identified that could lead to an ice age – a continent sitting atop the Earth’s pole (as Antarctica does today); a polar sea being land-locked (as the Arctic Ocean is today); and a super continent covering most of the equator (as Rodinia did during the Cryogenian period).
In addition, some scientists believe that the Himalayan mountain chain – which formed 70 million years ago – has played a major role in the most recent ice age. By increasing the Earth’s total rainfall, it has also increased the rate at which CO² has been removed from the atmosphere (thereby decreasing the greenhouse effect). Its existence has also paralleled the long-term decrease in Earth’s average temperature over the past 40 million years.
Atmospheric Composition: There is evidence that levels of greenhouse gases fall with the advance of ice sheets and rise with their retreat. According to the “Snowball Earth” hypothesis – in which ice completely or very nearly covered the planet at least once in the past – the ice age of the late Proterozoic was ended by an increase in CO² levels in the atmosphere, which was attributed to volcanic eruptions.
Image of the Harding Ice Field on Alaska’s Kenai Peninsula. Credit: US Fish and Wildlife Service
However, there are those who suggest that increased levels of carbon dioxide may have served as a feedback mechanism, rather than the cause. For example, in 2009, an international team of scientists produced a study – titled “The Last Glacial Maximum” – that indicated that an increase in solar irradiance (i.e. energy absorbed from the Sun) provided the initial change, whereas greenhouse gases accounted for the magnitude of change.
Major Ice Ages:
Scientists have determined that at least five major ice ages took place in Earth’s history. These include the Huronian, Cryogenian, Andean-Saharan, Karoo, and the Qauternary ice ages. The Huronian Ice Age is dated to the early Protzerozoic Eon, roughly 2.4 to 2.1 billion years ago, based on geological evidence observed to the north and north-east of Lake Huron (and correlated to deposits found in Michigan and Western Australia).
The Cryogenian Ice Age lasted from roughly 850 to 630 million years ago, and was perhaps the most severe in Earth’s history. It is believed that during this period, the glacial ice sheets reached the equator, thus leading to a “Snowball Earth” scenario. It is also believed that ended due to a sudden increase in volcanic activity that triggered a greenhouse effect, though (as noted) this is subject to debate.
The Andean-Saharan Ice Age occurred during the Late Ordovician and the Silurian period (roughly 460 to 420 million years ago). As the name suggests, the evidence here is based on geological samples take from the Tassili n’Ajjer mountain range in the western Sahara, and correlated by evidence obtained from the Andean mountain chain in South America (as well as the Arabian peninsula and the south Amazon basin).
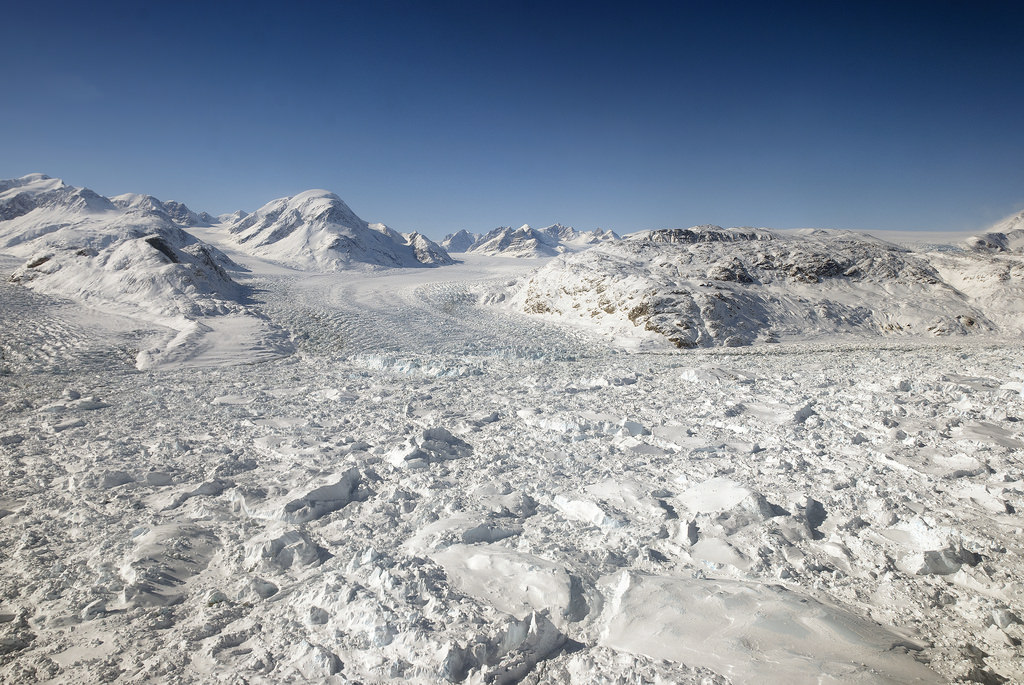
Floating ice at the calving front of Greenland’s Kangerdlugssuaq glacier, photographed in 2011 during Operation IceBridge. Credit: NASA/Michael Studinger
The Karoo Ice Age is attributed to the evolution of land plants during the onset of the Devonian period (ca. 360 to 260 million years ago) which caused a long-term increase in planetary oxygen levels and a reduction in CO² levels – leading to global cooling. It is named after sedimentary deposits that were discovered in the Karoo region of South Africa, with correlating evidence found in Argentina.
The current ice age, known as the Pliocene-Quaternary glaciation, started about 2.58 million years ago during the late Pliocene, when the spread of ice sheets in the Northern Hemisphere began. Since then, the world has experienced several glacial and interglacial periods, where ice sheets advance and retreat on time scales of 40,000 to 100,000 years.
The Earth is currently in an interglacial period, and the last glacial period ended about 10,000 years ago. What remains of the continental ice sheets that once stretched across the globe are now restricted to Greenland and Antarctic, as well as smaller glaciers – like the one that covers Baffin Island.
Anthropogenic Climate Change:
The exact role played by all the mechanisms that ice ages are attributed to – i.e. orbital forcing, solar forcing, geological and volcanic activity – are not yet entirely understood. However, given the role of carbon dioxide and other greenhouse gas emissions, there has been a great deal of concern in recent decades what long-term effects human activity will have on the planet.
For instance, in at least two major ice ages, the Cryogenian and Karoo Ice Ages, increases and decreases in atmospheric greenhouse gases are believed to have played a major role. In all other cases, where orbital forcing is believed to be the primary cause of an ice age ending, increased greenhouse gas emissions were still responsible for the negative feedback that led to even greater increases in temperature.
The addition of CO2 by human activity has also played a direct role in climatic changes taking place around the world. Currently, the burning of fossil fuels by humans constitutes the largest source of emissions of carbon dioxide (about 90%) worldwide, which is one of the main greenhouse gases that allows radiative forcing (aka. the Greenhouse Effect) to take place.
In 2013, the National Oceanic and Atmospheric Administration announced that CO² levels in the upper atmosphere reached 400 parts per million (ppm) for the first time since measurements began in the 19th century. Based on the current rate at which emissions are growing, NASA estimates that carbon levels could reach between 550 to 800 ppm in the coming century.
If the former scenario is the case, NASA anticipates a rise of 2.5 °C (4.5 °F) in average global temperatures, which would be sustainable. However, should the latter scenario prove to be the case, global temperatures will rise by an average of 4.5 °C (8 °F), which would make life untenable for many parts of the planet. For this reason, alternatives are being sought out for development and widespread commercial adoption.
What’s more, according to a 2012 research study published in Nature Geoscience – titled “Determining the natural length of the current interglacial” – human emissions of CO² are also expected to defer the next ice age. Using data on Earth’s orbit to calculate the length of interglacial periods, the research team concluded that the next ice (expected in 1500 years) would require atmospheric CO² levels to remain beneath around 240?ppm.
Learning more about the longer ice ages as well the shorter glacial periods that have taken place in Earth’s past is important step towards understanding how Earth’s climate changes over time. This is especially important as scientists seek to determine how much of modern climate change is man-made, and what possible counter-measures can be developed.
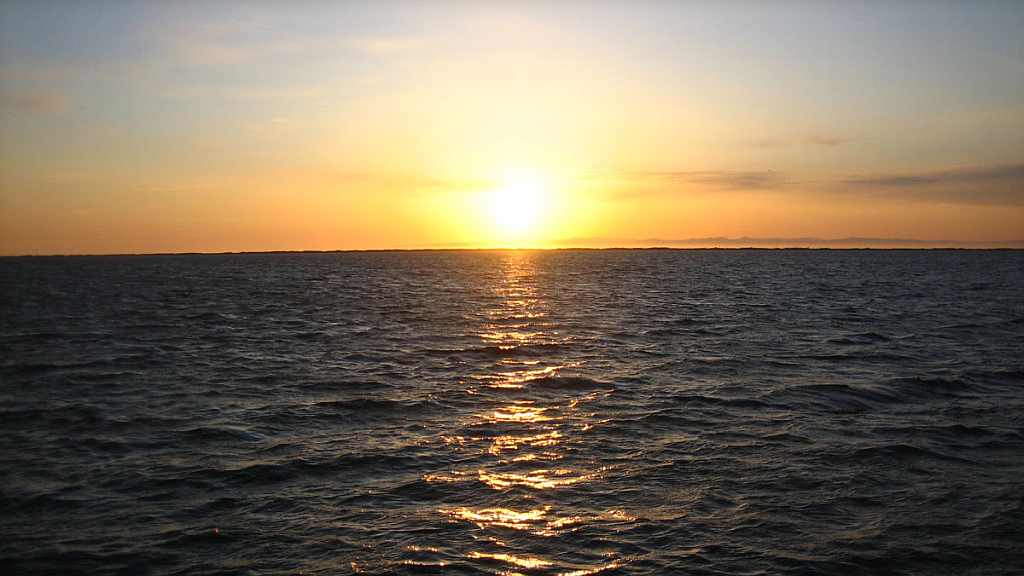
Research into the temporary slowdown of the global mean surface temperature has revealed that the world's oceans have absorbed the "missing heat." Image: Flickr user Brian Richardson, CC by 2.0
A reprieve from Global Warming? A hiatus? That would be nice, wouldn’t it? But in this case, a hiatus is not quite what it seems.
Everybody knows that global warming is partly caused by human activities, largely our use of fossil fuels. We understand how it works and we fear for the future. But there’s been a slowdown in the global mean surface temperature increase between 1998 to 2013. We haven’t lowered our emissions of greenhouse gases (GHGs) significantly during that time, so what happened?
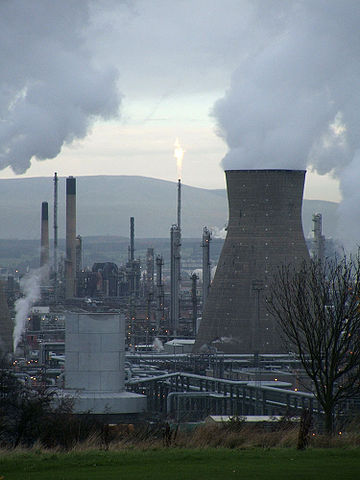
Fossil fuels: we just can’t get enough of them. Image: a petrochemical refinery in Scotland. Credit: User:John from wikipedia, CC BY-SA 3.0, https://commons.wikimedia.org/w/index.php?curid=2459867
A new multi-institutional study involving NASA’s Jet Propulsion Laboratory (JPL), the National Oceanographic and Atmospheric Institute, and others, concludes that Earth’s oceans have absorbed the heat. So instead of the global mean surface temperature rising at a steady rate, the oceans have taken on the job as global heat sink. But what’s the significance of this?
“The hiatus period gives scientists an opportunity to understand uncertainties in how climate systems are measured, as well as to fill in the gap in what scientists know.” -Xiao-Hai Yan, University of Delaware, Newark
In terms of the on-going rise in the temperature of the globe, the hiatus is not that significant. But in terms of the science of global warming, and how well we understand it, the hiatus gives scientists an opportunity.
The new paper, titled “The Global Warming Hiatus: Slowdown or Redistribution?” grew out of the U.S. Climate Variability and Predictability Program (CLIVAR) panel session at the 2015 American Geophysical Union fall meeting. From those discussions, scientists reached consensus on three key points:
From 1998 to 2013, the rate of global mean surface warming slowed, which some call the “global warming hiatus.”
Natural variability plays a large role in the rate of global mean surface warming on decadal time scales.
Improved understanding of how the ocean distributes and redistributes heat will help the scientific community better monitor Earth’s energy budget. Earth’s energy budget is a complex calculation of how much energy enters our climate system from the sun and what happens to it: how much is stored by the land, ocean or atmosphere.
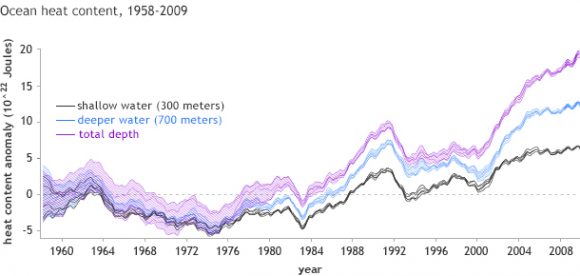
This graph shows the yearly global ocean heat content. The dashed line shows the 1958-65 average. Image: Balmaseda et al., 2013
The paper is a reminder that climate science is complex, and that the oceans play a big part in global warming. As Yan says, “To better monitor Earth’s energy budget and its consequences, the ocean is most important to consider because the amount of heat it can store is extremely large when compared to the land or atmospheric capacity.”
“…”arguably, ocean heat content — from the surface to the seafloor — might be a more appropriate measure of how much our planet is warming.” – from the paper “The Global Warming Hiatus: Slowdown or Redistribution?”
The team behind this new research suggests that saying there’s been a hiatus in global warming is confusing. They suggest “global warming hiatus” be replaced with “global surface warming slowdown.”
There’s a danger in calling it a “global warming hiatus.” Those opposed to climate change and who think it’s a hoax can use that term to discredit climate science. They’ll claim that the “hiatus” shows we don’t understand climate change and the Earth may have stopped warming. But in any case, it’s the long-term trend—change over the course of a century or more—that defines “global warming,” not the change from year to year or even decade to decade.
There’s much more to learn about the oceans’ role in global warming. Research shows that some ocean areas absorb heat much faster than others. But whatever the fine detail of it is, there is broad agreement in the scientific community that the global surface warming slowdown was caused by an increased uptake of heat energy by the world’s oceans.
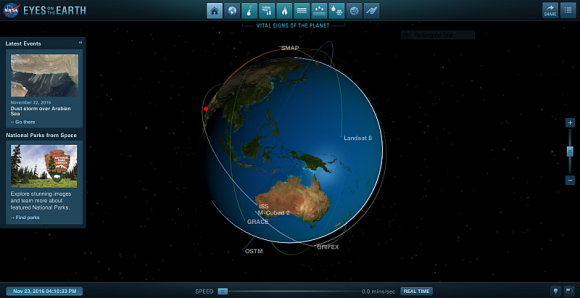
A screenshot from the “NASA’s Eyes” app. The app allows anyone to check Earth’s vital signs. Image: NASA/JPL
NASA uses a lot of tools to monitor the Earth’s temperature. For an interesting look at the Earth’s vital signs, check out Nasa’s Eyes. This easy to use visualization tool lets you take a closer look at the Earth’s temperature, CO2 levels, soil moisture levels, sea levels, and other things.