Grab Your Smartphone And Become A Citizen Scientist For NASA

NASA's new app, the Globe Observer, will allow users to collect observations of clouds, and engage in a little citizen science. Image: NASA GLOBE Observer

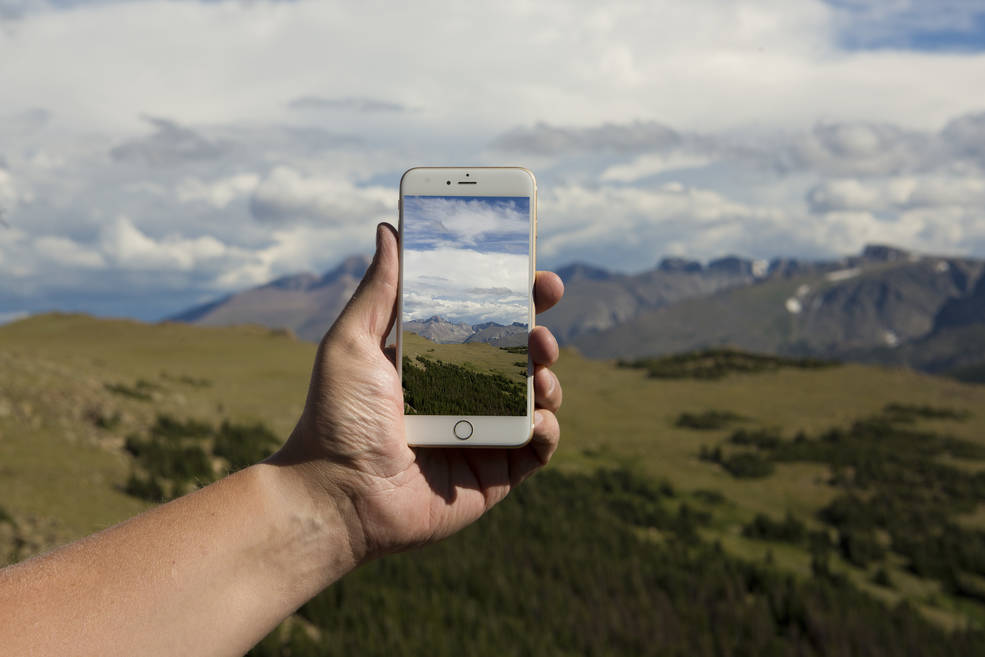
It’s long been humanity’s dream to do something useful with our smartphones. Sure, we can take selfies, and post pictures of our meals, but true smartphone greatness has eluded us. Until now, that is.

Thanks to NASA, we can now do some citizen science with our ubiquitous devices.

For over 20 years, and in schools in over 110 countries, NASA’s Global Learning and Observations to Benefit the Environment (GLOBE) program has helped students understand their local environment in a global context. Now NASA has released the GLOBE Observer app, which allows users to capture images of clouds in their local environment, and share them with scientists studying the Earth’s climate.

“With the launch of GLOBE Observer, the GLOBE program is expanding beyond the classroom to invite everyone to become a citizen Earth scientist,” said Holli Riebeek Kohl, NASA lead of GLOBE Observer. The app will initially be used to capture cloud observations and images because they’re such an important part of the global climate system. But eventually, GLOBE Observer will also be used to observe land cover, and to identify types of mosquito larvae.

GLOBE has two purposes. One is to collect solid scientific data, the other is to increase users’ awareness of their own environments. “Once you collect environmental observations with the app, they are sent to the GLOBE data and information system for use by scientists and students studying the Earth,” said Kohl. “You can also use these observations for your own investigations and interact with a vibrant community of individuals from around the world who care about Earth system science and our global environment.”

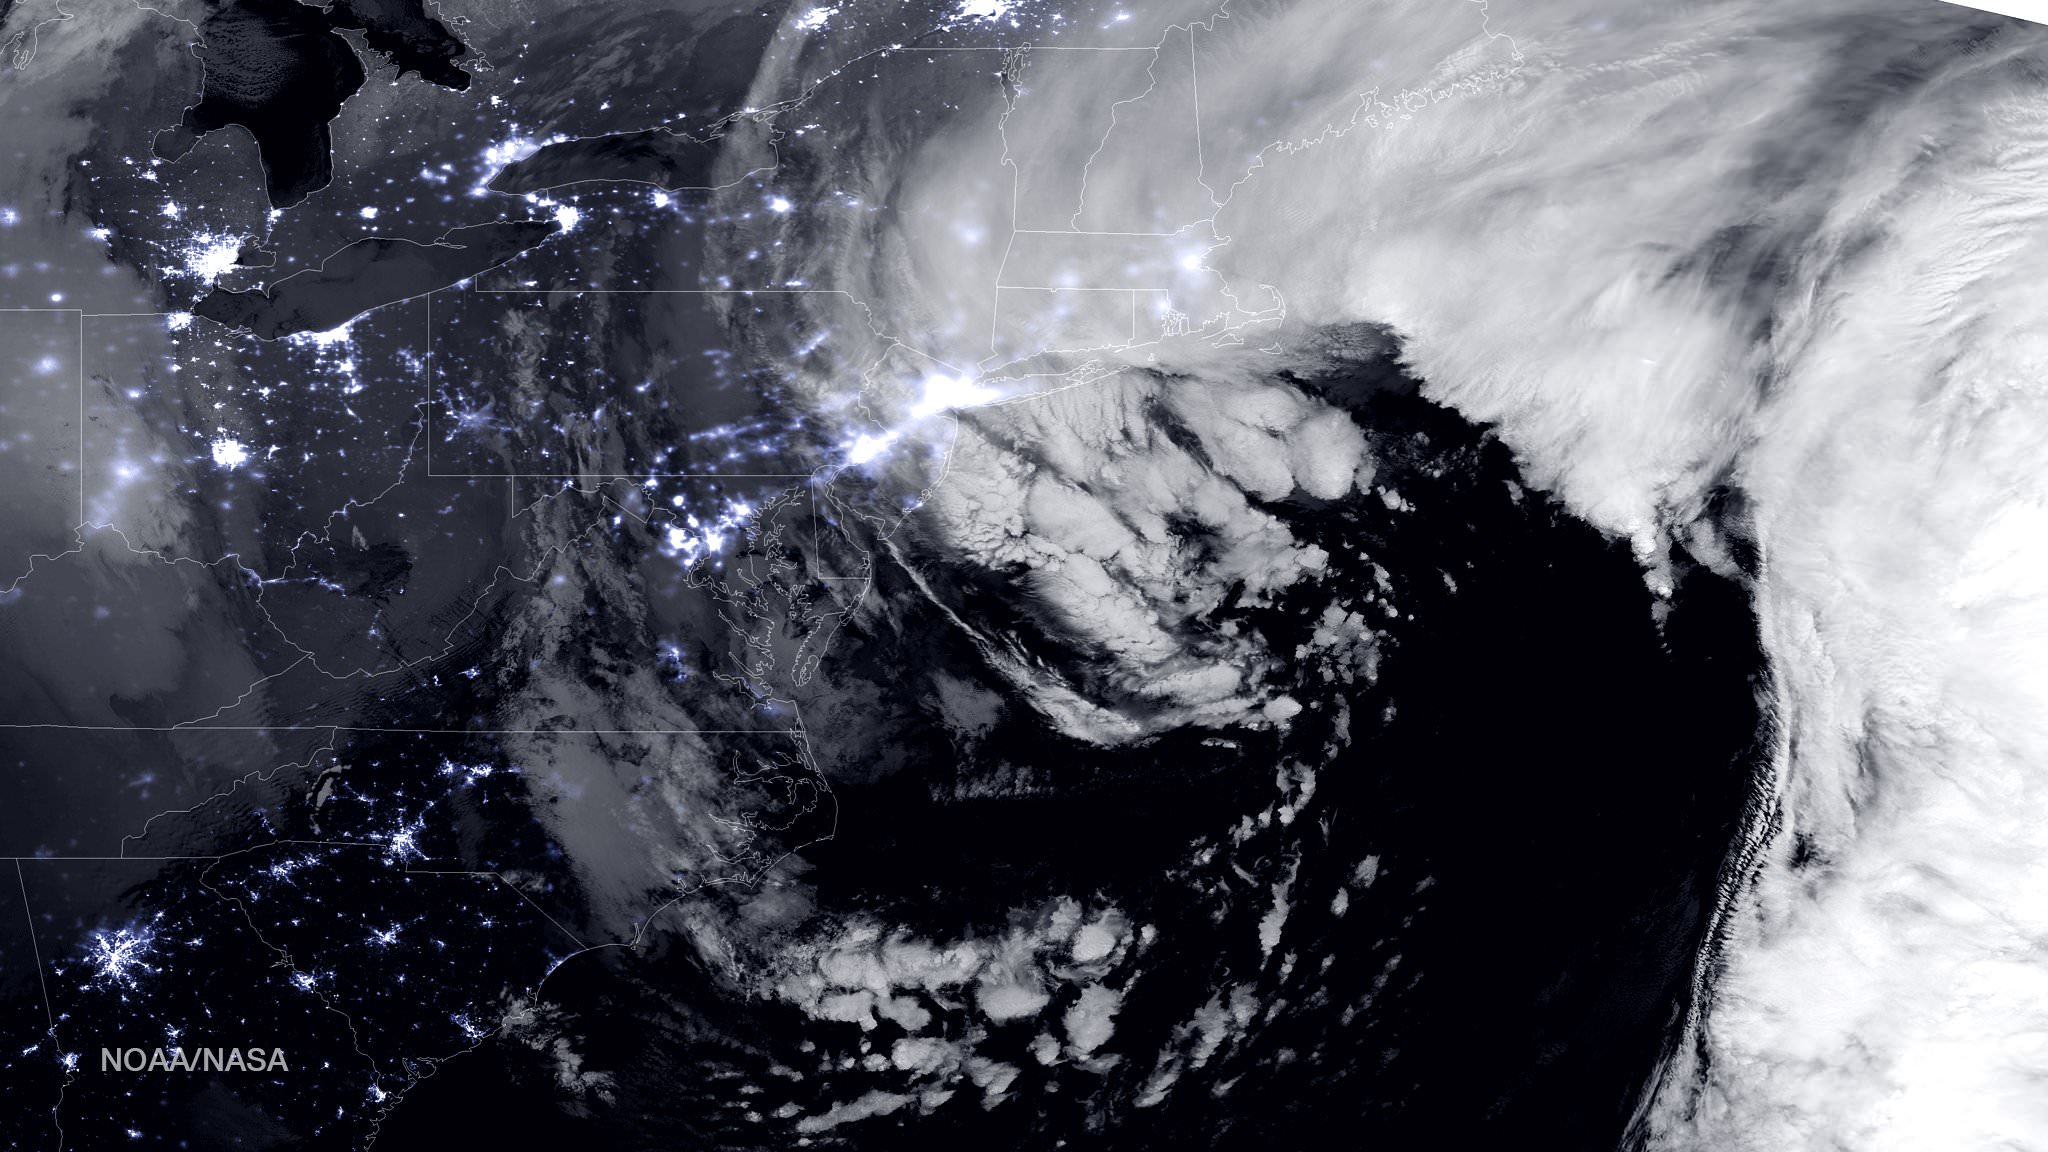
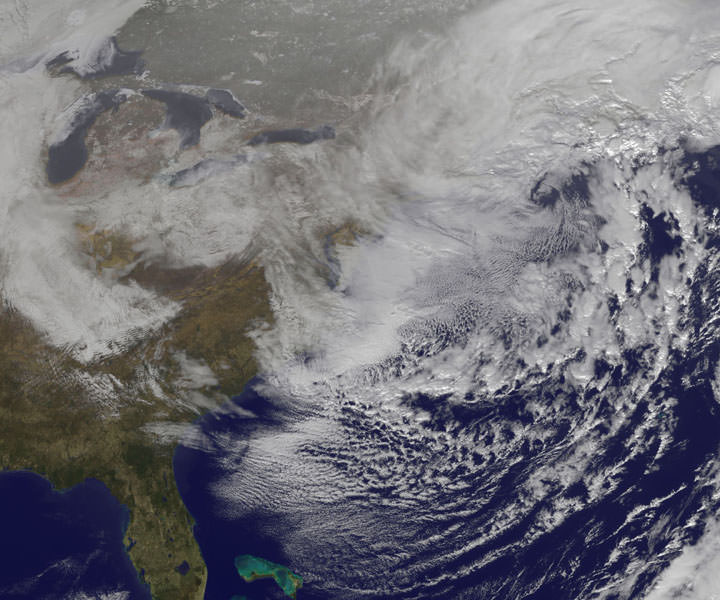
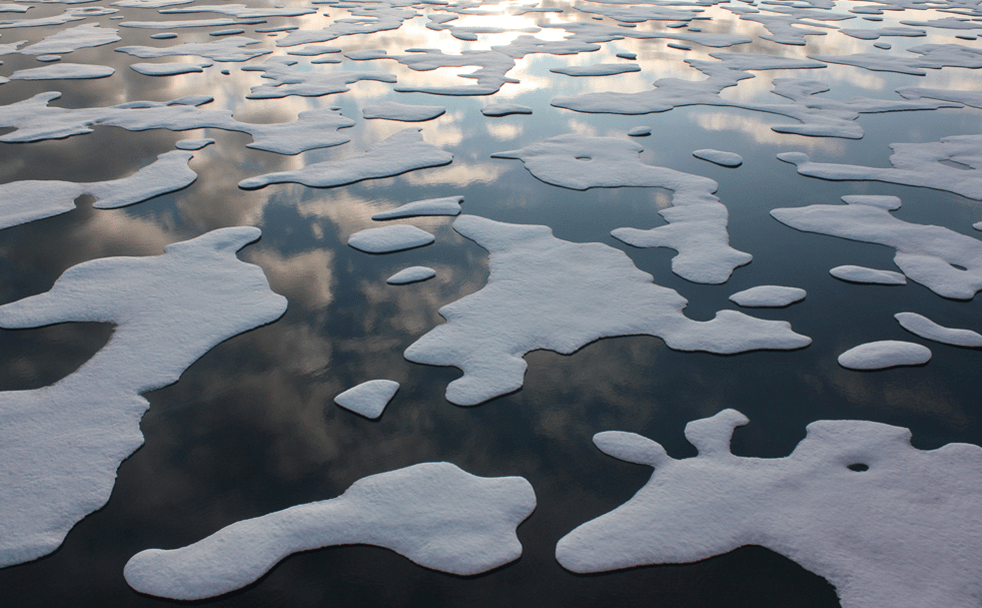
Clouds are a dynamic part of the Earth’s climate system. Depending on their type, their altitude, and even the size of their water droplets, they either trap heat in the atmosphere, or reflect sunlight back into space. We have satellites to observe and study clouds, but they have their limitations. An army of citizen scientists observing their local cloud population will add a lot to the efforts of the satellites.

“Clouds are one of the most important factors in understanding how climate is changing now and how it’s going to change in the future,” Kohl said. “NASA studies clouds from satellites that provide either a top view or a vertical slice of the clouds. The ground-up view from citizen scientists is valuable in validating and understanding the satellite observations. It also provides a more complete picture of clouds around the world.”

The observations collected by GLOBE users could end up as part of NASA's Earth Observatory, which tracks the cloud fraction around the world. Image: NASA/NASA Earth Observation.
The observations collected by GLOBE users could end up as part of NASA’s Earth Observatory, which tracks the cloud fraction around the world. Image: NASA/NASA Earth Observation.

The GLOBE team has issued a challenge to any interested citizen scientists who want to use the app. Over the next two weeks, the team is hoping that users will make ground observations of clouds at the same time as a cloud-observing satellite passes overhead. “We really encourage all citizen scientists to look up in the sky and take observations while the satellites are passing over through Sept. 14,” said Kohl.

The app makes this easy to do. It informs users when a satellite will be passing overhead, so we can do a quick observation at that time. We can also use Facebook or Twitter to view daily maps of the satellite’s path.

“Ground measurements are critical to validate measurements taken from space through remote sensing,” said Erika Podest, an Earth scientist at NASA’s Jet Propulsion Laboratory in Pasadena, California, who is working with GLOBE data. “There are some places in the world where we have no ground data, so citizen scientists can greatly contribute to advancing our knowledge this important part of the Earth system.”

The app itself seems pretty straightforward. I checked for upcoming satellite flyovers and was notified of 6 flyovers that day. It’s pretty quick and easy to step outside and take an observation at one of those times.

I did a quick observation from the street in front of my house and it took about 2 minutes. To identify cloud types, you just match what you see with in-app photos of the different types of clouds. Then you estimate the percentage of cloud cover, or specify if the sky is obscured by blowing snow, or fog, or something else. You can also add pictures, and the app guides you in aiming the camera properly.

The GLOBE Observer app is easy to use, and kind of fun. It’s simple enough to fit a quick cloud observation in between selfies and meal pictures.

Download it and try it out.

You can download the IOS version from the App Store, and the Android version from Google Play.

NASA and NOAA Satellites Image Crippling Blizzard of 2015 Pounding New England

NASA-NOAA Suomi NPP satellite captures blizzard near peak intensity as it moves over New York and Boston regions at 1:45 am EST, Jan. 27, 2015. This view is a combination of the day-night band and high resolution infrared imagery from Suomi NPP showing the historic blizzard near peak intensity as it moves over the New York through Boston Metropolitan areas at 06:45Z (1:45 a.m. EST) on January 27, 2015. Credit: NOAA/NASA

NEW JERSEY – Record breaking snow from the ‘Blizzard of 2015’ hit vast regions of the US Northeast today, Jan. 27, 2015, stretching from Long Island to New England.

NASA and NOAA Earth orbiting satellites are keeping track of the storm affecting millions of residents.

This afternoon the agencies provided a new set of night-time and daytime views of the Blizzard of 2015 taken by the Suomi NPP and the GOES-East satellites.

The crippling blizzard is causing misery, extensive destruction to homes and businesses in localized areas, power outages, traffic accidents, breaks in some sea walls and deaths.

The satellite image above shows a combination of the day-night band and high resolution infrared imagery from the NASA-NOAA’s Suomi NPP satellite.

It was taken as the historic blizzard neared peak intensity as it moved over the New York area and through the Boston Metropolitan areas at 06:45Z (1:45 a.m. EST) on January 27, 2015.

The high cloud tops from the most intense parts of the storm blurred the regions normally bright nighttime lights in the satellite image.

Although the snow totals were about half the over two feet forecast for the New York Metropolitan region, many areas to the north and east were inundated with very heavy to historic snow fall totals, as bad or worse than the forecasters predicted.

Over two feet of snow fell on areas of New York’s Long Island and stretching north to vast regions of Connecticut, Massachusetts, New Hampshire and into Maine.

Near hurricane force waves are crashing into some coastal towns along the Massachusetts shoreline. Wind gusts as high as 78 mph have been recorded.

“Highest snowfall report has been Auburn, MA with 32.5 inches! Wind gust reports as high as 78 mph in Nantucket, MA,” according to a tweet this evening from the National Weather Service (NWS).

Worchester, Mass had a record breaking 31 inches of snow. And it’s still falling this evening in the 2nd largest city in New England.

A flood emergency is in effect in Marshfield, Mass., where an 80 foot section of the seawall was smashed by crashing waves and is destroying homes as shown on NBC Nightly News.

Blinding snow is raging in Portland, Maine this evening according on a live NBC News report.

On January 27, 2015 at 17:35 UTC (12:35 p.m. EST) NOAA's Geostationary Operational Environmental or GOES- East satellite captured an image of the nor'easter over New England. Credit: NASA/NOAA GOES Project
On January 27, 2015 at 17:35 UTC (12:35 p.m. EST) NOAA’s Geostationary Operational Environmental or GOES- East satellite captured an image of the nor’easter over New England. Credit: NASA/NOAA GOES Project

“At 10 a.m. EST, the National Weather Service noted “the powerful nor’easter that brought moderate to heavy snowfall and blizzard conditions to the Northeast on Monday will continue to affect the region on Tuesday, with heavy snow and blizzard conditions expected from eastern Long Island to Maine as the system slowly moves to the northeast. Snow and strong winds will being tapering off from south to north Tuesday night into Wednesday morning,” wrote NASA’s Rob Gutro of NASA’s Goddard Space Flight Center in an update.

“Later on January 27, 2015 at 17:35 UTC (12:35 p.m. EST) NOAA’s Geostationary Operational Environmental or GOES-East satellite captured an image of the nor’easter over New England. The image was created by the NASA/NOAA GOES Project and showed the clouds associated with the nor’easter blanketing New England. An occluded front extended north and eastward out of the low pressure area’s center out into the Atlantic Ocean.”

The latest NOAA forecast as of 4 PM, Jan. 27 states:

HIGH WINDS AND HEAVY SNOW WILL BEGIN TO GRADUALLY TAPER OFF FROM SOUTH TO NORTH TONIGHT…BUT WILL LAST INTO EARLY WEDNESDAY MORNING ACROSS PORTIONS OF MAINE. HEAVY SNOWFALL WILL COMBINE WITH SUSTAINED WINDS OF 30 TO 40 MPH…AND GUSTS IN EXCESS OF 50 MPH…TO CREATE LIFE-THREATENING WHITEOUT OR BLIZZARD CONDITIONS. THESE WINDS MAY LEAD TO DOWNED TREES AND POWER LINES RESULTING IN POWER OUTAGES. TRAVEL WILL BE IMPOSSIBLE AND LIFE-THREATENING IN MANY AREAS. ALONG THE IMMEDIATE COASTLINE…WIND GUSTS TO NEAR 65 MPH WILL BE POSSIBLE. COASTAL FLOODING AND SEVERE BEACH EROSION WILL ALSO BE A POSSIBILITY…AND VULNERABLE ROADS AND STRUCTURES MAY BE FLOODED OR DAMAGED.

Stay tuned here for Ken’s continuing Earth and planetary science and human spaceflight news.

Reporting from snowy New Jersey.

Ken Kremer

Why Is Venus So Horrible?

Why Is Venus So Horrible?

Venus really sucks. It’s as hot as an oven with a dense, poisonous atmosphere. But how did it get that way?

Venus sucks. Seriously, it’s the worst. The global temperature is as hot as an oven, the atmospheric pressure is 90 times Earth, and it rains sulfuric acid. Every part of the surface of Venus would kill you dead in moments.

Let’s push Venus into the Sun and be done with that terrible place. Its proximity is lowering our real estate values and who knows what sort of interstellar monstrosities are going to set up shop there, and be constantly knocking on our door to borrow the mower, or a cup or sugar, or sneak into our yard at night and eat all our dolphins.

You might argue that Venus is worth saving because it’s located within the Solar System’s habitable zone, that special place where water could exist in a liquid state on the surface. But we’re pretty sure it doesn’t have any liquid water. Venus may have been better in the past, clearly it started hanging out with wrong crowd, taking a bad turn down a dark road leading it to its current state of disrepair.

Could Venus have been better in the past? And how did it go so wrong? In many ways, Venus is a twin of the Earth. It’s almost the same size and mass as the Earth, and it’s made up of roughly the same elements. And if you stood on the surface of Venus, in the brief moments before you evacuated your bowels and died horribly, you’d notice the gravity feels pretty similar.

In the ancient past, the Sun was dimmer and cooler than it is now. Cool enough that Venus was much more similar to Earth with rivers, lakes and oceans. NASA’s Pioneer spacecraft probed beneath the planet’s thick clouds and revealed that there was once liquid water on the surface of Venus. And with liquid water, there could have been life on the surface and in those oceans.

Here’s where Venus went wrong. It’s about a third closer to the Sun than Earth, and gets roughly double the solar radiation. The Sun has been slowly heating up over the millions and billions of years. At some point, the planet reached a tipping point, where the water on the surface of Venus completely evaporated into the atmosphere.

False color radar topographical map of Venus provided by Magellan. Credit: Magellan Team/JPL/NASA

Water vapor is a powerful greenhouse gas, and this only increased the global temperature, creating a runaway greenhouse effect on Venus. The ultraviolet light from the Sun split apart the water vapor into oxygen and hydrogen. The hydrogen was light enough to escape the atmosphere of Venus into space, while the oxygen recombined with carbon to form the thick carbon dioxide atmosphere we see today. Without that hydrogen, Venus’ water is never coming back.

Are you worried about our changing climate doing that here? Don’t panic. The amount of carbon dioxide released into the atmosphere of Venus is incomprehensible. According to the IPCC, the folks studying global warming, human activities have no chance of unleashing runaway global warming. We’ll just have the regular old, really awful global warming. So, it’s okay to panic a bit, but do it in the productive way that results in your driving your car less.

The Sun is still slowly heating up. And in a billion years or so, temperatures here will get hot enough to boil the oceans away. And then, Earth and Venus will be twins again and then we can push them both into the Sun.

I know, I said the words “climate change”. Feel free to have an argument in the comments below, but play nice and bring science.

Weather Forecasting on Mars Likely to be Trickier Than on Earth

Clouds above the rim of "Endurance Crater" in this image from NASA's Mars Exploration Rover Opportunity. These clouds occur in a region of strong vertical shear. The cloud particles (ice in this martian case) fall out, and get dragged along away from the location where they originally condensed, forming characteristic streamers. Opportunity took this picture with its navigation camera during the rover's 269th martian day (Oct. 26, 2004). Image Credit: NASA/JPL

Predicting the weather here on Earth is never an easy thing, but predicting it on Mars may be ever trickier. Such is the argument presented by a recent study concerning “macroweather” patterns on the Red Planet, a new regime for understanding how planetary environments work.

When it comes to describing the climate of a planet, two important concepts come into play. First, there’s weather, which covers day-to-day changes due to fluctuations in the atmosphere. Second, there’s climate, which is more stable and subject to change over the course of decades. Macroweather, the latest addition to the game, describes the relatively stable periods that exist between short-term weather and long-term climate.

For those of us dwelling here on planet Earth, these are familiar concepts. But researchers say this same three-part pattern applies to atmospheric conditions on Mars. The results of a new paper, published today in Geophysical Research Letters also show that the Sun plays a major role in determining macroweather.

Several dust devils cross a plain in this animation of a series of images acquired by NASA's Mars Rover Spirit in May, 2005. (NASA/JPL-Caltech/Cornell/USGS)
Several dust devils cross a plain in this animation of a series of images acquired by NASA’s Mars Rover Spirit in May, 2005. (NASA/JPL-Caltech/Cornell/USGS)

The scientists chose to study Mars because of the wealth of data it has provided in recent decades, which they then used to test their theory that a transitional “macroweather” regime exists on a planet other than Earth. They used information collected from the Viking Mars lander mission from the 1970s and 1980s, and more recent data from the Mars Global Surveyor.

By taking into account how the sun heats Mars, as well as the thickness of the planet’s atmosphere, the scientists predicted that temperatures and wind would fluctuate on Mars similar to how they fluctuate on Earth. However, this transition from weather to macroweather would take place over 1.8 Martian days (about two Earth days), compared with a week to 10 days here on Earth.

“Our analysis of the data from Mars confirmed this prediction quite accurately,” said Shaun Lovejoy, a physics professor at McGill University in Montreal, Canada, and lead author of the paper. “This adds to evidence, from studies of Earth’s atmosphere and oceans, that the sun plays a central role in shaping the transition from short-term weather fluctuations to macroweather.”

Early Spring Dust Storms at the North Pole of Mars. Early spring typically brings dust storms to northern polar Mars. As the north polar cap begins to thaw, the temperature difference between the cold frost region and recently thawed surface results in swirling winds. The choppy dust clouds of several dust storms are visible in this mosaic of images taken by the Mars Global Surveyor spacecraft in 2002. The white polar cap is frozen carbon dioxide. (NASA/JPL/Malin Space Science Systems)
Early Spring Dust Storms at the North Pole of Mars, taken by the Mars Global Surveyor spacecraft in 2002. Image Credit: NASA/JPL/Malin Space Science Systems

The findings also indicate that weather on Mars can be predicted with some skill only two days in advance, compared to 10 days on Earth.

“We’re going to have a very hard time predicting the weather on Mars beyond two days given what we have found in weather records there,” said co-author Jan-Peter Muller from the University College London Mullard Space Science Laboratory in the UK, “which could prove tricky for the European lander and rover.”

This research promises to advance scientists’ understanding of the dynamics of Earth’s own atmosphere, and could potentially provide insights into the weather of Venus, Saturn’s moon Titan, and possibly the gas giants Jupiter, Saturn, Uranus, and Neptune.

As always, in learning about other planets and their climates, scientists are finding that the planets of our Solar System may have more in common with Earth than previously thought. Because of this, studying these other worlds will inevitably help us to better understand our own.

Further Reading: AGU, McGill

Cat 4 Hurricane Gonzalo Threatens Bermuda and Delays Antares Launch to Space Station

NOAA's GOES-East satellite captured this image of Hurricane Gonzalo off the U.S. East Coast on Oct. 16 at 13:07 UTC (9:07 a.m. EDT). Gonzalo is classified as Category 4 storm. Credit: NASA/NOAA GOES Project

Hurricane Gonzalo, the first major Atlantic Ocean basin hurricane in three years, has strengthened to a dangerous Category 4 storm, threatening Bermuda and forcing a postponement of the upcoming launch of the Orbital Sciences Antares rocket to the space station from the Virginia shore to no earlier than Oct. 27.

A hurricane warning is in effect for the entire island of Bermuda.

NASA and Orbital Sciences had no choice but to delay the Antares blastoff from Oct. 24 to no earlier than Oct. 27 because Bermuda is home to an “essential tracking site” that must be operational to ensure public safety in case of a launch emergency situation.

Antares had been slated for an early evening liftoff with the Cygnus cargo carrier on the Orb-3 mission to the International Space Station (ISS).

NASA and Orbital issued the following statement:

“Due to the impending arrival of Hurricane Gonzalo on the island of Bermuda, where an essential tracking site used to ensure public safety during Antares launches is located, the previously announced “no earlier than” (NET) launch date of October 24 for the Orb-3 CRS mission to the International Space Station for NASA is no longer feasible.”

Orbital Sciences Corporation Antares rocket and Cygnus spacecraft prior to blast off on July 13  2014 from Launch Pad 0A at NASA Wallops Flight Facility , VA, on the Orb-2 mission bound for the International Space Station.  Credit: Ken Kremer - kenkremer.com
Orbital Sciences Corporation Antares rocket and Cygnus spacecraft prior to blast off on July 13 2014 from Launch Pad 0A at NASA Wallops Flight Facility , VA, on the Orb-2 mission bound for the International Space Station. Credit: Ken Kremer – kenkremer.com

The powerful Gonzalo is currently expected to make a direct hit on Bermuda on Friday afternoon, Oct. 17. It’s packing devastating maximum sustained winds exceeding 145 mph (225 kph).

NASA and NOAA satellites including the Terra, Aqua and GOES-East satellites are providing continuous coverage of Hurricane Gonzalo as it moves toward Bermuda, according to a NASA update today.

The ISS-RapidScat payload tracking ocean winds, that was just attached to the exterior of the ISS, is also designed to help with hurricane monitoring and forecasting.

Tropical storm force winds and 20 to 30 foot wave heights are expected to impact Bermuda throughout Friday and continue through Saturday and into Sunday.

“The National Hurricane Center expects hurricane-force winds, and rainfall totals of 3 to 6 inches in Bermuda. A storm surge with coastal flooding can be expected in Bermuda, with large and destructive waves along the coast. In addition, life-threatening surf and riptide conditions are likely in the Virgin Islands, Puerto Rico, Dominican Republic, Bahamas. Those dangerous conditions are expected along the U.S. East Coast and Bermuda today, Oct. 16,” according to NASA.

On Oct. 15 at 15:30 UTC (11:30 a.m. EDT) NASA's Terra satellite captured this image of Hurricane Gonzalo in the Atlantic Ocean. Credit: NASA Goddard MODIS Rapid Response Team
On Oct. 15 at 15:30 UTC (11:30 a.m. EDT) NASA’s Terra satellite captured this image of Hurricane Gonzalo in the Atlantic Ocean. Credit: NASA Goddard MODIS Rapid Response Team

After the hurricane passes, a team will be sent to assess the impact of the storm on Bermuda and the tracking station. Further delays are possible if Bermuda’s essential infrastructure systems are damaged, such as power, transportation and communications.

The Antares/Cygnus rocket and cargo ship launch from the Mid-Atlantic Regional Spaceport at NASA’s Wallops Flight Facility along the eastrn shore of Virginia.

Liftoff is currently target for October 27 at 6:44 p.m. (EDT). The rendezvous and berthing of Cygnus with the ISS remains on November 2, with grapple of the spacecraft by the station’s robotic arm at approximately 4:58 a.m. (EST), according to a NASA update.

Stay tuned here for Ken’s continuing Earth and Planetary science and human spaceflight news.

Ken Kremer

MAVEN Arrives at Mars! Parks Safely in Orbit

The control room at Lockheed Martin shortly before MAVEN successfully entered Mars orbit tonight September 21, 2014. Credit: NASA-TV

138 million miles and 10 months journey from planet Earth, MAVEN moved into its new home around the planet Mars this evening. Flight controllers at Lockheed Martin Space Systems in Littleton, Colorado anxiously monitored the spacecraft’s progress as onboard computers successfully eased the Mars Atmosphere and Volatile EvolutioN (MAVEN) spacecraft into Mars orbit at 10:24 p.m. Eastern Daylight Time. 

Shortly before orbital insertion, six small thrusters were fired to steady the spacecraft so it would enter orbit in the correct orientation. This was followed by a 33-minute burn to slow it down enough for Mars’ gravity to capture the craft into an elliptical orbit with a period of 35 hours. Because it takes radio signals traveling at the speed of light 12 minutes to cross the gap between Mars and Earth, the entire orbital sequence was executed by onboard computers. There’s no chance to change course or make corrections, so the software has to work flawlessly. It did. The burn, as they said was “nominal”, science-speak for came off without a hitch.

Simulation of MAVEN in Martian orbit. Credit: NASA
Simulation of MAVEN in orbit around Mars. The craft’s unique aerodynamically curved solar panels allow it to dive more deeply into the Martian atmosphere. Credit: NASA

“This was a very big day for MAVEN,” said David Mitchell, MAVEN project manager from NASA’s Goddard Space Flight Center, Greenbelt, Maryland. “We’re very excited to join the constellation of spacecraft in orbit at Mars and on the surface of the Red Planet. Congratulations to the team for a job well done today.”

Over the next six weeks, controllers will test MAVEN’s instruments and shape its orbit into a long ellipse with a period of 4.5 hours and a low point of just 93 miles (150 km), close enough to get a taste of the planet’s upper atmosphere. MAVEN’s one-Earth-year long primary mission will study the composition and structure of Mars’ atmosphere and how it’s affected by the sun and solar wind. At least 2,000 Astronomers want to determine how the planet evolved from a more temperate climate to the current dry, frigid desert.

Evidence for ancient water flows on Mars - a delta in Eberswalde Crater. Credit: NASA
Evidence for ancient water flows on Mars – a delta in Eberswalde Crater. Credit: NASA

Vast quantities of water once flowed over the dusty red rocks of Mars as evidenced by ancient riverbeds, outflow channels carved by powerful floods, and rocks rounded by the action of water. For liquid water to flow on its surface without vaporizing straight into space, the planet must have had a much denser atmosphere at one time.

Mars may have been much more like Earth is today 3-4 billion years ago with a thicker atmosphere and water flowing across its surface. Today, it's evolved into dry, cold planet with an atmosphere as thin as Scrooge's gruel. Credit: NASA
Three to four billion years ago, Mars may have been much more like Earth with a thicker atmosphere and water flowing across its surface (left). Over time,  it evolved into a dry, cold planet with an atmosphere too thin to support liquid water. Credit: NASA

Mars’ atmospheric pressure is now less than 1% that of Earth’s. As for the water, what’s left today appears locked up as ice in the polar caps and subsurface ice. So where did it go all the air go? Not into making rocks apparently. On Earth, much of the carbon dioxide from volcanic outgassing in the planet’s youth dissolved in water and combined with rocks to form carbon-bearing rocks called carbonates. So far, carbonates appear to be rare on Mars. Little has been seen from orbit and in situ with the rovers.

Illustration of electrons and protons in the solar wind slamming into and ionizing atoms in Mars upper atmosphere. Once ionized, the atoms may be carried away by the wind. Credit: NASA

During the year-long mission, MAVEN will dip in and out of the atmosphere some 2,000 times or more to measure what and how much Mars is losing to space. Without the protection of a global magnetic field like the Earth’s,  it’s thought that the solar wind eats away at the Martian atmosphere by ionizing (knocking off electrons) its atoms and molecules. Once ionized, the atoms swirl up the magnetic field embedded in the wind and are carried away from the planet.

MAVEN’s suite of instruments will provide the measurements essential to understanding the evolution of the Martian atmosphere. (Courtesy LASP/MAVEN)
MAVEN’s suite of instruments will provide the measurements essential to understanding the evolution of the Martian atmosphere. Courtesy LASP/MAVEN

Scientists will coordinate with the Curiosity rover, which can determine the atmospheric makeup at ground level. Although MAVEN won’t be taking pictures, its three packages of instruments will be working daily to fill gaps in the story of how Mars became the Red Planet and we the Blue.

For more on the ongoing progress of MAVEN later tonight and tomorrow, stop by NASA TV online. You can also stay in touch by following the hashtags #MAVEN and #JourneytoMars on social media channels including Twitter, Instagram and Facebook. Twitter updates will be posted throughout on the agency’s official accounts @NASA, @MAVEN2Mars and @NASASocial.

“Carbon Copy” Spacecraft Ready to Track Global Carbon Dioxide

Artist's rendering of NASA's Orbiting Carbon Observatory (OCO)-2, one of five new NASA Earth science missions set to launch in 2014, and one of three managed by JPL. Image Credit: NASA-JPL/Caltech

On February 24, 2009, the launch of the Orbiting Carbon Observatory (OCO) mission — designed to study the global fate of carbon dioxide — resulted in failure. Shortly after launch, the rocket nose didn’t separate as expected, and the satellite could not be released.

But now, a carbon copy of the original mission, called OCO-2 is slated to launch on July 1, 2014.

The original failure ended in “heartbreak. The entire mission was lost. We didn’t even have one problem to solve,” said OCO-2 Project Manager Ralph Basilio in a press conference earlier today. “On behalf of the entire team that worked on the original OCO mission, we’re excited about this opportunity … to finally be able to complete some unfinished business.”

The motivation for the mission is simple: in the last few hundred years, human beings have played a large role in the planet-wide balancing act called the carbon cycle. Our activities, such as fossil fuel burning and deforestation are pushing the cycle out of its natural balance, adding more carbon dioxide to the atmosphere.

“There’s a steady increase in atmospheric carbon dioxide concentrations over time,” said OCO-2 Project Scientist Mike Gunson. “But at the same time, we can see that this has an annual cycle of dropping every summer, in this case in the northern hemisphere, as the forests and plants grow. And this is the Earth breathing.”

Time series of atmospheric carbon dioxide over the northern hemisphere retrieved from the Sciamachy instrument on Envisat and the TANSO instrument on Japan’s GOSAT.  While carbon dioxide increases over the ten-year period, it experiences annual fluctuations caused by vegetation’s absorption and release of the gas due to photosynthesis and respiration. The different colours represent different methods of extracting carbon dioxide measurements from the measured spectra of reflected solar radiation. Credit: University Bremen/ESA Read more at: http://phys.org/news/2013-09-planet-earth-carbon-dioxide-space.html#jCp
Time series of atmospheric carbon dioxide over the northern hemisphere retrieved from the Sciamachy instrument on Envisat and the TANSO instrument on Japan’s GOSAT. The different colours represent different methods of extracting carbon dioxide measurements from the measured spectra of reflected solar radiation. Credit: University Bremen/ESA

Carbon dioxide is both one of the best-measured greenhouse gases and least-measured. Half of the emissions in the atmosphere become largely distributed around the globe in a matter of months. But the other half of the emissions — the half that is being absorbed through natural processes into the land or the ocean — is not evenly distributed.

To understand carbon dioxide absorption, we need a high-resolution global map.

This is where the launch failure of OCO proved to be a blessing in disguise. It gave OCO-2 scientists a chance to work with project managers of the Japanese Greenhouse Gases Observing Satellite (GOSAT), which successfully launched in 2009. The unexpected collaboration allowed them to stumble upon a hidden surprise.

“A couple of my colleagues made what I think is a fantastic discovery,” said Gunson. They discovered fluorescent light from vegetation.

As plants absorb sunlight, some of the light is dissipated as heat, while some is re-emitted at longer wavelengths as fluorescence. Although scientists have measured fluorescence in laboratory settings and ground-based experiments, they have never done so from space.

Measuring the fluorescent glow proves to be a challenge because the tiny signal is overpowered by reflected sunlight. Researchers found that by tuning their GOSAT spectrometer — an instrument that can measure light across the electromagnetic spectrum — to look at very narrow channels, they could see parts of the spectrum where there was fluorescence but less reflect sunlight.

This surprise will give OCO-2 an unexpected global view from space, shedding new light on the productivity of vegetation on land. It will provide a regional map of absorbed carbon dioxide, helping scientists to estimate photosynthesis rates over vast scales and better understand the second half of the carbon cycle.

Ralph Basilio, OCO-2 project manager with NASA’s Jet Propulsion Laboratory (JPL) in Pasadena, California, left, and Mike Gunson, OCO-2 project scientist at JPL, discuss the Orbiting Carbon Observatory-2 (OCO-2), NASA’s first spacecraft dedicated to studying carbon dioxide, during a press briefing, Thursday, June 12, 2014, at NASA Headquarters in Washington. Credit: NASA.

“The OCO-2 satellite has one instrument: a three-channel grating spectrometer,” said OCO-2 Program Executive Betsy Edwards. “But with this one instrument we’re going to collect hundreds of thousands of measurements each day, which will then provide a global description of carbon dioxide in the atmosphere. It’s going to be an unprecedented level of coverage and resolution, something we have not seen before with previous spacecraft.”

OCO-2 will result in nearly 100 times more observations of both carbon dioxide and fluorescence than GOSAT. It will launch from Vandenberg Air Force Base in California at 2:56 a.m. on July 1.

“Climate change is the challenge of our generation,” said Edwards. “NASA is particularly ready to … provide information, on documenting and understanding what these changes are on the climate, in predicting the impact of these changes to the Earth, and in sharing all of this information that we gather for the benefit of society.”

The Rise of Carbon Dioxide in a Single Video

Screenshot from the video showing the variations in the amount of CO2 in Earth atmosphere for the last 800,000 years.

I’m always amazed by the power of data visualization. In this case a video shrinks the rising levels of carbon dioxide over the course of 800,000 years to just under two minutes.

The motivation is simple: April set a carbon dioxide milestone by averaging 400 parts per million for the entire month. That’s uncharted territory over the course of human history.

The levels of carbon dioxide in the atmosphere are monitored from a site atop Hawaii’s Mauna Loa volcano, where they have been measured continuously since 1958. Previous to this date scientists measure ice cores, which contain air bubbles and therefore snapshots of carbon dioxide levels.

This animation from the Cooperative Institute for Research in Environmental Sciences makes clear that while there have been some variations over time, the current rise is unparalleled by geological scales.

Prior to the Industrial Revolution CO2 levels stayed roughly around 280 ppm. But then with the kickstart of carbon emissions, levels were driven exponentially higher. They soared past 350 ppm — the level scientist James Hansen said was the safe upper limit of CO2 — in October 1989.

The first measurement in excess of 400 ppm was made on May 9, 2013. This year, the level rose above that mark two months earlier, and has remained above 400 ppm steadily since the beginning of April. Levels will peak in May and then drop back down throughout the summer months as trees and plants soak up some CO2.

Once the northern hemisphere spins into fall, the instrument on Mauna Loa will again read higher CO2 levels. Next year will probably see an even earlier onset of levels above 400 ppm. It likely won’t be long before levels never drop lower than 400 ppm, even throughout the summer months.

Also, today the U.S. Global Change Research Program released a report that has been five years in the making, providing an overview of observed and projected climate change. It’s a lengthy document, but you can see an overview here. In sum, the report shows how the world is already experiencing the effects of climate change and the impacts are playing out before our eyes.

“We’ve seen a lot in the last five years,” said Andrew Rosenberg of the Union of Concerned Scientists, one of the lead authors on the report’s oceans chapter, in a press release from The Daily Climate. “So what we’ve tried to do is be quite comprehensive on what our observations have been, as opposed to just modeling projections.”

“Five years ago, ocean acidification and species movement was already happening, but the observational record wasn’t as clear,” Rosenberg said. “Now it really is quite clear. It’s not theory-based or model-based.”

Global temperatures measured by decades since the 1880's. The period from 2001-2012 was the warmest on record globally. Every year was warmer than the 1990s average. Credit: U.S. Global Change Research Program.
Global temperatures measured by decades since the 1880’s. The period from 2001-2012 was the warmest on record globally. Every year was warmer than the 1990s average. Credit: U.S. Global Change Research Program.

This report is unique in that it not only includes data from scientists, but also has input from local groups and industries facing climate impacts. Corn producers in Iowa, oyster growers in Washington, and maple syrup producers in Vermont are all experiencing climate-related issues. So, too, are coastal planners in Florida, water managers in the Southwest, and Native Peoples on tribal lands from Louisiana to Alaska.

Human beings are already being impacted by climate change.

Why People Resist the Notion of Climate Change

Image Credit: NASA

One of the most striking features of the climate change ‘debate’ is that it’s no longer a debate. Climate scientists around the world agree that climate change is very real — the Earth is warming up and we are the cause.

Yet while there is consensus even among the most reserved climate scientists, a portion of the public persistently disagrees. A recent Pew Research Center — an organization that provides information on demographic trends across the U.S. and the world — survey found that roughly four-in-ten Americans see climate change as a global threat. Climate scientists are racking their brains in an attempt to find out why.

Yale law professor Dan Kahan has done extensive research which reveals how our deep-rooted cultural dispositions might interfere with our perceptions of reality.

Why We Resist Climate Change

In 2010 Kahan led a study, “Cultural Cognition of Scientific Consensus,” which found that individuals tend to weigh evidence and credit experts differently based on cultural considerations. Psychological mechanisms allow individuals to selectively credit or dismiss evidence and experts, depending on whether the views presented match the dominant view of their group.

“There is an interdependence between people’s prior beliefs about risk and their exposure to and understanding of information,” Kahan told Universe Today. “People are motivated to search out information in a biased way. They look more for information that is consistent with their views than for information that is going to refute their views.”

Kahan’s study was administered online to 1,500 U.S. adults. Preliminary analyses wanted to determine if the public thought there was a scientific consensus regarding climate change and if there was a scientific consensus regarding human activity as the cause.

A majority — 55 percent — of the subjects reported their opinion that most scientists agree that global temperatures are rising, 12 percent believed most scientists do not find that global temperatures are rising, and 33 percent believed that scientists are divided on the topic. On whether or not human activity is the cause, 45 percent believed scientists agree that human activity is the cause, 15 percent believed scientists don’t think human activity is the cause, and 40 percent believed scientists are divided on the topic.

The public is generally not in a position to investigate the data for themselves or even read a scientific paper full of unfamiliar acronyms, plots and equations. Instead they turn to experts for assistance. Often times in determining who is credible, individuals will trust those who share similar world views and personal values. They tend to seek information congenial to their cultural predispositions.

For Kahan’s first experiment, the subjects read the biographical information of an expert scientist. They had to decide whether he was credible, having earned a Ph.D. from an elite university and now serving as a faculty member of another elite university. Those who listed themselves as hierarchical — believing in stratified social roles (generally conservatives) —  were more likely to find the expert scientist credible, while those who listed themselves as communitarian — expecting individuals to secure their own well-being (generally liberals) — were more likely to find the expert scientist not credible.

These fictional individuals were identified as credible or not based on their biographies only.
These fictional individuals were identified as credible or not based on their biographies only. Credit: Kahan et al. 2010

However, a second experiment showed the subjects not only the resume of the expert scientist but his position as well. Half the subjects were shown evidence that the expert believed in climate change, placing us at a high risk, while the other half of the subjects were shown evidence that the expert didn’t believe in climate change, placing us at a low risk.

The position imputed by the expert scientist dramatically affected the responses of the subjects. When the expert scientist supported a high risk position, 23 percent of the hierarchs and 88 percent of the communitarians found him credible. In contrast, when the expert scientist supported a low risk position, 86 percent of the hierarchs and 47 percent of the communitarians found him credible.

Whether the expert scientist was considered credible was highly associated with whether he took the position dominant in the subject’s cultural group. The subjects “have dispositions that are connected to their values that then will affect how they make sense of information,” Kahan said.

Image Credit: Kahan et al. 2010
The percentage of subjects who found the author credible depending on whether he supported a high risk (climate change is real) or low risk (climate change is not real) position. Credit: Kahan et al. 2010

At the end of the day the conclusion is simple: we’re human.  And this leads us to take the path of least resistance: we choose to believe in what those around us believe.

So it’s not that people aren’t sufficiently rational. “They’re too rational,” Kahan said. “They’re too good at extracting from the information you’re giving them, which sends the message that tells them what position they should take given the kind of person they are.”

Moving Forward

Kahan’s study shows that scientific consensus alone will not sway the public. The public will remain polarized despite efforts to increase trust in scientists or simply awareness of scientific research. Instead the key is to use science communication strategies, which reduce the likelihood the public will find climate change threatening.

In a more recent study, published in Nature, Kahan analyzed two techniques of science communication that may help break the connection between cultural predispositions and the evaluation of information.

The first technique is to frame the information in a manner that doesn’t threaten people’s values. In this study, Kahan and his colleagues asked participants to once again assess the credibility of climate change. But before doing so the subjects had to read an article.

One article was a study suggesting that carbon dissipates from the atmosphere much slower than scientists had previously thought. As a result, if we stopped producing carbon today, there would still be catastrophic effects: rising sea level, drought, hurricanes, etc. Another article (shown to a different group) gave information on geo-engineering or nuclear power — potential technological advances that may help reduce the effects of climate change. A final control group read an unrelated article on traffic lights.

Logically all of these articles had nothing to do with whether climate change is valid. But psychologically these articles did determine the meaning that people attached to the evidence of climate change. In all cases the hierarchs were less likely than the communitarians to say climate change is valid. But the gap was 29 percent smaller among the group that was first exposed to geo-engineering than the group that was exposed to regulating carbon.

“The evidence of whether there is a problem doesn’t depend on what you’re going to do about it,” Kahan said. “But psychologically it can make a difference.”

People tend to resist scientific evidence that may lead to restrictions on their personal activities, or evidence that threatens them as individuals  But if they are presented with information in a way that upholds their identities, they react with an open mind.

The second technique is to ensure that climate change is vouched for by a diverse set of experts. If a particular group is able to identify with that expert, then that group will be more open-minded in addressing the study. This will help reduce the initial polarization between hierarchs and communitarians.

Kahan argues that science “needs better marketing.” It needs to combine climate change with meanings that are affirming rather than threatening to people. When groups can identify with the expert, or are presented with possible solutions to climate change, the individuals in that group will stop attaching the issues to identity.

According to Kahan, in order to move forward, science communication needs to change the narrative. It needs to mitigate the connection between climate change and the individual. In order for there to be a public consensus on climate change it has to be presented in a less threatening manner.

This doesn’t mean that science communication has to avoid the nasty truth about climate change in order to finally reach a public consensus. Instead it has to spin climate change in a positive way — a way that is less threatening to the individual.

Science communication has to focus the public’s attention on what so many individuals value: efficiency, not being wasteful, innovation and moving forward. Only then will the public reach a consensus where there is now only polarization.

Latest Data Shows Global Climate Continues Warming Trend

Chart of the temperature anomalies for 1950-2013, also showing the phase of the El Niñ0-La Niña cycle. (Image Credit: NASA/GSFC/Earth Observatory, NASA/GISS)

The latest statistics are in from 2013 and both NASA’s and NOAA’s measurements of global temperatures show Earth continued to experience temperatures warmer than those measured several decades ago.

NASA scientists say 2013 tied with 2009 and 2006 for the seventh warmest year since 1880, continuing a long-term trend of rising global temperatures, while NOAA – which uses a different method of analyzing temperature data – said that 2013 tied with 2003 as 4th-warmest year globally since 1880.

“The long-term trends are very clear, and they’re not going to disappear,” said climatologist Gavin Schmidt from NASA’s Goddard Institute for Space Studies (GISS). “It isn’t an error in our calculations.”

Land and ocean global temperatures in 2013 from both NASA and NOAA. Via NASA.

NASA data shows that since 1950, average temperatures have increased 1.1°F to an average of 58.3° in 2013.

NOAA data shows the average temperature across global land and ocean surfaces was 1.12 degrees above the 20th-century average. This is the 37th consecutive year that the annual temperature was above the long-term average.

This coincides with another recent study that showed the so-called “pause” in global warming is not happening, and that the temperatures over the past 15 years are still on the rise.

Both NASA and NOAA scientists say the increase in greenhouse gas levels continue to drive the temperature increase.

Additionally, with the exception of 1998, the 10 warmest years in the 134-year record all have occurred since 2000, with 2010 and 2005 ranking as the warmest years on record.

NASA says the average temperature in 2013 was 58.3 degrees Fahrenheit (14.6 Celsius), which is 1.1 F (0.6 C) warmer than the mid-20th century baseline. The average global temperature has risen about 1.4 degrees F (0.8 C) since 1880, according to the new analysis. Exact rankings for individual years are sensitive to data inputs and analysis methods.

“Long-term trends in surface temperatures are unusual and 2013 adds to the evidence for ongoing climate change,” GISS climatologist Gavin Schmidt said. “While one year or one season can be affected by random weather events, this analysis shows the necessity for continued, long-term monitoring.”

Scientists emphasize that weather patterns always will cause fluctuations in average temperatures from year to year, but the continued increases in greenhouse gas levels in Earth’s atmosphere are driving a long-term rise in global temperatures. Each successive year will not necessarily be warmer than the year before, but with the current level of greenhouse gas emissions, scientists expect each successive decade to be warmer than the previous.

More from NASA:

Carbon dioxide is a greenhouse gas that traps heat and plays a major role in controlling changes to Earth’s climate. It occurs naturally and also is emitted by the burning of fossil fuels for energy. Driven by increasing man-made emissions, the level of carbon dioxide in Earth’s atmosphere presently is higher than at any time in the last 800,000 years.

The carbon dioxide level in the atmosphere was about 285 parts per million in 1880, the first year in the GISS temperature record. By 1960, the atmospheric carbon dioxide concentration, measured at the National Oceanic and Atmospheric Administration’s (NOAA) Mauna Loa Observatory in Hawaii, was about 315 parts per million. This measurement peaked last year at more than 400 parts per million.

While the world experienced relatively warm temperatures in 2013, the continental United States experienced the 42nd warmest year on record, according to GISS analysis. For some other countries, such as Australia, 2013 was the hottest year on record.

The temperature analysis produced at GISS is compiled from weather data from more than 1,000 meteorological stations around the world, satellite observations of sea-surface temperature, and Antarctic research station measurements, taking into account station history and urban heat island effects. Software is used to calculate the difference between surface temperature in a given month and the average temperature for the same place from 1951 to 1980. This three-decade period functions as a baseline for the analysis. It has been 38 years since the recording of a year of cooler than average temperatures.

The GISS temperature record is one of several global temperature analyses, along with those produced by the Met Office Hadley Centre in the United Kingdom and NOAA’s National Climatic Data Center in Asheville, N.C. These three primary records use slightly different methods, but overall, their trends show close agreement.

You can read NASA’s press release here, and NOAA’s here. Here is a link to a presentation of the data released today from Gavin Schmidt of NASA and Tom Karl, director of NOAA’s Climatic Data Center.

Editor’s note: First quote from Gavin Schmidt is from Jacob Ward on Twitter.