An iceberg the size of South Georgia Island is on a collision course with... South Georgia Island. Image Credit: contains modified Copernicus Sentinel data (2017–20), processed by ESA; Antarctic Iceberg Tracking Database
Back in July 2017, satellites watched as an enormous iceberg broke free from Antarctica’s Larsen C ice shelf on the Antarctic Peninsula. The trillion-ton behemoth has been drifting for over three years now. While it stayed close to its parent ice shelf for the first couple of years, it’s now heading directly for a collision with South Georgia Island.
It could be a slow-motion collision, but a collision nonetheless. If it does collide with the island and its shallow sea-floor, it won’t be the first iceberg to do so. And if the first one was any indication, wildlife could suffer.
Image of a telescope at Dome Argus, one of the coldest places on Earth. Credit: Zhaohui Shang
Twinkling stars might make for spectacular viewing on a hot summer’s night, but they are an absolute nightmare to astronomers. That twinkling is caused by disturbances in the Earth’s atmosphere, and can wreak havoc on brightness readings, a key tool for astronomers everywhere. Those readings are used for everything from understanding galaxy formation to the detection of exoplanets.
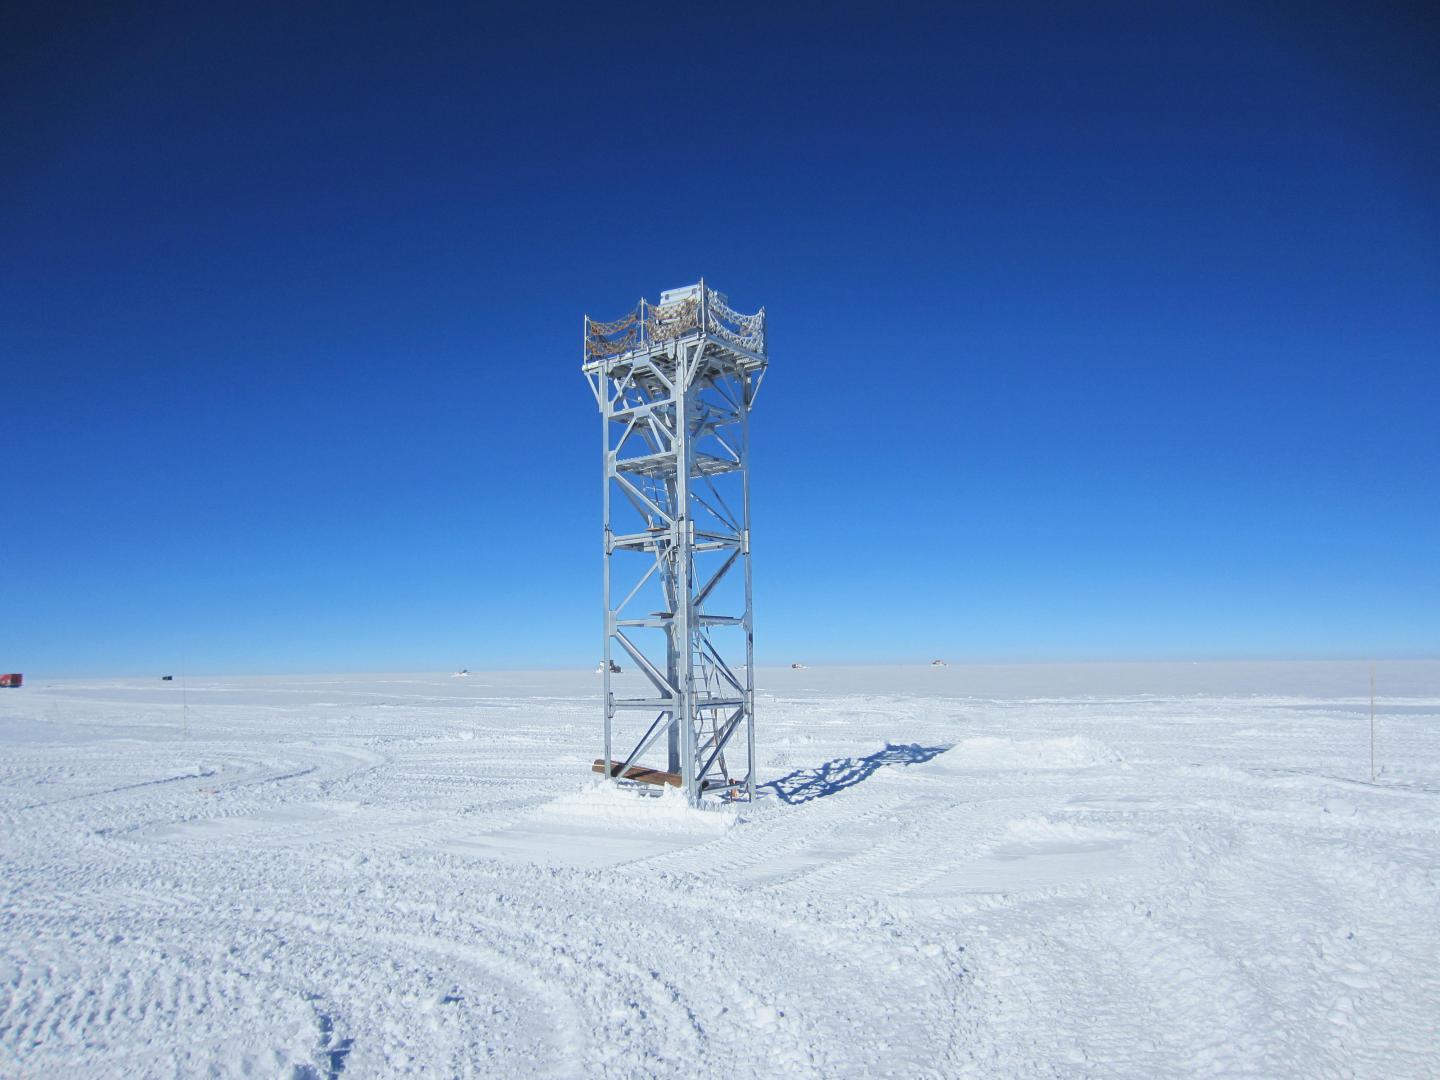
Astronomers now have a new potential location to try to avoid the twinkling. Only one problem though: it’s really cold, especially this time of year. A team of astronomers from Canada, China, and Australia have identified a part of Antarctica as the ideal place to put observational telescopes. Now the challenge becomes how to actually build one there.
A bloom of green algae on the snow on Anchorage Island, Antarctica. Image Credit: Davey et al, 2020
The Antarctic Peninsula is the northernmost part of Antarctica, and has the mildest climate on the continent. In January, the warmest part of the year, the temperature averages 1 to 2 °C (34 to 36 °F). And it’s getting warmer.
Those warm temperatures allow snow algae to grow, and now scientists have used remote sensing to map those algae blooms.
Floating ice at the calving front of Greenland's Kangerdlugssuaq glacier, photographed in 2011 during Operation IceBridge (Credit: NASA/Michael Studinger)
The Super Trans-Iron Galactic Element Recorder (SuperTIGER) instrument is used to study the origin of cosmic rays. (Photo: Wolfgang Zober)
In 2012, the balloon-borne observatory known as the Super Trans-Iron Galactic Element Recorder (SuperTIGER) took to the skies to conduct high-altitude observations of Galactic Cosmic Rays (GCRs). Carrying on in the tradition of its predecessor (TIGER), SuperTiger set a new record after completing a 55-day flight over Antarctica – which happened between December of 2012 and January of 2013.
On December 16th, 2019, after multiple launch attempts, the observatory took to the air again and passed over Antarctica twice in the space of just three and a half weeks. Like its predecessor, SuperTIGER is a collaborative effort designed to study cosmic rays – high-energy protons and atomic nuclei – that originate outside of our Solar System and travel through space at close to the speed of light.
An underwater rover called BRUIE is being tested in Antarctica to look for life under the ice. Developed by engineers at NASA-JPL, the robotic submersible could one day explore ice-covered oceans on moons like Europa and Enceladus. BRUIE is pictured here in an arctic lake near Barrow, Alaska in 2015. Credit: NASA/JPL
Not all rovers are designed to roam around on the surface of other worlds like Mars. One rover, at least, is aquatic; a necessary development if we’re going to explore Enceladus, Europa, and the Solar System’s other watery worlds. This rover is called the Buoyant Rover for Under-Ice Exploration, or BRUIE.
A slice from the LaPaz 02342 meteorite which contains dust grains from an ancient comet. Image Credit: Carnegie Institution/Nittler et. al. 2019.
The early days of the Solar System are hard to piece together from our vantage point, billions of years after it happened. Now a team of scientists have found a tiny chunk of an ancient comet inside an ancient meteorite. They say it sheds light on the early days of the Solar System when planets were still forming.
The Brunt Ice Shelf is about to calve an ice berg more than twice as large as New York City. Image: British Antarctic Survey.
An ice shelf in Antarctica is about to give birth to a baby. This baby is a giant, spawned by growing cracks in the Brunt Ice Shelf. It’s not clear what this’ll mean to the scientific infrastructure in the area, and to the human presence, which were both established in the 1950s.
A view of mountains and glaciers in Antarctica’s Marie Byrd Land seen during the Nov. 2, 2014, IceBridge survey flight. Credit: NASA / Michael Studinger
One of the benefits of the Space Age is the way it has allowed human beings to see Earth in all of its complexity and splendor. In addition, it has allowed us to conduct studies of Earth’s surface and atmosphere from orbit, which helps us to see the impact we have on our the planet. It is with this purpose in mind that NASA’s Earth Observation Program has been monitoring the Arctic and Antarctic for many years.
For instance, Operation IceBridge has spent much of the past decade monitoring the Antarctic ice sheet for signs of cracks and flows. The purpose of this is to determine how and at what rate the ice sheet is changing due to Climate Change. Recently, NASA crews conducted a flight over the southern Antarctic Peninsula as part of Operation IceBridge ninth year, which resulted in some stunning pictures of the icy landscape.
The flight took place on November 4th, 2017, as part of IceBridge’s “Endurance West” mission to study sea ice. The path they chose follows the ground track of NASA’s Ice, Cloud, and land Elevation Satellite-2 (ICESat-2), an ice-mapping satellite that is scheduled for launch in late 2018. This path began at the northern tip of the Antarctic Peninsula and then moved southward across the Weddell Sea.
Semi-permanent cracks on the Antarctic Peninsula. Credit: NASA/Digital Mapping System.
The images the crew took aboard their P3 research plane were captured by a Digital Mapping System, a downward-pointing camera that collects thousands of high-resolution photographs during a single flight. While traveling over the southern Antarctic Peninsula, they imaged a landscape that resembled rapids, where the motion of rivers becomes amplified as the water flows through steeper, narrower terrain.
In a similar fashion, as ice flows through narrower canyons and down steeper bedrock, more fractures appear at the surface. But of course, the rate at which this takes place is much slower, which can make discerning movement in the ice sheet rather difficult. The first image (shown above) shows ice flowing into the southern part of the George VI ice shelf, which is located in Palmer Land south of the Seward Mountains.
In this location, cracks are likely to be a regular feature that form as the ice flows over the bedrock. However, since the ice flow is relatively slow (even on the steeper part of the bedrock), the surface cracks are not as dramatic as in other regions. For example, the second image (shown below), which shows a heavily crevassed glacier that measures about 21 km (13 mi) long and 11 km (7 mi) wide.
The glacier appears to be flowing west from the Dyer Plateau to George VI Sound while the north side merges with the Meiklejohn Glacier. The third image (bottom) shows a heavily crevassed glacier north of Creswick Peaks that also flows west into George VI Sound. In short, the pictures confirm that ice on the southern end of the Antarctic Peninsula is flowing towards the ocean.
A heavily crevassed glacier flows west from the Dyer Plateau. Credit: NASA/Digital Mapping System
The purpose of IceBridge, which has been conducting regular measurements in the Antarctic Peninsula since 2009, has been to study just how fast and to what extent Climate Change has been impacting the region. While ice sheet loss is a well-documented phenomenon, scientists have known for some time that the most dramatic losses in Antarctica occur along its western side.
In addition, research has shown that the southern part of the peninsula is particularly vulnerable, as the glaciers and ice shelves there have become destabilized and are slowly feeding into the sea. And unlike sea ice, the land ice in this region has the potential to raise sea levels around the world. As Michael Studinger, the project manager for IceBridge, describes the operation:
“IceBridge exists because we need to understand how much ice the Greenland and Antarctic ice sheets will contribute to sea level rise over the next couple of decades. In order to do this, we need to measure how much the ice surface elevation is changing from year to year.”
Knowing how significant the impact of Climate Change will be is the first step in developing countermeasures. It also serves as a stark reminder that the problem exists, and that solutions need to be found before it is too late.
Illustration of flowing water under the Antarctic ice sheet. Blue dots indicate lakes, lines show rivers. Marie Byrd Land is part of the bulging "elbow" leading to the Antarctic Peninsula, left center. Credits: NSF/Zina Deretsky
Beneath the Antarctic ice sheet, there lies a continent that is covered by rivers and lakes, the largest of which is the size of Lake Erie. Over the course of a regular year, the ice sheet melts and refreezes, causing the lakes and rivers to periodically fill and drain rapidly from the melt water. This process makes it easier for Antarctica’s frozen surface to slide around, and to rise and fall in some places by as much as 6 meters (20 feet).
According to a new study led by researchers from NASA’s Jet Propulsion Laboratory, there may be a mantle plume beneath the area known as Marie Byrd Land. The presence of this geothermal heat source could explain some of the melting that takes place beneath the sheet and why it is unstable today. It could also help explain how the sheet collapsed rapidly in the past during previous periods of climate change.
Glaciers seen during NASA’s Operation IceBridge research flight to West Antarctica on Oct. 29, 2014. Credit: NASA/Michael Studinger
The motion of Antarctica’s ice sheet over time has always been a source of interest to Earth scientists. By measuring the rate at which the ice sheet rises and falls, scientists are able to estimate where and how much water is melting at the base. It is because of these measurements that scientists first began to speculate about the presence of heat sources beneath Antarctica’s frozen surface.
The proposal that a mantle plume exists under Marie Byrd Land was first made 30 years ago by Wesley E. LeMasurier, a scientist from the University of Colorado Denver. According to the research he conducted, this constituted a possible explanation for regional volcanic activity and a topographic dome feature. But it was only more recently that seismic imaging surveys offered supporting evidence for this mantle plume.
However, direct measurements of the region beneath Marie Byrd Land is not currently possible. Hence why Seroussi and Erik Ivins of the JPL relied on the Ice Sheet System Model (ISSM) to confirm the existence of the plume. This model is essentially a numerical depiction of the physics of the ice sheet, which was developed by scientists at the JPL and the University of California, Irvine.
To ensure that the model was realistic, Seroussi and her team drew on observations of changes in altitude of the ice sheet made over the course of many years. These were conducted by NASA’s Ice, Clouds, and Land Elevation Satellite (ICESat) and their airborne Operation IceBridge campaign. These missions have been measuring the Antarctic ice sheet for years, which have led tot he creation of very accurate three-dimensional elevation maps.
A view of mountains and glaciers in Antarctica’s Marie Byrd Land seen during the Nov. 2nd, 2014, IceBridge survey flight. Credit: NASA / Michael Studinger
Seroussi also enhanced the ISSM to include natural sources of heating and heat transport that result in freezing, melting, liquid water, friction, and other processes. This combined data placed powerful constrains on the allowable melt rates in Antarctica, and allowed the team to run dozens of simulations and test a wide range of possible locations for the mantle plume.
What they found was that the heat flux caused by the mantle plume would not exceed more than 150 milliwatts per square meter. By comparison, regions where there is no volcanic activity typically experience a feat flux of between 40 and 60 milliwatts, whereas geothermal hotspots – like the one under Yellowstone National Park – experience an average of about 200 milliwatts per square meter.
Where they conducted simulations that exceeded 150 millwatts per square meter, the melt rate was too high compared to the space-based data. Except in one location, which was an area inland of the Ross Sea, which is known to experience intense flows of water. This region required a heat flow of at least 150 to 180 milliwatts per square meter to align with its observed melt rates.
In this region, seismic imaging has also shown that heating might reach the ice sheet through a rift in the Earth’s mantle. This too is consistent with a mantle plume, which are thought to be narrow streams of hot magma rising through the Earth’s mantle and spreading out under the crust. This viscous magma then balloons under the crust and causes it to bulge upward.
Temperature changes in the Antarctic ice sheet over the last 50 years, measured in degrees Celsius. Credit: NASA/GSFC Scientific Visualization Studio
Where ice lies over top of the plume, this process transfers heat into the ice sheet, triggering significant melting and runoff. In the end, Seroussi and her colleagues provide compelling evidence – based on a combination of surface and seismic data – for a surface plume beneath the ice sheet of West Antarctica. They also estimate that this mantle plume formed roughly 50 to 110 million years ago, long before the West Antarctic ice sheet came into existence.
Roughly 11,000 years ago, when the last ice age ended, the ice sheet experienced a period of rapid, sustained ice loss. As global weather patterns and rising sea levels began to change, warm water was pushed closer to the ice sheet. Seroussi and Irvins study suggests that the mantle plume could be facilitating this kind of rapid loss today, much as it did during the last onset of an inter-glacial period.
Understanding the sources of ice sheet loss under West Antarctica is important as far as estimating the rate at which ice may be lost there, which is essentially to predicting the effects of climate change. Given that Earth is once again going through global temperature changes – this time, due to human activity – it is essential to creating accurate climate models that will let us know how rapidly polar ice will melt and sea levels will rise.
It also informs our understanding of how our planet’s history and climate shifts are linked, and what effect these had on its geological evolution.