Is anybody listening?
Smart people tell us that when it comes to conveying the reality of climate change, and the threat it poses, people don't respond to facts. We respond to stories and narratives. We're a narrative-driven species.
But at Universe Today we know that facts underlie every good story. And the facts regarding ice loss in Greenland and Antarctica are not good.
“Every centimetre of sea level rise leads to coastal flooding and coastal erosion, disrupting people’s lives around the planet." Prof. Andrew Shepherd, University of Leeds, IMBIE
These latest findings, showing that both Greenland and Antarctica are losing their ice six times faster than in the 1990s, were published in the journal Nature. Unfortunately, but not necessarily surprisingly, these results are in line with the IPCC's (International Panel on Climate Change) worst-case scenario predictions.
One of the papers is titled " Mass balance of the Greenland Ice Sheet from 1992 to 2018. " It gives author credit to 'The IMBIE Team.' IMBIE is the Ice Sheet Mass Balance Inter-comparison Exercise. Andrew Shepherd from the University of Leeds and Erik Ivins at NASA's Jet Propulsion Laboratory lead IMBIE.
IMBIE is an international collaboration of polar scientists, with both NASA and the European Space Agency playing leading roles. In their latest release, they start by looking at the recent past. Between 1992 and 2017, Greenland and Antarctica lost a combined total of 6.4 trillion tons of ice. That pushed sea levels up by 17.8 millimeters.
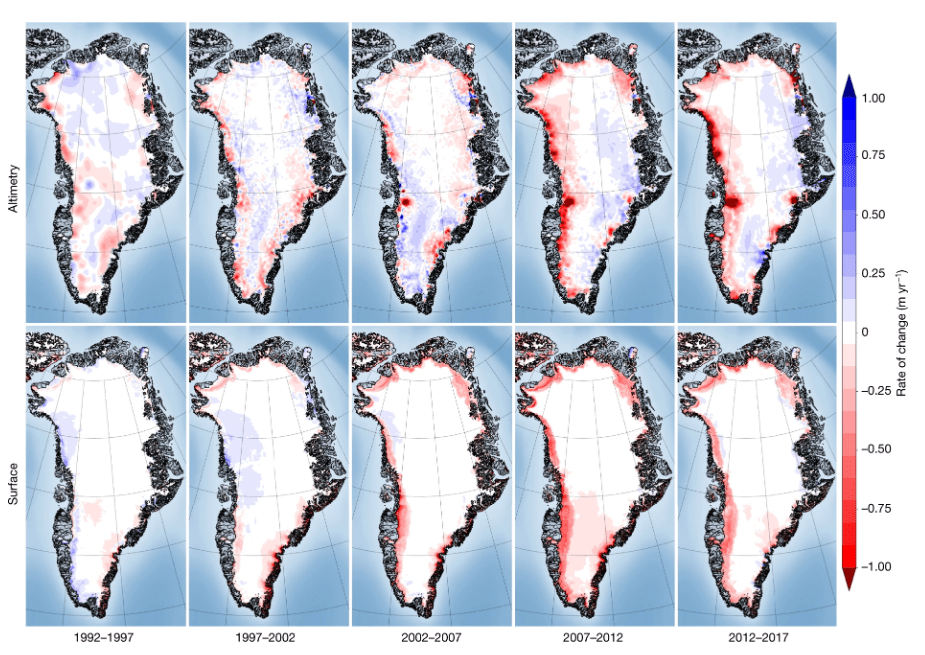
Antarctic ice melting accounted for about 60% of the rise, or 10.6 mm. Greenland's melting accounted for the remainder.
In only three decades, melting has increased six-fold. That's from roughly 81 billion tons per year in the 1990s to 475 billion tons per year in the 2010s. This the conclusion: The melting of our polar ice sheets contributed one-third of all sea level rise in that time-frame.
The data behind these conclusions comes from a total of 11 satellites. The 11 includes the EU's (European Union) Copernicus Sentinel-1 and Sentinel-2 missions, as well as the ESA's Envisat and CryoSat missions.
The scientific term for the large-scale loss of ice in the polar sheets is 'mass balance.' It's like an equation with ice on one side and sea levels on the other. And right now, one side of that equation growing, at the expense of the other. Prof. Shepherd explains, "Every centimetre of sea level rise leads to coastal flooding and coastal erosion, disrupting people's lives around the planet."
"If Antarctica and Greenland continue to track the worst-case climate warming scenario, they will cause an extra 17 centimetres of sea level rise by the end of the century," said Shepherd. "This would mean 400 million people are at risk at annual coastal flooding by 2100. These are not unlikely events with small impacts; they are already underway and will be devastating for coastal communities."
So, what are we going to do? Hoard toilet paper?
For scientists, the mission is clear: keep working cooperatively to gather data and keep presenting it clearly. And satellites play a huge role in monitoring the planet's melting ice sheets.
ESA's Director of Earth Observation Programmes, Josef Aschbacher, comments, "The findings reported by IMBIE demonstrate the fundamental importance of using satellite data to monitor the evolution of ice sheets. IMBIE is also a prime example of how the best science teams in Europe and the US have worked in an exemplary way together to address some burning questions of science."
The International Panel on Climate Change was created by the United Nations way back in 1988. Its role is to gather the data on climate change and present reports, specifically to policy-makes in the UN's member nations. This new release from IMBIE confirms the IPCC's worst-case scenario: global sea levels will rise 60 centimetres by the year 2100.
In fact, this new IMBIE report exceeds the IPCC's worst-case scenario. Emissions are rising faster than expected, not falling at all, and melting has increased since observations began.
Guðfinna Aðalgeirsdóttir, Professor of Glaciology at the University of Iceland and lead author of the Intergovernmental Panel on Climate Change's sixth assessment report, commented, "The IMBIE Team's reconciled estimate of Greenland and Antarctic ice loss is timely for the IPCC. Their satellite observations show that both melting and ice discharge from Greenland have increased since observations started."
The amount of ice lost during each year can fluctuate. Sometimes, a single year will have less ice loss than the trend, and optimism briefly blooms. But the trend is consistent, and though Antarctica and Greenland host the two largest sheets, other ice sheets around the world are also under scientific scrutiny.
"The ice caps in Iceland had similar reduction in ice loss in the last two years of their record, but summer 2019 was very warm in this region which resulted in higher mass loss," Aðalgeirsdóttir said in a press release. "I would expect a similar increase in Greenland mass loss for 2019. It is very important to keep monitoring the big ice sheets to know how much they raise sea level every year."
Antarctica and Greenland experience melting in different ways. In Antarctica, almost all of the ice loss is due to the warming oceans. As the outlet glaciers reach the ocean, they're melting more quickly, causing them to speed up. It's like conveyor belt of ice, and our emissions are the throttle.
The largest glacier in Antarctica is the Lambert Glacier. It's also one of the largest in the world, with a length of over 400 km and an area of 1 million square km. It feeds into the Amery Ice Shelf, which is where the glacier leaves underlying land and floats on the water.
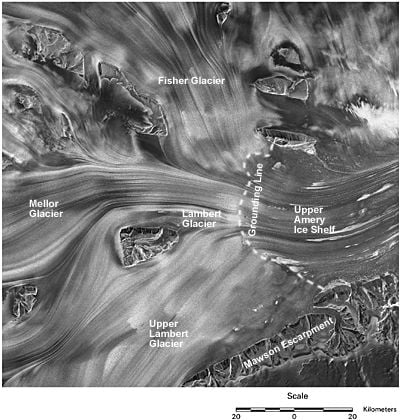
The warming ocean is eating away at the Amery Ice Shelf, making it melt faster and making the Lambert Glacier travel faster. The rate of travel has been monitored by satellite, and those observations clearly show the glacier speeding up at the ocean.
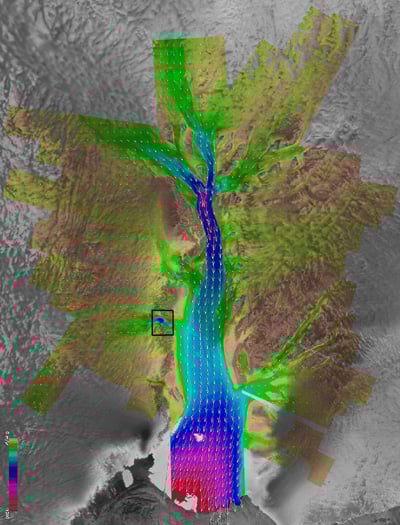
Greenland suffers ice loss through contact with the ocean too, but that accounts for only about half of its ice loss. The other half is due to warmer air.
We all know that our emissions are behind this. It doesn't matter what political outlook you subscribe to. Science tells us what's happening, and the evidence is overwhelming. This report is just one more piece.
Cool story, huh?