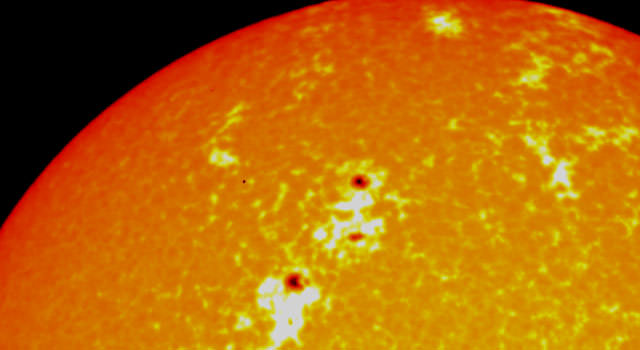
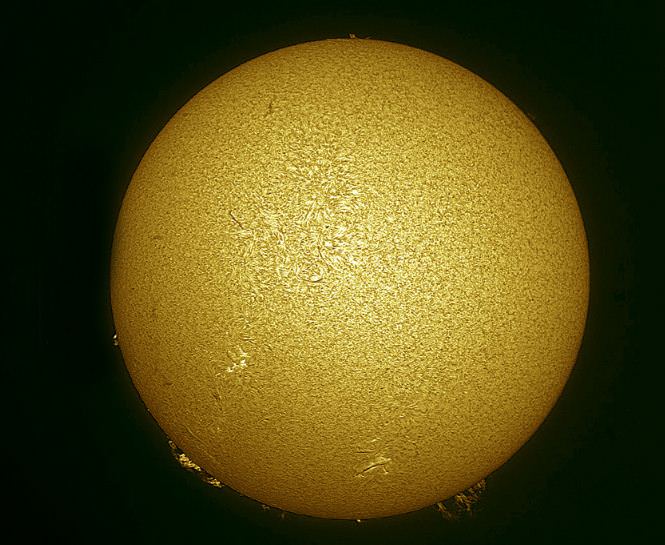
The Sun on July 11, 2011. Credit: Cesar Cantu from Monterrey, Mexico, and the Chilidog Observatory. Click for high resolution version.
Interesting activity captured on the Sun early today (July 12, 2011) showing an active region on the Sun’s Eastern limb. Plasma was hurled very high above the stellar surface, but didn’t have the needed escape velocity and most of the plasma “rained” back down in a fountain. The video shows the activity in different wavelengths.
See below for more views, including the first time a sun-grazing comet was seen disintegrating over the Sun’s surface.
[/caption]
This great ground-based look at the Sun is from July 11, 2011. “A sun a little more active than the past few days, although with much mist in the city, making it impossible to get photos of larger increases,” said Cesar Cantu from Monterrey, Mexico, with his Chilidog Observatory. See more at his website, Astronomía Y Astrofotografía.
The Solar Dynamics Observatory AIA imager spotted a sun-grazing comet zooming across the face of the sun and disintegrating over about a 15 minute period on July 6, 2011. This has never observed before. It’s a little difficult to see, but look closely as a line of light appears in the right just off the edge of the Sun and move across to the left. The angle of the comet’s orbit brought it across the front half of the Sun.Given the intense heat and radiation, the comet simply evaporated away completely. SDO scientists say the comet was probably a member of the Kreutz sun-grazer family. The AIA imager took this video in extreme ultraviolet.
Within our own lives, one of the most powerful forces is that of the Sun. Directly or indirectly, it provides all of the energy we use on a daily basis. Yet this mass of incandescent plasma is often a mere afterthought. But not to be forgotten, writer for Astronomy magazine, Bob Berman makes the Sun the focus of a new book, The Sun’s Heartheat which explores how our parent star affects our lives in ways more direct than we might expect. The book is due to be released July 13th, but I got a review copy to tell everyone about.
The book is a short read clocking in at a quick 20 chapters. Roughly the first third of them is a brief history of solar astronomy. Most of this is concentrated on the history of observations of sunspots. It goes through the initial discoveries, the waxing and waning of popularity of sunspots thanks to the Maunder minimum, and Schwabe’s discovery of the cycles.
Once that’s ironed out, we get to what I consider to be the main theme of the book: How does the Sun affect us here on Earth? The first topics addressed are rather germane: The sun brings life, but too much of it can kill you. But after that, the topics are a bit more interesting. There’s a fantastic chapter on the importance of getting adequate supplies of vitamin D which your body produces naturally from exposure to the Sun. Another chapter deals with the way the Sun doesn’t affect us: Astrologically. The book discusses our ability to see colors and the impressiveness of total solar eclipses and auroras.
The second to last chapter covers just how much peril we face from a large coronal mass ejection. I was familiar with nearly everything in the book, including this chapter, but I think this chapter was my favorite. Sadly, most people are disinterested in science, but more than any other, this one was tangible enough to be rather alarming.
It closes with a preview of the future Sun, describing how its slow increase in brightness will make life on Earth unfavorable in a billion years or so and how it will eventually expand into a red giant.
If you’re an experienced astronomy enthusiast, this book will likely offer little new information on the Sun itself, although it does have lots of good backstories on some of the discoveries and those involved. It is engaging thanks to a friendly tone, even if Berman does have an odd fascination with anachronisms (17th century HMO’s?). The book lacked several of the deeper topics that I feel could have been more inviting for advanced readers such as a more thorough description of our knowledge of the innards of the Sun thanks to helioseismology. I suspect this is because it didn’t relate strongly enough to the main thesis aside from a general, how the Sun works which doesn’t focus on how it affects us.
But if you know a young astronomer, or someone older just getting into the field, or someone that’s stared only at deep sky objects and never thought much about the closest star to home, this book would likely be of some interest.
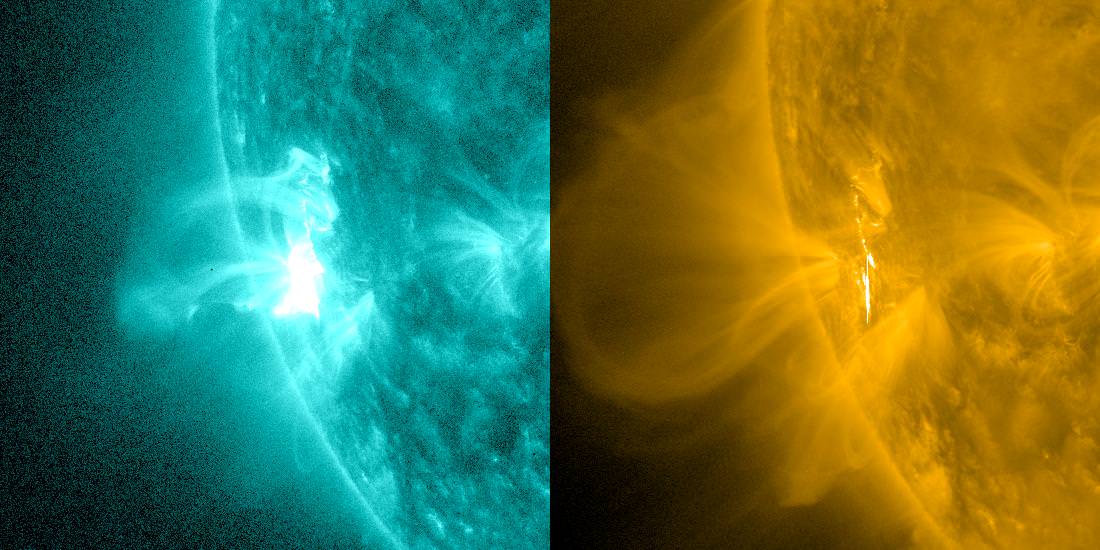
On the left, SDO AIA image at the wavelength of 131 angstroms observing the Sun’s atmosphere at a temperature of about ten million degrees. The magnetic rope is seen as the thick looped structure extending above the edge of the Sun. On the right, SDO AIA image at wavelength 171 angstroms observing the corona at a temperature of about one million degrees, showing surrounding cool magnetic field lines are pushed away by the intruding magnetic rope seen on the left. Both images are taken almost simultaneously (within three seconds of each other) at 03:41 UT. (Credit: NASA and George Mason University).
[/caption]
It is our current understanding that the Sun’s magnetic fields and field lines are the cause of solar storms. However, there is no solid evidence as to what form magnetic field lines may take ahead of an energetic outbreak. We know there can be loops connected to the surface – but normally they take the sting off an eruption, rather than cause one. Thanks to a discovery made by associate professor Jie Zhang and his graduate student Xin Cheng using images from the NASA Solar Dynamics Observatory (SDO) spacecraft, we’re shedding a little light on a solar mystery.
An event called a magnetic rope is assumed to be the progenitor of solar storms – but its existence was far from certain. The phenomena may consist of many magnetic field lines wrapping around a center axis – possibly twisting around each other – and producing an electric current. The current might then be able to generate enough electromagnetic force to overpower the withholding magnetic field lines and cause the rope to move outward at speeds we so far haven’t been able to document… Until now.
Thanks to the images taken by the Atmospheric Imaging Assembly (AIA) telescope on board the SDO, Zhang was able to isolate an area of the Sun where a magnetic rope was forming. What the images provided was a unique look at an active region ahead of an eruption. Revealed was a long and low-lying channel which produces temperatures up to 10 million degrees – and continues heating. When it reaches a critical point this “hot channel” reveals a never before seen feature unlike the surrounding magnetic field lines… possibly the theoretical magnetic rope.
“The magnetic rope triggers a solar eruption. Scientists have been debating whether or not this magnetic rope exists before a solar eruption. I believe that the result of this excellent observation helps finally solve this controversial issue,” says Zhang.
As we’re all aware, it would be a boost to understand and predict solar storms. While our Earth’s “magnetic shield” protects us from the majority of direct exposure, we have satellites, astronauts and terrestrially-based power sources which could benefit from an early warning scenario.
“Understanding the eruption process of these storms will definitely help us better predict them,” says Zhang. “We cannot prevent solar storms, just like we cannot prevent earthquakes or volcanoes. But the development of prediction capacity can help mitigate adverse effects. For instance, satellite operators can power-down key systems to prevent the possible damage to the systems.”
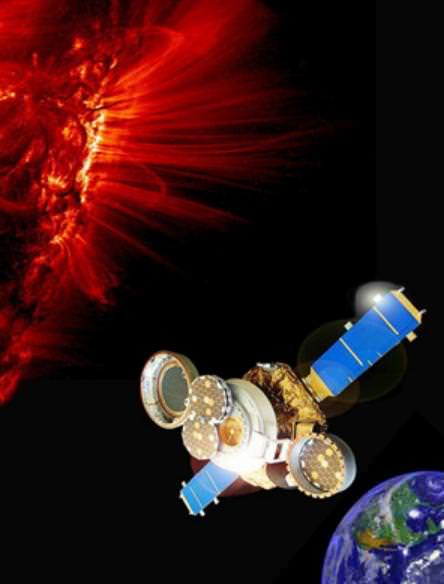
For 886 days between 2001 and 2004, a tiny spacecraft named Genesis sat parked at Lagrange Point L1 quietly collecting solar wind samples. On Sept. 8, 2004, the spacecraft released a sample return capsule which bashed its way onto the Utah desert carrying its little payload. Despite the disastrous crash, solar-wind ions were found buried beneath the surface of the collectors and what they have to tell us about the possible formation of our solar system is pretty amazing.
In March 2005 the international scientific community was given the collectors to study – and one of their prime targets was the evolution of our solar system. How could these tiny particles give us clues as to our origin? According the bulk of evidence, it is surmised the outer layer of the Sun hasn’t changed in several billion years. If we are to agree this is a good basis for modeling our solar nebula, we could begin to understand the chemical processes which formed our solar system. For most rock-forming elements, there appears to be little fractionation of either elements or isotopes between the sun and the solar wind. Or is there?
“The implication is that we did not form out of the same solar nebula materials that created the sun — just how and why remains to be discovered,” said Kevin McKeegan, a Genesis co-investigator from the University of California, Los Angeles and the lead author of one of two Science papers published this week.
Using the deposits found on the collector plates, scientists found a higher rate of common oxygen isotopes and a lowered rate of rare ones – different from Earth’s ratios. The same held true of nitrogen composition.
“These findings show that all solar system objects, including the terrestrial planets, meteorites and comets, are anomalous compared to the initial composition of the nebula from which the solar system formed,” said Bernard Marty, a Genesis co-investigator from Centre de Recherches Petrographiques et Geochimiques in Nancy, France and the lead author of the second new Science paper. “Understanding the cause of such a heterogeneity will impact our view on the formation of the solar system.”
While more studies are in the making, this new evidence provides vital information which may correct how we initially perceived our beginnings. While these elements are the most copious of all, even slight differences make them as distinctive as salt and pepper.
“The sun houses more than 99 percent of the material currently in our solar system so it’s a good idea to get to know it better,” said Genesis principal investigator Don Burnett of the California Institute of Technology in Pasadena, Calif. “While it was more challenging than expected we have answered some important questions, and like all successful missions, generated plenty more.”
The Halo coronal mass ejection (CME) as viewed by the Solar and Heliospheric Observatory coronograph on June 21, 2011. Credit: NASA/SOHO
[/caption]
Late in the evening on June 20, 2011 the Sun emitted a long lasting C7.7 class flare (a relatively small flare) that peaked around 11:25p.m. EDT. The flare was associated with a coronal mass ejection that bloomed off the sun at 11:09p.m. EDT (0412 UT).
Spaceweather.com reports that according to analysts at the Goddard Space Flight Center Space Weather Lab, the CME left the sun traveling 800 km/s and it will reach Earth on June 23rd at 23:22 UT (plus or minus 7 hours). A very cool 3D heliospheric model (below) shows the cloud sweeping past our planet. The impact is expected to trigger a G2-class geomagnetic storm.
High-latitude sky watchers should be alert for auroras on June 23rd and 24. The season favors southern hemisphere observers, where skies are darker for longer due to the winter solstice.
These 3D Heliospheric animated models, developed by the Community Coordinated Modeling Center based at the Goddard Space Flight Center, show how the CME cloud might appear as it sweeps past Earth. Credit: NASA/CCMC
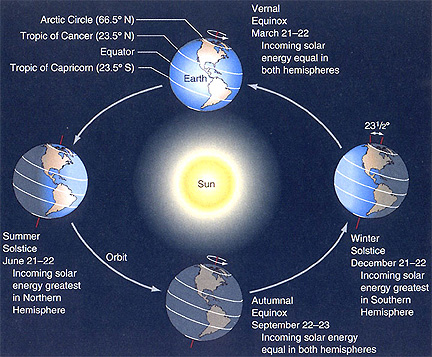
June 21st, 2011 is Summer Solstice – the longest day of the year.
This is the time when the Sun is at its highest or most northerly point in the sky in the Northern Hemisphere and when we receive the most hours of daylight. If you live in the Southern Hemisphere it is the reverse, so you will be having “Winter Solstice.”
Also known as “Midsummer” the Summer Solstice gets its name from the Latin for sol (sun) and sistere (to stand still). The Sun reaches its most Northerly point and momentarily stands still before starting its journey South in the sky again until it reaches its most Southerly point “Winter Solstice”, before repeating the cycle. This is basically how we get our seasons.
It’s not actually the Sun that moves North or South over the seasons although it may appear so. It’s the Earths axial tilt that causes the Sun to change position in the sky as the Earth orbits the Sun throughout the year.
The angle of the Sun and the Earth's seasons. Image credit: NASA
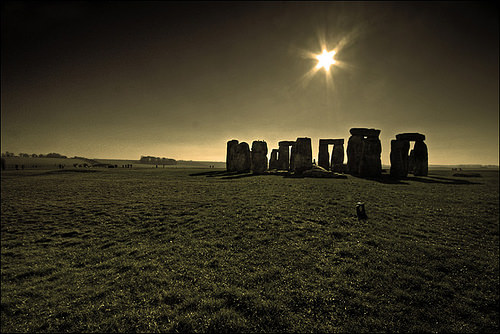
Summer Solstice/ Midsummer is steeped in ancient folklore especially in Northern Europe with the most famous place directly related to it being Stonehenge, where the sun has been worshiped for thousands of years.
Stonehenge Credit: bistrochic.net
The Sun reaches its most Northerly point in the sky at 17:16 UTC momentarily and from that point forward starts to make its way South. This means the days will get shorter and shorter until Winter Solstice in December.
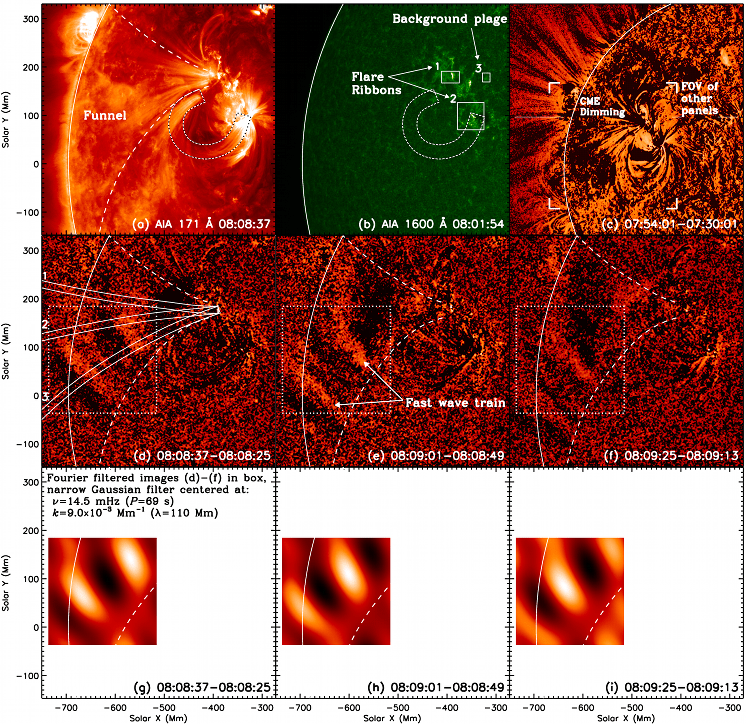
Time to grab your silver surfboards because scientists utilizing the Atmospheric Imaging Assembly (AIA) instrument on-board NASA’s Solar Dynamics Observatory (SDO), have picked up on quasi-periodic waves in the low solar corona that travel at speeds as high as 2,000 kilometers per second (4.5 million miles per hour). Just think… We could ride that tasty wave to the Moon and back about 16 times during lunch break and still have time for coffee!
Presenting the findings today at the annual meeting of the Solar Physics Division of the American Astronomical Society is Dr. Wei Liu, a Stanford University Research Associate at the Lockheed Martin Solar and Astrophysics Laboratory (LMSAL) at the company’s Advanced Technology Center (ATC) in Palo Alto. His research has provided concrete evidence of propagating fast mode magnetosonic waves at such high speeds in the Sun’s low atmosphere. We’ve known for awhile that hot plasma will produce a “ripple effect” – much like a bubble popping to the surface when heating gravy. While computer simulations, models and theories speculated how it occurred, it wasn’t until now that these waves have been directly observed. Why? Because we simply weren’t quick enough.
“It is the high temporal and spatial resolution of AIA that enables us to see these waves clearly for the first time. AIA takes high sensitivity, extreme ultraviolet (EUV) pictures of the solar corona at spatial scales down to 1,100 kilometers, every 12 seconds with 0.1-2 second exposures,” said Dr. Liu, who led the analysis of the waves. “In addition, AIA’s full Sun field of view at seven simultaneous wavelengths allows us to track them over large spatial and temperature ranges.”
Just check this bad boy out…
Lasting anywhere from 30 to 200 seconds, the hot arches center around flare nuggets and follow the wake of coronal mass ejection areas… traveling along the magnetic loops. “Their characteristic spatial and temporal scales and dispersion relation agree with theoretical expectations of fast mode magnetosonic waves, and are reproduced in our high fidelity 3D computer simulations,” said Prof. Leon Ofman of the Catholic University of America, part of the team that made the discovery. “They seem to be a common phenomenon. During the first year of the SDO mission, despite the Sun being relatively quiet, we have seen about a dozen such waves,” said Dr. Karel Schrijver, principal physicist of LMSAL. “Although their exact trigger mechanism is currently under investigation, they appear to be intimately related to flares that sometimes exhibit pulsations at similar frequencies.”
These types of waves are quite probably responsible for elemental – yet still mysterious – processes on the solar surface, such as heating the corona to millions of degrees, accelerating the solar wind, triggering remote eruptions, and delivering energy and information between different parts of the atmosphere. Through direct observance, we’re able to begin to unravel the physics and advance our knowledge of the Sun-Earth connection.
“This discovery and analysis is very significant because we are witnessing phenomena of which we were previously unaware. In light of this discovery, the more we look at solar flares, the more of these waves we see, and as observation and analysis lead to insight, the better we will understand the processes involved,” said Dr. Alan Title, AIA Principal Investigator at LMSAL who first noticed the fast propagating waves in routine AIA movies. “The findings announced today are an example of the fruit of a two decade long collaboration, of which we are enormously proud, between Lockheed Martin and Stanford University.”
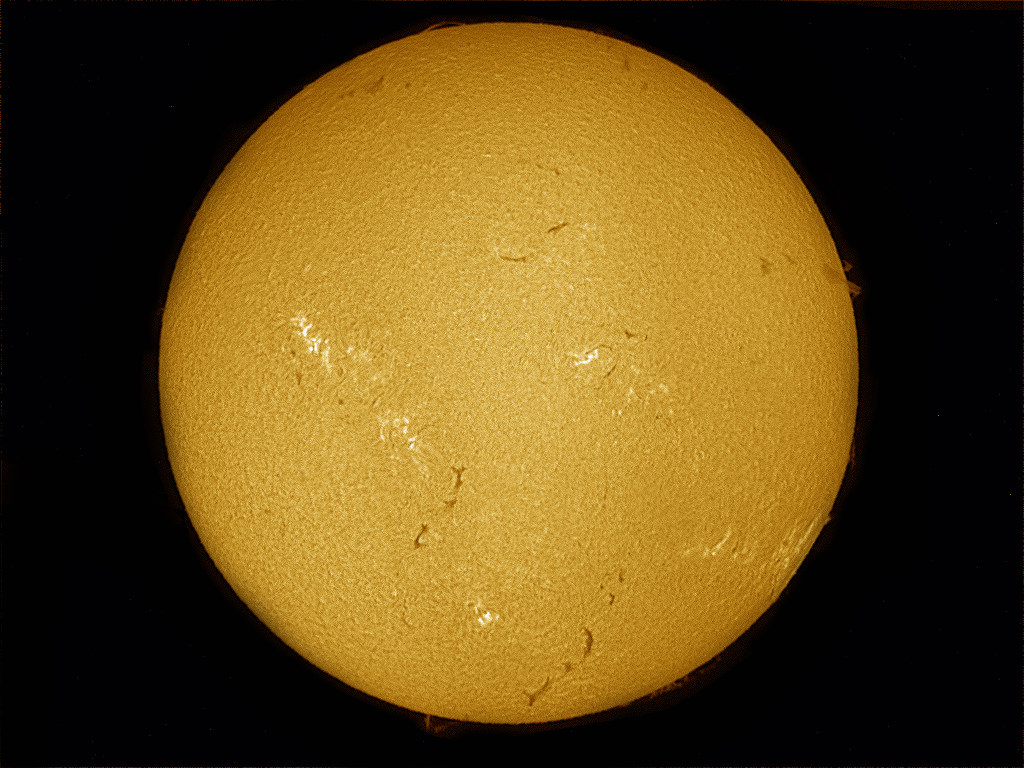
Our Sun on June 6, 2011. Credit: Credit: Cesar Cantu from the Chilidog Observatory in Monterrey, Mexico.
[/caption]
Are we headed into the 21st century version of the Maunder Minimum? Three researchers studying three different aspects of the Sun have all come up with the same conclusion: the Sun’s regular solar cycles could be shutting down or going into hibernation. A major decrease in solar activity is predicted to occur for the next solar cycle (cycle #25), and our current solar cycle (#24) could be the last typical one. “Three very different types of observations all pointing in the same direction is very compelling,” said Dr. Frank Hill from the National Solar Observatory, speaking at a press briefing today. “Cycle 24 may be the last normal one, and 25 may not even happen.”
Even though the Sun has been active recently as it heads towards solar maximum in 2013, there are three lines of evidence pointing to a solar cycle that may be going on hiatus. They are: a missing jet stream, slower activity near the poles of the sun and a weakening magnetic field, meaning fading sunspots. Hill, along with Dr. Richard Altrock from the Air Force Research Laboratory and Dr. Matt Penn from the National Solar Observatory independently studied the different aspects of the solar interior, the visible surface, and the corona and all concur that cycle 25, will be greatly reduced or may not happen at all.
Solar activity, including sunspot numbers, rises and falls on average about every 11 years – sometimes the cycles are as short as 9 years, other times it is as long as 13 years. The Sun’s magnetic poles reverse about every 22 years, so 11 years is half of that magnetic interval cycle.
"Butterfly diagram" shows the position of sunspots over 12 solar cycles. Sunspots emerge over a range of latitudes centered on migratory jet streams that follow a clear pattern, trending from higher latitudes to lower latitudes on the Sun. The active latitudes are associated with mobile zonal flows or "jet streams" that vary through the cycle. Credit: SWRI
The first line of evidence is a slowing of a plasma flow inside the Sun, an east/west flow of gases under the surface of the Sun detected via seismology with spacecraft like the Solar Dynamics Observatory (SDO)or SOHO and also with the Global Oscillation Network Group (GONG) observing stations, a system that measures pulsations on the solar surface to understand the internal structure of the sun. The flow of plasma normally indicates the onset of sunspot formation for the next solar cycle. While this river ebbs and flows during the cycle, the “torsional oscillations,” — which starts at mid-latitudes and migrates towards the equator — and normally begins forming for the next solar cycle has not yet been detected.
Latitude-time plots of jet streams under the Sun's surface show the surprising shutdown of the solar cycle mechanism. New jet streams typically form at about 50 degrees latitude (as in 1999 on this plot) and are associated with the following solar cycle 11 years later. New jet streams associated with a future 2018-2020 solar maximum were expected to form by 2008 but are not present even now, indicating a delayed or missing Cycle 25. Credit: SWRI
Hill said the above graphic is key for understanding the issue. “The flow for Cycle 25 should have appeared in 2008 or 2009 but it has not and we see no sign of it,” he said. “This indicates that the start of Cycle 25 may be delayed to 2021 or 2022, with a minimum great that what we just experienced, or may not happen at all.”
Plots of coronal brightness against solar latitude show a "rush to the poles" that reflects the formation of subsurface shear in the solar polar regions. The current "rush to the poles" is delayed and weak, reflecting the lack of new shear under the photosphere. Note the graph depicts both north and south hemispheres overlaid into one map of solar magnetic activity, and that the patterns correspond with the butterfly diagram above. Credit: SWRI
The second line of evidence is slowing of the “rush to the poles,” the rapid poleward march of magnetic activity observed in the Sun’s faint corona. Altrock said the activity in the solar corona follows same oscillation pattern described by Hill, and that they have been observing the pattern for about 40 years. The researchers now see a very weak and slow pattern in this movement.
“A key thing to understand is that those wonderful, delicate coronal features are actually powerful, robust magnetic structures rooted in the interior of the Sun,” Altrock said. “Changes we see in the corona reflect changes deep inside the Sun.”
In a well-known pattern, new solar activity emerges first at about 70 degrees latitude at the start of a cycle, then towards the equator as the cycle ages. At the same time, the new magnetic fields push remnants of the older cycle as far as 85 degrees poleward. “In previous solar cycles, solar maximum occurred when the rush to the poles reached an average latitude of 76 degrees,” Altrock said. “Cycle 24 started out late and slow and may not be strong enough to create a rush to the poles, indicating we’ll see a very weak solar maximum in 2013, if at all. It is not clear whether solar max as we know it.”
Altrock added that if the “rush” doesn’t occur, no one knows what will happen in the future because no one has modeled what takes place without this rush to the poles.
Average magnetic field strength in sunspot umbras has been steadily declining for over a decade. The trend includes sunspots from Cycles 22, 23, and (the current cycle) 24. Credit: SWRI
The third line of evidence is a long-term weakening trend in the strength of sunspots. Penn, along with his colleague William Livingston predict that by Cycle 25, magnetic fields erupting on the Sun will be so weak that few if any sunspots will be formed.
Using more than 13 years of sunspot data collected at the McMath-Pierce Telescope at Kitt Peak in Arizona, Penn and Livingston observed that the average field strength declined about 50 gauss per year during Cycle 23 and now in Cycle 24. They also observed that spot temperatures have risen exactly as expected for such changes in the magnetic field. If the trend continues, the field strength will drop below the 1,500 gauss threshold and spots will largely disappear as the magnetic field is no longer strong enough to overcome convective forces on the solar surface.
“Things are erupting on the sun,” Penn said, “but they don’t have the energy to create sunspots.”
But back in 1645-1715 was the period known as the Maunder Minimum, a 70-year period with virtually no sunspots. The Maunder Minimum coincided with the middle – and coldest part – of the Little Ice Age, during which Europe and North America experienced bitterly cold winters. It has not been proven whether there is a causal connection between low sunspot activity and cold winters. However lower earth temperatures have been observed during low sunspot activity. If the researchers are correct in their predictions, will we experience a similar downturn in temperatures?
Hill said that some researchers say that the Sun’s activity can also play a role in climate change, but in his opinion, the evidence is not clear-cut. Altrock commented he doesn’t want to stick his neck out about how the Sun’s declining activity could affect Earth’s climate, and Penn added that Cycle 25 may provide a good opportunity to find out if the activity on the Sun contributes to climate change on Earth.
Lead image thanks to César Cantú in Monterrey, Mexico at the Chilidog Observatory. See more at his website, Astronomía Y Astrofotografía.
You can follow Universe Today senior editor Nancy Atkinson on Twitter: @Nancy_A. Follow Universe Today for the latest space and astronomy news on Twitter @universetoday and on Facebook.
The solar minimum occurs approximately every 11 years when fewer sunspots like these appear. Image credit: NASA/Goddard Space Flight Center
[/caption]
Since Galileo’s time, humans have been going essentially blind following sunspots. But, as our technology advanced, our blindness as to solar causes and effects was lifted. Thanks to Edward Maunder’s work in the late 1800s, we began to “see” a bit better as the 11-year sunspot cycle emerged. From earlier observation, the “Maunder Minimum” – a period roughly spanning 1645 to 1715 when sunspots were a rarity – was established and the hypothesis of the Little Ice Age came forward. But no proof exists that solar minimum affects much here on Earth… Or does it?
Modern technology has allowed us to study solar phenomena in ways our predecessors would never have imagined. In 2008, scientists were able to document the solar minimum as one of the most prolonged and weak since the advent of space-based instrumentation. But with our terrestrial blinders off, it didn’t take long to establish the lack of solar activity didn’t correspond with solar magnetism. Quite simply put, auroral activity didn’t decrease proportionately… until 8 months later. A paper in Annales Geophysicae that appeared on May 16, 2011 reports these effects on Earth did in fact reach a minimum – the lowest levels of the century. Solar wind speed along with the strength and direction of the magnetic field seems to have taken a dominant role.
“Historically, the solar minimum is defined by sunspot number,” says space weather scientist Bruce Tsurutani at NASA’s Jet Propulsion Laboratory in Pasadena, Calif., who is first author on the paper. “Based on that, 2008 was identified as the period of solar minimum. But the geomagnetic effects on Earth reached their minimum quite some time later, in 2009. So we decided to look at what caused the geomagnetic minimum.”
Geomagnetic effects are based on the Sun’s power to alter Earth’s magnetic fields. Measured with a magnetometer, these effects usually produce nothing more than auroral activity. But extreme examples could include power grid failures, satellite disruption and more. Understanding our space weather is important and three factors come to bear: the speed of the solar wind, the strength of the interplanetary magnetic field and which direction it is flowing. The team – which also included Walter Gonzalez and Ezequiel Echer of the Brazilian National Institute for Space Research in São José dos Campos, Brazil – examined each of these factors in sequence.
At the onset, the researchers agreed the interplanetary magnetic field was at a low in 2008 and 2009. This was obviously a factor to the geomagnetic minimum, but since effects didn’t decrease in 2008, it couldn’t be the sole reason. To study solar wind speed, the employed NASA’s Advanced Composition Explorer (ACE) and data revealed the speed of the solar wind stayed high during the sunspot minimum. It took a period of time to decay – one that matched the decline in geomagnetic effects. The next step was to determine the cause – and the smoking gun appeared to be coronal holes. Here is where solar wind can burst forth from the center at speeds of 500 miles per second, but slows down when coming from the sides and extends across space.
“Usually, at solar minimum, the coronal holes are at the sun’s poles,” says Giuliana de Toma, a solar scientist at the National Center for Atmospheric Research whose research on this topic helped provide insight for this paper. “Therefore, Earth receives wind from only the edges of these holes, and it’s not very fast. But in 2007 and 2008, the coronal holes were not confined to the poles as normal.”
Coincidental evidence? Not hardly. In 2008 the coronal holes remained at low solar latitudes with their winds pointed directly toward Earth. Not until 2009 did they move toward the Sun’s poles and geomagnetic effects and sightings of the aurora went proportionally along with it. It’s even been theorized coronal holes may be responsible for minimizing the southward direction of the interplanetary magnetic field as well. Such a combination of all factors are setting the stage for geomagnetic minimum, but study is still needed to help understand and predict such phenomena. To do so well, Tsurutani points out, requires focusing on the tight connection between such effects and the complex physics of the sun. “It’s important to understand all of these features better,” he says. “To understand what causes low interplanetary magnetic fields and what causes coronal holes in general. This is all part of the solar cycle. And all part of what causes effects on Earth.”
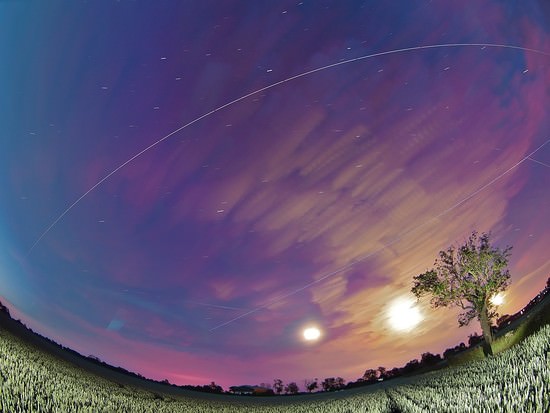
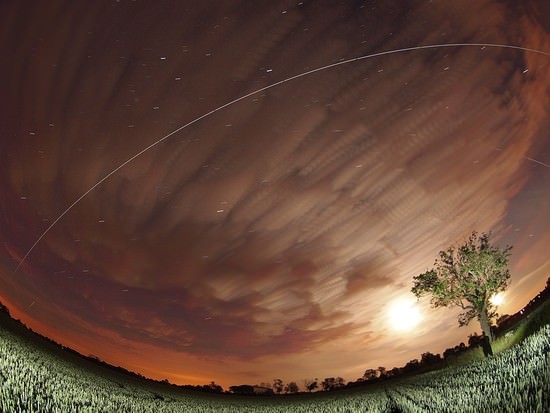
Four ISS passes over the UK last night. Credit: Mark Humpage
[/caption]
Last night in the UK, US and Europe, we were spoiled with multiple and bright ISS passes. Not just one or two, but up to six passes were able to be viewed throughout the evening in some locations.
This is quite rare as normally we get only one or maybe two visible passes in the evening or morning.
So why are we getting as many as four to six passes per night?
The ISS did receive an orbital boost and its altitude increased by around 20 kilometers. The orbital height of the ISS has an effect on how many visible passes there are at present in the Northern hemisphere. Another reason is because of the time of year.
We are only a week or so away from the Summer Solstice, the time of year when the Northern hemisphere receives the most hours of sunlight. Naturally this means we only have a few hours of darkness and the further North you go, the shorter the nights are and in some locations this time of year, it doesn’t ever get truly dark.
So why does this affect the ISS?
Basically the ISS visible passes have increased due to the station being illuminated much more by the Sun as there are more hours of sunlight right now, but the effect will wear off when we pass through Summer solstice and the nights get longer again.
Take advantage of this rare time and go outside and enjoy the ISS as much as you can in this series of visible passes.
Need to know how and when you can see the ISS? NASA has a Skywatch page where you can find your specific city to look for satellite sighting info.
Spaceweather.com, has a Satellite Tracker Tool. Just put in your zip code (good for the US and Canada) to find out what satellites will be flying over your house.
Heaven’s Above also has a city search, but also you can input your exact latitude and longitude for exact sighting information, helpful if you live out in the country.


 and are associated with the following solar cycle 11 years later. New jet streams associated with a future 2018-2020 solar maximum were expected to form by 2008 but are not present even now, indicating a delayed or missing Cycle 25. Credit: SWRI")

 24. Credit: SWRI")