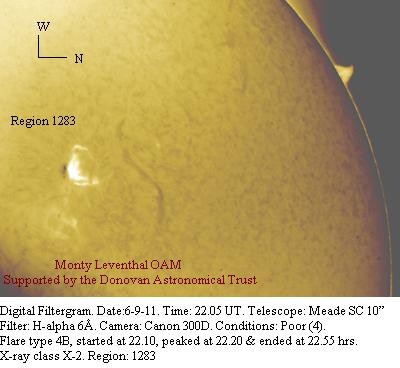
A digital filtergram shows a type 4B Flare with an X-ray class of X-2 in active region 1283 on Sept. 6, 2011. Credit: Monty Leventha
The Sun sent two flares yesterday from active region 1283. This video shows the second flare, at 6:12 p.m. EDT (2212 GMT) on Tuesday an even bigger flare than the M-class flare from early on Sept. 6, at about 0150 GMT. This was an X-class flare, major events that can trigger planet-wide radio blackouts and long-lasting radiation storms. The latest update says the CMEs could sail north of Earth, delivering a glancing blow to Earth’s magnetic field, and could arrive between September 8 -10. Spaceweather.com says high-latitude sky watchers should be alert for auroras in the nights ahead.
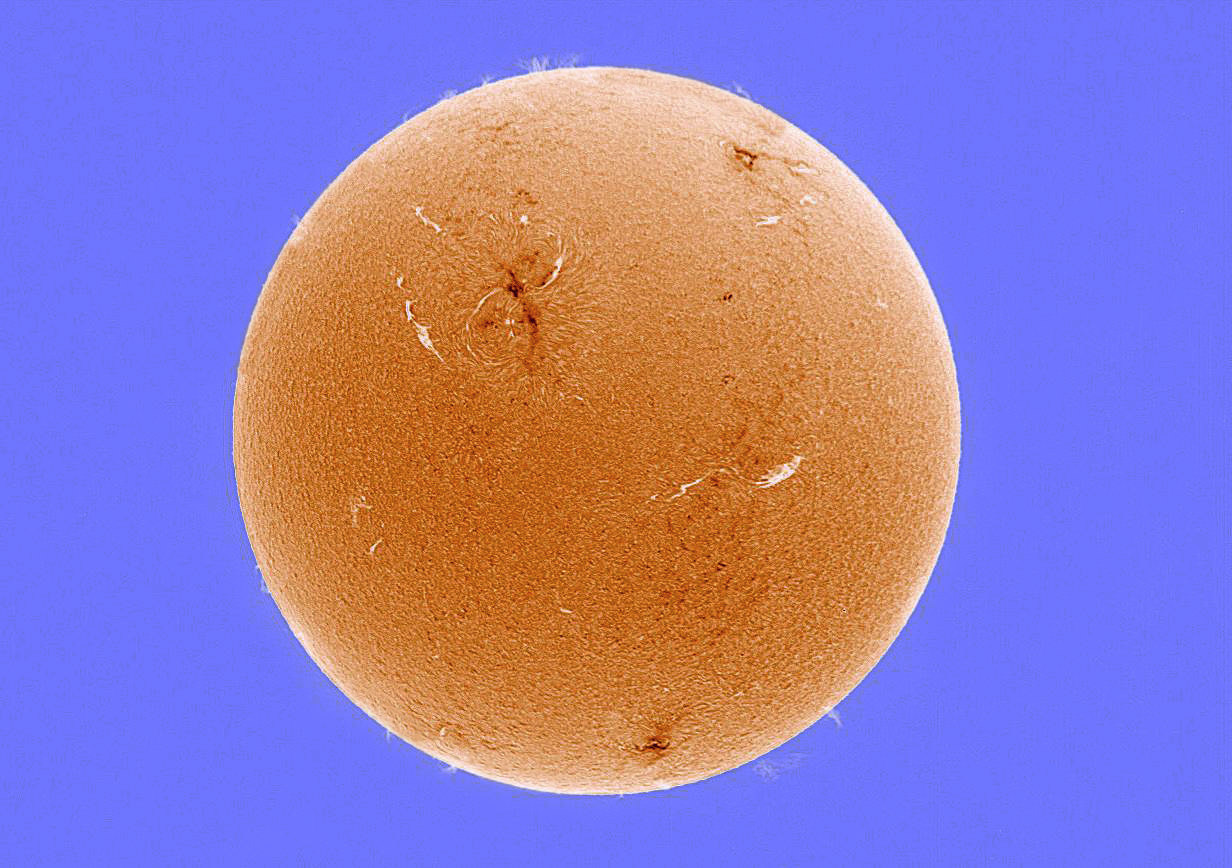
The image below was sent in to Universe Today by Monty Leventhal showing the type 4B Flare with an X-ray class of X-2 in active region 1283.
Stanford researchers have found a way to detect sunspots such as these two days before they reach the surface of the Sun. Image Credit: Thomas Hartlep
[/caption]
For solar enthusiasts, we’re all quite aware of sunspots and their implications. Able to disrupt power grids, shut down satellite communications and pose hazards to astronauts, these “cool” customers are revealing themselves ahead of their surface appearance. Thanks to the Michelson Doppler Imager aboard NASA’s Solar and Heliospheric Observatory satellite, known as SOHO, researchers were able to take 15 years of “sound” data from our nearest star… and develop a new technique for detecting sunspots before they emerge.
By combining information with NASA’s Solar Dynamics Observatory satellite, which carries the Helioseismic and Magnetic Imager, scientists have discovered a new method for detecting sunspots as deep as 65,000 kilometers below the solar surface. The areas of intense magnetic fields produce acoustic waves from the turbulence of plasma and gases. Near the surface, a convection cell echoes the information which travels back to the solar interior – only to be refracted again. By comparing their findings to seismic waves studied here on Earth, researchers measure the waves between points to predict anomalies.
Detection of Emerging Sunspot Regions – 18 August 2011: Movie showing the detected travel-time perturbations before the emergence of active region 10488 in the photosphere. The first 10 seconds of the movie show intensity observations of the Sun. The intensity later fades out and the photospheric magnetic field is shown. In the next 20 seconds, we zoom in to a region where a sunspot group would emerge. The upper layer shows magnetic field observations at the surface and the lower layer shows simultaneous travel-time perturbations, detected at a depth of about 60,000 km. After the emergence, intensity observations show the full development of this active region, until it rotates out of view on the west solar limb. (movie made by Thomas Hartlep) Courtesy of the Helioseismic and Magnetic Imager.
“We know enough about the structure of the Sun that we can predict the travel path and travel time of an acoustic wave as it propagates through the interior of the Sun,” said Junwei Zhao, a senior research scientist at Stanford’s Hansen Experimental Physics Lab. “Travel times get perturbed if there are magnetic fields located along the wave’s travel path.”
By comparing and measuring millions of pairs and points, researchers are able to pinpoint areas where sunspots are likely to happen. What they have discovered is larger spots rise to the surface faster than smaller ones… a prediction which can be made in approximately 24 hours. For less ominous appearances, lead times increase to up to two days.
“Researchers have suspected for a long time that sunspot regions are generated in the deep solar interior, but until now the emergence of these regions through the convection zone to the surface had gone undetected,” Ilonidis said. “We have now successfully detected them four times and tracked them moving upward at speeds between 1,000 and 2,000 kilometers per hour.”
The ultimate goal is to improve space weather forecasting. If events can be predicted three days prior, advance notice can be given and proper precautions taken.
Heliophysicists announced today that new data processing techniques have enabled them to track solar storms from their origin in the Sun’s fiery corona all the way to impact with the Earth in unprecedented detail. “For the first time we’ve been able to image a coronal mass ejection all the way through its entire life cycle, from inside the solar corona until it reaches Earth,” said Craig DeForest, speaking at a NASA press briefing. DeForest is the lead author paper published in the Astrophysical Journal. Continue reading “Enhanced Technique for Tracking Solar Storms All the Way From Sun to Earth”
X-Class, M-Class, C-Class… What does it all that mean, and just what is a solar flare? This video from the Solar Dynamics Observatory tells all about solar flares and how they might affect us here on Earth. Find out why NASA and NOAA are constantly monitoring the Sun for activity that could create long lasting radiation storms which can harm satellites, communications systems, and even ground-based technologies and power grids.
Early Tuesday morning (August 9, 2011,) the Sun erupted with the largest solar flare of Cycle 24, registering as an X7-class flare. This flare had an X-ray magnitude of X6.9, meaning it was more than 3 times larger than the previous largest flare of this solar cycle – the X2.2 that occurred on Feb 15, 2011, NASA said. The source was Sunspot 1263 which is nearing the western limb of the Sun, and because of its location, scientists do not anticipate that this explosion will hit Earth directly. Therefore, the impact on communications and electric grids will likely (and luckily) be minimal. Continue reading “Sun Erupts with Largest Solar Flare of the Cycle”
With the recent activity on the Sun, we’ve used the words “massive” or “huge” to describe solar flares. But just how big are they, really? This great video explains and illustrates the actual size of solar flares.
Thanks to Scott Stevenson for creating and sending us the video. Scott notes that text subtitles are available if you click on the “CC” button on the bottom of the video screen, making this informative video accessible to a wider audience.
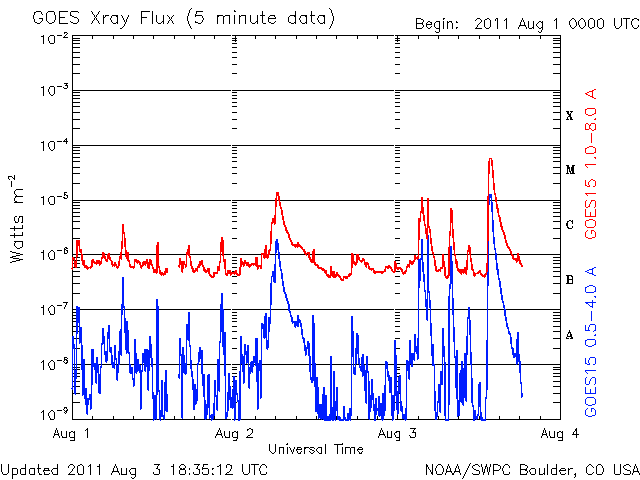
This plot shows 3-days of 5-minute solar x-ray flux values measured on the SWPC primary GOES satellite. Credit: NOAA/SWPC
Early today, (Aug 3, 2011) two active regions on the Sun, sunspot 1261 and 1263 unleashed solar flares, which was captured by NASA’s Solar Dynamics Observatory. The above video shows an M6 class flare from 1261 in a couple of different wavelengths. SolarstormWatch, a citizen science project through the Royal Observatory in Greenwich, England predicts the solar storm from the larger flare to reach Earth at 15:00 UTC on August 5, 2011, and also predict direct hit on Earth.
See below for a graph of the activity:
[/caption]
Solar storms are a concern if they hit Earth directly since under the right conditions, they can create extra electrical currents in Earth’s magnetosphere. The electrical power grid is vulnerable to any extra currents, which can infiltrate high-voltage transmission lines, causing transformers to overheat and possibly burn out.
Check SpaceWeather.com and the National Weather Service’s Space Weather Prediction Center for more information.
Active regions on the Sun on August 1, 2011. Credit: César Cantú, Chilidog Observatory.
[/caption]
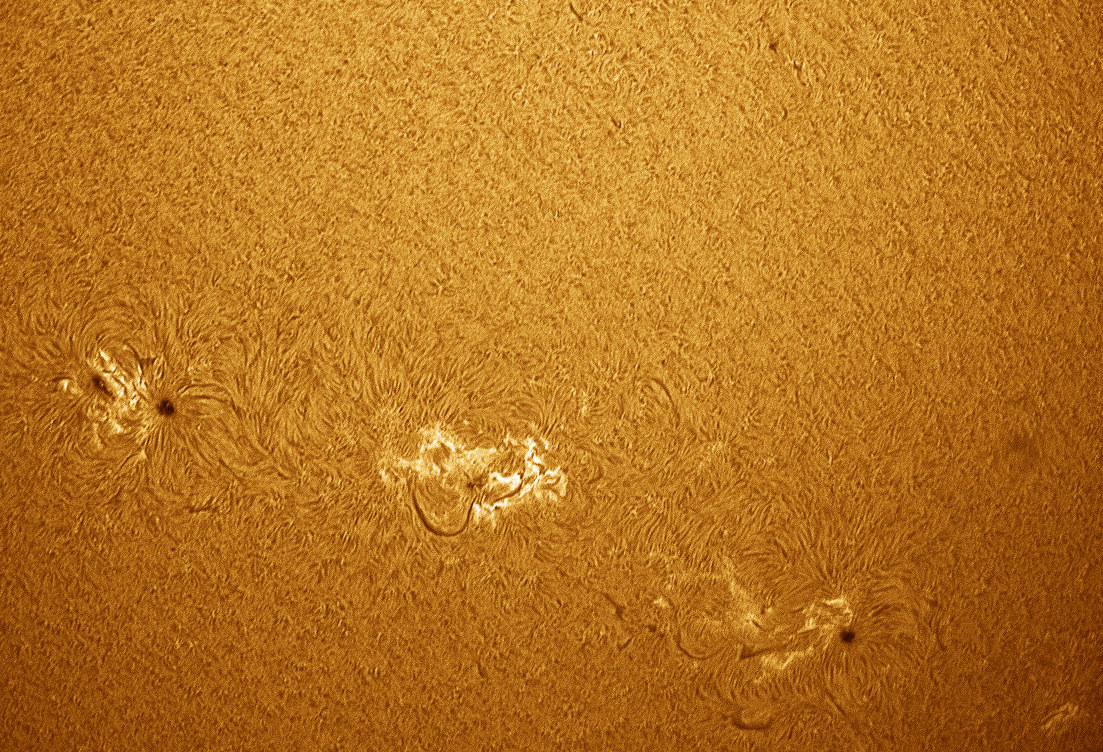
The summer Sun (for us in the northern hemisphere) is getting active! Here are images and videos of recent activity, which include sunspots and an M-class flare. Above is a close-up look at four active regions taken by César Cantú from the Chilidog Observatory in Monterrey, Mexico.
Below, see a strong but brief M9-class solar flare which occurred on July 31, 2011 from Active Region 1261, captured by the Solar Dynamics Observatory. Scientists from SDO say that because it was brief it appears not to have hurled a large coronal mass ejection (CME) outwards.
The Sun in four different wavelengths. Credit: César Cantú from the Chilidog Observatory. Click for larger version.
Here’s a comparative look at the sunspots from August 1, 2011, taken by César Cantú from the Chilidog Observatory in Mexico. “Taking advantage of the program that I could attach Lucam Recorder in AVI (video) different bands of light, here is this comparative look in negative, white light, the calcium band and hydrogen-alpha band,” said Cantú. He used a 90 Coronado telescope and camera with dual ektalon DMK41.
Here’s a video clip from SDO showing an interesting alignment of three good-sized sunspot groups that appear to be marching across the Sun, taken July 28-29, 2011.
See more, and keep up with all the activity on the Sun at the SDO website.
We all know about the Man in the Moon, but the Solar Dynamics Observatory spacecraft has now detected an old man in the Sun, too. He was there, at least back on Dec. 9, 2010 when these images were taken, but has since disappeared. In different wavelengths, at times he appears happy, mischievous or even downright angry.
The movie underscores the fact that images taken at different wavelengths do reveal different features. The different wavelengths are shown in order from the lowest temperature material being imaged to the highest. The images also start at the Sun’s surface and gradually move out to the Sun’s upper corona.
A negative, or color reversed image of the Sun. Credit: Cesar Cantu from Monterrey, Mexico, and the Chilidog Observatory. Click for high resolution version.
[/caption]
Here’s an unusual if not stunning way to look at the Sun: César Cantu from the Chilidog Observatory in Mexico has taken a few images of the Sun, and reversed the colors, or made a negative. This increases the contrast and allows structures to be seen — or at least stand out — that otherwise are not visible.
“The picture is made under normal procedure,” César tells us. He creates an Avi file, then reverses the colors, and also applies false color, leaving the sky to look blue and the Sun to yellow-orange and the chromosphere as red. “This is to delight the author!” César says.
The solar prominences, in all sorts of shapes and sizes, really stand out.
Below, you can see a comparison of “normal” image which has then been “negativised.”
A comparison between a regular and 'negative' image of the Sun. Cesar Cantu from Monterrey, Mexico, and the Chilidog Observatory. Click for high resolution version