Venus and Mercury Blasted by Recent Solar Storms

A plot of the STEREO data from August 14, 2010, showing the location of the planets and the direction of a CME from the Sun.

Update: Well, it turns out that while it looks like Venus and Mercury are getting pummeled by Coronal Mass Ejections, the geometry might not work out, at least not for every day that is included in the video above. UT reader Steven Janowiecki brought it to my attention that just because Mercury and Venus look close to the Sun doesn’t mean they’re actually in the line of fire, as they could be well behind or in front of the solar storm. I checked with STEREO project scientist Dr. Joseph Gurman, who took a look at the data. He put together a plot for August 14, (see below) and said, “It shows that Mercury and Venus are well to the East (left) of the Sun-earth line. The large CME on the 14th originated from an active region near the west limb of the Sun, and since most CME’s are about 60 degrees of heliolongitude in width on average, it’s unlikely that that event actually passed by Mercury or Venus.” There was one large event, however, on August 7, that appeared likely to be headed in the direction of Mercury and Venus.

[/caption]

So, as it happens sometimes in astronomy, things are not always as they appear, and this exemplifies the challenges of estimating distance in astronomy.

The STEREO website has a very nifty tool where you can see the location of the spacecraft on any date, as well as where the planets are in their orbits. And there is another tool where you can see and download images from a particular day and time and even put together movies of a specific time period showing STEREO data.

Here’s the rest of the article as it ran originally:

Take a look at these Coronal Mass Ejections (CME) from the first part of August 2010, as seen by the two STEREO spacecraft. Here on Earth, we’ve had some aurorae, a result of the recent solar activity. But this STEREO imagery shows Venus and Mercury were blasted by these CMEs.

STEREO consists of two spacecraft – one ahead of Earth in its orbit, the other trailing behind. With this new pair of viewpoints, scientists are able to see the structure and evolution of solar storms as they blast from the Sun and move out through space.

These movies were taken by SECCHI, a suite of remote sensing instruments on both spacecraft consisting of two white light coronagraphs that make up the Sun Centered Imaging Package (SCIP), as well as a Heliospheric Imager (HI).

SECCHI can follow three-dimensional Coronal Mass Ejections (CMEs) from the Sun’s surface, through the corona and interplanetary medium, to impact at Earth. With these instruments, scientists are getting breakthroughs in understanding the origin and consequences of CMEs, in determining their three-dimensional structure, and more, and perhaps be able to predict space weather. Combining STEREO with the new Solar Dynamics Observatory, we’ll be learning more and more about the Sun in the next few years.

As an example of SDO’s capabilities, here’s an SDO image from earlier today showing the Sun’s limb.

View of the Sun from August 18, 2010 from the Solar Dynamics Observatory. Credit: NASA/SDO

Credit: NASA STEREO/NRL

The Sun is Waking Up: 5 Sunspots Today

Five sunspots appeared on the Sun on August 11, 2010. Image from SolarCycle24.com

Here’s something we’ve not seen in a long while: five sunspots on the Sun at once. Is the Sun finally waking up from its unusually long and deep solar minimum slumber? While activity on the Sun usually ebbs and flows on a fairly predictable 11-year cycle, this current cycle has been anything but conventional. In 2009, there were 260 days (71% of the time) that the Sun was ‘spotless,’ but now in 2010 so far, the Sun has had spots been spotless for only 35 days. With the last solar maximum occurring in 2001, maybe the Sun is just now ramping up to the next maximum, which is set for 2013. Recent solar flares on August 1 and 7, and now these sunspots may be signaling that the Sun is “throwing off the covers” and starting to wake up.

This marvelous image from the Solar Dynamics Observatory shows that at about 8:55 UTC on August 1, a measurable solar flare triggered an event known as a coronal mass ejection (CME). This is where the “atmosphere” of the Sun sends out a burst of energized plasma. In this case, nearly the entire Earth-facing side of the Sun was involved.

The High Energy Astrophysics Picture of the week Page used that great “covers” analogy:

The Sun, after a long sleep, is finally waking up. And like any irascible sleeper vigorously throwing off the covers. In this case the covers are composed of high-energy electrons and protons being shot out into space at a tremendous rate. The image above, obtained by the Solar Dynamics Observatory on August 1, shows almost the entire earth-facing side of the sun erupting at once. In this extreme ultraviolet image you can see evidence of extremely ultraviolent activity: a C3-class solar flare (white area on upper left), a solar tsunami (upper right), multiple filaments of magnetism lifting off the stellar surface, large-scale shaking of the solar corona, and a coronal mass ejection. The coronal mass ejection, or CME, showered the earth with charged particles, producing spectacular aurora (northern lights) as far south as Iowa and Telemark, Norway.

And another CME on August 7 has not yet triggered a major geomagnetic storm, but high latitude sky watchers should take a look tonight, just in case.

Sources: High Energy Astrophysics Picture of the Week, SolarCycle24.com, SpaceWeather.com

Solar Storm Update: Best Times for Viewing Aurorae

Why is the Sun So Hot?
Image from the Solar Dynamics Observatory of the filaments coming from the Sun's surface. Credit: NASA

[/caption]

The Harvard Smithsonian Center for Astrophysics released the latest information on the July 31/August 1 activity on the Sun that is just now reaching Earth. They predict we’ll have multiple opportunities for a display of the Northern Lights over the next two days. The latest word from the solar scientists is that the Sun erupted not just once, but four times. All four coronal mass ejections are headed toward Earth.

Space weather forecasts are even more challenging than regular weather forecasts, said Dr. Leon Golub, and a coronal mass ejection is like a hurricane: it’s large and fuzzy, and doesn’t always move at the same speed. Currently, the estimated arrival times are:

Wednesday, Aug. 4 – 3:00 a.m. EDT (0700 GMT on Aug. 5; aurorae not visible in daylight)
Wednesday, Aug. 4 – 1:00 p.m. EDT (1600 GMT, again the daylight issue)
Wednesday, Aug. 4 – 8:00 p.m. EDT (0000 GMT on Aug. 5)
Thursday, Aug. 5 – 2:00 a.m. EDT (0600 GMT)

Any one of these events may or may not generate an aurora. It depends on details like magnetic field orientation. If the magnetic field in the oncoming solar plasma is directed opposite Earth’s magnetic field, the result could be spectacular aurorae. If the fields line up, the coronal mass ejection could slide past our planet with nary a ripple.

The Center for Astrophysics suggested these two resources:

Map of current auroral activity

Chart of proton flux (watch for the numbers to go up as each wave arrives)

Source: Harvard Smithsonian Center for Astrophyics

Are You Keeping an Eye on SDO Keeping an Eye on the Sun?

Have you been checking out the Solar Dynamics Observatory website and seeing all the amazing, high resolution images of our closest star? If not, you should. Above is a great new video of SDO’s capabilities and latest images. If you want to see what the Sun looks like right now, go to SDO’s homepage. And here’s a link to the SDO image browser where you can see the different images in different wavelengths from the AIA (Atmospheric Imaging Assembly) and HMI (Helioseismic and Magnetic Imager). If you choose the date range option, you can see a “movie” of the Sun’s activity. For example, check out the enormous coronal hole in the northern hemisphere seen last week in AIA 193 (date range 6/28 to 7/3), allow all the images to download and then press “Play.” Completely awesome. The SDO website should be part of your daily internet routine!

SDO Seeing ‘Butterfly Effect’ on the Sun

A new view of the sun from the Solar Dynamics Observatory. Credit: NASA

[/caption]
Already, the Solar Dynamics Observatory, or SDO, has taken over 5 million images, and the firehose of data and spectacular images is allowing solar scientists to begin understanding the dynamic nature of solar storms. With SDO, scientists are seeing that even minor solar events can have large effects across the Sun. “In essence, we are watching the butterfly effect in action on the Sun,” said Dean Pesnell, SDO project scientist.

The Atmospheric Imaging Assembly (AIA), one of three instruments aboard SDO, records high-resolution full-disk images of the Sun’s corona and chromosphere in more channels and at a higher rate than ever before. “This will allow us to zoom in on small regions and see far more detail in time and space, and zoom in on any part we want,” said Pesnell. “By looking at entire Sun we can see how one part of the Sun affects another. You can then zoom in to measure the changes in great detail.”

Large eruptive prominence on the sun's edge, as seen by SDO. Credit: NASA

Shortly after AIA opened its doors on March 30, scientists observed a large eruptive prominence on the sun’s edge, followed by a filament eruption a third of the way across the star’s disk from the eruption.

“Even small events restructure large regions of the solar surface,” said Alan Title, AIA principal investigator at Lockheed Martin Advanced Technology Center. “It’s been possible to recognize the size of these regions because of the combination of spatial, temporal and area coverage provided by AIA.”

At the 216th American Astronomical Society meeting this week, Title said that some of the initial data from SDO is providing maps of magnetic fields and movies that are giving scientists some confidence in trying to decipher the cause and effect of solar storms

AIA observed a number of very small flares that have generated magnetic instabilities and waves with clearly-observed effects over a substantial fraction of the solar surface. The instrument is capturing full-disk images in eight different temperature bands that span 10,000 to 36-million degrees Fahrenheit. This allows scientists to observe entire events that are very difficult to discern by looking in a single temperature band, at a slower rate, or over a more limited field of view.

Solar storms produce disturbances in electromagnetic fields that can induce large currents in wires, disrupting power lines and causing widespread blackouts here on Earth. The storms can interfere with global positioning systems, cable television, and communications between ground controllers and satellites and airplane pilots flying near Earth’s poles. Radio noise from solar storms also can disrupt cell phone service.

To help scientists and the public to understand and have access to the large amount of data being returned by SDO, the science team has built some tools to help communicate the data.

New websites will help researchers find data sets relative to their topics of interest and provide an overview to the casual observer.

“SDO generates as much data in a single day as the TRACE mission produced in five years,” said Neal Hurlburt from SDO mission, from Lockheed Martin. “We want to share it with the public, but we want to do it in an effective way, so we developed the Heliophysics Events Knowledgebase (HEK) and the Sun Today Website.”

The Sun Today website displays the current state of events on the sun. These can guide researchers and others to more detailed descriptions and access to associated SDO data.

HEK includes the Event and Coverage Registries (HER, HCR), Inspection & Analysis Tools, Event Identification System and Movie Processing. Event services enable web clients to interact with the HEK.

There is also a tutorial on how to work with the data, and extract images and movies from the SDO data.

More info: SDO website.

New Weekly Sun Fix: SDO’s Pick of the Week

View of action on the Sun during this past week. Credit: NASA/SDO team

[/caption]

Images and data are starting to roll in from the Solar Dynamics Observatory, and the images are nothing short of stunning. So, the SDO website has started a couple of new image gallery features, which will provide a “best of” weekly fix without overloading your Sun senses (and no sunscreen needed!) The first one is Pick of the Week. The image above is the first “pick” and what a pick it is! This SDO close-up shows a filament and active region on the Sun, taken in extreme UV light on May 18, 2010. It shows a dark and elongated filament hovering above the Sun’s surface, with bright regions beneath it. The filaments are cooler clouds of gas that are suspended by tenuous magnetic fields that are often unstable and commonly erupt. This one is estimated to be at least 60 Earth diameters long (about 805,000 km, or 500,000 miles). Wowza!

Click here to see a super-huge full disk image.

See below for another new SDO feature, Hot Shots.

Solar flare on May 17, 2010, as seen by the AIA instrument on SDO. Credit: NASA

Hot Shots will feature some great looking flares. This image from the Atmospheric Imaging Assembly (AIA) instrument shows a solar eruption and a flare. The dark regions show the site of evacuated material from the eruption, and the large magnetic loops were formed during the flare. AIA takes images of the solar atmosphere in multiple wavelengths to study link changes in the surface and how they related to interior changes in the Sun. AIA takes images of the Sun in 10 wavelengths every 10 seconds.

For more see the SDO website.

Incredible Image: Atlantis and ISS Transit the Sun

Atlantis and the ISS transit the Sun. Credit: Thierry Legault www.astrophoto.fr

Here are some incredible images of Atlantis and the International Space Station captured as it transit the Sun.

You can also view space from where you are. You just need a good telescope for that. Take a look at these cool and amazing telescopes from Amazon.com.

French astrophotographer Thierry Legault has done it again. He captured a view of space shuttle Atlantis and the International Space Station crossing the face of the Sun on May 16, 2010 about 50 minutes before the shuttle docked with the space station. Legault took the image from Madrid, Spain at 13:28:55 UT. “Atlantis has just begun the ‘R-bar pitch maneuver,'” Legault wrote on his website, “as the shuttle performs a backflip that exposes its heat-shield to the crew of the ISS that makes photographs of it; since its approach trajectory is between the ISS and the Earth, this means that we are seeing Atlantis essentially from above, with the payload bay door opened.”

Since this may be Atlantis’ last flight to space, the image is especially poignant.

See below for the full image, and make sure you go to Legault’s website and watch the movie of how quickly the pair of spacecraft actually flew across the face of the Sun — like the blink of an eye! It’s amazing he was able to capture this incredible image at all, not to mention how clear and sharp the two spacecraft are in the photo, against the face of the otherwise spotless Sun. The shuttle’s tail is even visible!

Legault said he used a Takahashi TOA-150 refractor (diameter 150mm, final focal 2500mm), Baader Herschel prism and Canon 5D Mark II camera, at an exposure of 1/8000s at 100 ISO, extracted from a series of 16 images (4 images/s) started 2 seconds before the predicted transit time.

Full image of the Sun, with transiting shuttle and ISS. Credit: Thierry Legault www.astrophoto.fr

Take time to browse through Legault’s impressive collection of spacecraft photography, including an amazing 3-D movie of the ISS.

Our Sun Gets Active!

This SOHO image shows a huge CME on 4/13/2010. Credit: NASA/ESA/SOHO

[/caption]

The Sun erupted with one of the biggest prominences in years. This shot from the SOHO spacecraft on April 13, 2010 at 13:13 UT shows a Coronal Mass Ejection from the Sun’s northeastern limb. The massive plasma-filled structure rose up and burst during a ~2 hour period around 0900 UT. Emily Lakdawalla at the Planetary Society blog pointed out that you can watch a movie of the event by going to the “SOHO movie theater” . Just select “LASCO C2” from the “Image Type” menu, then click “Search.” As Emily explained, the movie viewer will automatically grab all the LASCO C2 images from the previous 24 hours and animate them for you. So, if you want to watch the eruption from April 13, and it is a few days later, just put in “2010-04-13” as the start date.

Images of the eruption can also be found at SpaceWeather.com, and Richard Bailey at the Society for Popular Astronomy captured this shot of a detached prominence from the eruption, taken at 9:56 UT.

And there’s more!

The SOHO folks put together a “Pick of the Week” movie from the past week of solar activity, and the STEREO spacecraft captured a nice profile view of spiraling corona loops above an active region after it had just popped off a coronal mass ejection (CME) on April 3, 2010. According to the SOHO website, “Faint clouds of material from the CME can be seen billowing into space at more than a million miles per hour. Right afterwards, magnetic forces trying to reorganize themselves generate a series of white arcs visible in extreme UV light. We are observing not the magnetic fields themselves, but electrically charged atoms spiraling along the field lines. The video clip covers one day of activity.”

So hot its cool!

Solar Wind Flows From Magnetic Funnels on the Sun

A Chinese-German team of scientists have identified the magnetic structures in the solar corona where the fast solar wind originates. Using images and Doppler maps from the Solar Ultraviolet Measurements of Emitted Radiation (SUMER) spectrometer and magnetograms delivered by the Michelson Doppler Imager (MDI) on the space-based Solar and Heliospheric Observatory (SOHO) of ESA and NASA, they observed solar wind flowing from funnel-shaped magnetic fields which are anchored in the lanes of the magnetic network near the surface of the Sun. These observations are presented in the April 22 issue of Science magazine. The research leads to a better understanding of the magnetic nature of the sources of the solar wind, a stream of tenuous and hot plasma (electrically conductive gas) that affects the Earth’s space environment.

The solar wind consists of protons, alpha particles (two-fold ionized helium), heavy ions and electrons flowing from the surface of the Sun with speeds ranging from 300 to 800 km/s. The heavy ions in the coronal source regions emit radiation at certain ultraviolet wavelengths. When they flow towards Earth, as they do when tracing the nascent solar wind, the wavelengths of the ultraviolet emission become shorter, a phenomenon called the Doppler effect, which is well known in its acoustic variant, for example, from the change in tone of the horn of a police car while approaching to or receding from the listener. In the solar case, plasma motion towards us, which means away from the solar surface, is detected as blue shift in the ultraviolet spectrum, and thus can be used to identify the beginning of the solar wind outflow.

A SUMER ultraviolet spectrum is similar to what is seen when a prism separates white light into a rainbow of distinct colors. The ultraviolet radiation is however invisible to the human eye and cannot penetrate the Earth’s atmosphere. By analyzing ultraviolet emission obtained by SUMER on the space observatory SOHO from space, solar physicists can learn a great deal about the Sun and infer the gas temperature, chemical composition, and motion in the various atmospheric layers.

“The fine magnetic structure of the source region of solar wind has remained elusive” said first author Prof. Chuanyi Tu, from the Department of Geophysics of the Peking University in Beijing, China. “For many years, solar and space physicists have observed fast solar wind streams coming from coronal regions with open magnetic field lines and low light intensity, the so called coronal holes. However, only by combining complex observations from SOHO in a novel way have we been able to infer the properties of the sources inside coronal holes. The fast solar wind seems to originate in coronal funnels with a speed of about 10 km/s at a height of 20,000 kilometers above the photosphere”.

“The fast solar wind starts to flow out from the top of funnels in coronal holes with a flow speed of about 10 km/s”, states Prof. Tu. “This outflow is seen as large patches in Doppler blue shift (hatched areas in the above figure) of a spectral line emitted by Ne+7 ions at a temperature of 600,000 Kelvin, which can be used as a good tracer for the hot plasma flow. Through a comparison with the magnetic field, as extrapolated from the photosphere by means of the MDI magnetic data, we found that the blue-shift pattern of this line correlates best with the open field structures at 20,000 km.”

The SUMER spectrometer scrutinized the sources of the solar wind by observing ultraviolet radiation coming from a large area of the northern polar region of the Sun. “The clear identification of the detailed magnetic structure of the source, now being revealed as coronal funnels, and the determination of the release height and initial speed of the solar wind are important steps in solving the problems of mass supply and basic acceleration. We can now focus our attention on studying further plasma conditions and physical processes that occur in the expanding coronal funnels and in their narrow necks anchored in the magnetic network”, says Prof. Eckart Marsch, co-author of the Science paper.

Solving the nature and origin of the solar wind is one of the main goals for which SOHO was designed. It has long been known to the astronomical community that the fast solar wind comes from coronal holes. What is new here is the discovery that these flows start in coronal funnels, which have their source located at the edges of the magnetic network. Just below the surface of the Sun there are large convection cells. Each cell has magnetic fields associated with it, which are concentrated in the network lanes by magneto-convection, where the funnel necks are anchored. The plasma, while still being confined in small loops, is brought by convection to the funnels and then released there, like a bucket of water is emptied into an open water channel.

“Previously it was believed that the fast solar wind originates on any given open field line in the ionization layer of the hydrogen atom slightly above the photosphere”, says Prof. Marsch, “However, the low Doppler shift of an emission line from carbon ions shows that bulk outflow has not yet occurred at a height of 5,000 km. The solar wind plasma is now considered to be supplied by plasma stemming from the many small magnetic loops, with only a few thousand kilometers in height, crowding the funnel. Through magnetic reconnection plasma is fed from all sides to the funnel, where it may be accelerated and finally form the solar wind.”

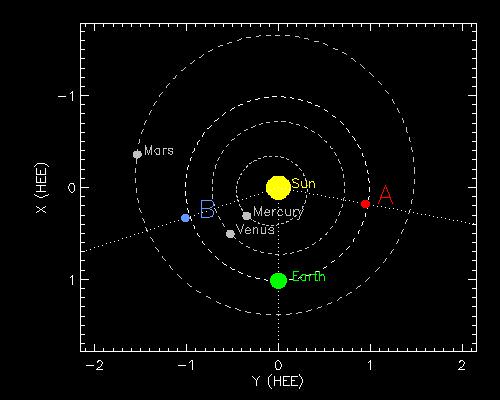
The SUMER instrument was built under the leadership of Dr. Klaus Wilhelm, who is also a co-author of the paper, at the Max Planck Institute for Solar System Research (formerly Max Planck Institute for Aeronomy) in Lindau, Germany, with key contributions from the Institut d’Astrophysique Spatiale in Orsay, France, the NASA Goddard Space Flight Center in Greenbelt, Maryland,the University of California in Berkeley, and with financial support from German, French, USA and Swiss national agencies. SOHO has been operating for almost ten years at a special vantage point in space 1.5 milion kilometers from the Earth, on the sunward side of the Earth. SOHO is a project of international collaboration between the European Space Agency and NASA. It was launched on an Atlas II-AS rocket from NASA’s Kennedy Space Center, Florida, in December 1995 and is operated from the Goddard Space Flight Center.

Original Source: Max Planck Society News Release

Most Active Sun in 8,000 Years

The activity of the Sun over the last 11,400 years, i.e., back to the end of the last ice age on Earth, has now for the first time been reconstructed quantitatively by an international group of researchers led by Sami K. Solanki from the Max Planck Institute for Solar System Research (Katlenburg-Lindau, Germany). The scientists have analyzed the radioactive isotopes in trees that lived thousands of years ago. As the scientists from Germany, Finland, and Switzerland report in the current issue of the science journal “Nature” from October 28, one needs to go back over 8,000 years in order to find a time when the Sun was, on average, as active as in the last 60 years. Based on a statistical study of earlier periods of increased solar activity, the researchers predict that the current level of high solar activity will probably continue only for a few more decades.

The research team had already in 2003 found evidence that the Sun is more active now than in the previous 1000 years. A new data set has allowed them to extend the length of the studied period of time to 11,400 years, so that the whole length of time since the last ice age could be covered. This study showed that the current episode of high solar activity since about the year 1940 is unique within the last 8000 years. This means that the Sun has produced more sunspots, but also more flares and eruptions, which eject huge gas clouds into space, than in the past. The origin and energy source of all these phenomena is the Sun’s magnetic field.

Since the invention of the telescope in the early 17th century, astronomers have observed sunspots on a regular basis. These are regions on the solar surface where the energy supply from the solar interior is reduced owing to the strong magnetic fields that they harbour. As a consequence, sunspots are cooler by about 1,500 degrees and appear dark in comparison to their non-magnetic surroundings at an average temperature of 5,800 degrees. The number of sunspots visible on the solar surface varies with the 11-year activity cycle of the Sun, which is modulated by long-term variations. For example, there were almost no sunspots seen during the second half of the 17th century.

For many studies concerning the origin of the active sun and its potential effect on long-term variations of Earth’s climate, the interval of time since the year 1610, for which systematic records of sunspots exist, is much too short. For earlier times the level of solar activity must be derived from other data. Such information is stored on Earth in the form of “cosmogenic” isotopes. These are radioactive nuclei resulting from collisions of energetic cosmic ray particles with air molecules in the upper atmosphere. One of these isotopes is C-14, radioactive carbon with a half life of 5730 years, which is well known from the C-14 method to determine the age of wooden objects. The amount of C-14 produced depends strongly on the number of cosmic ray particles that reach the atmosphere. This number, in turn, varies with the level of solar activity: during times of high activity, the solar magnetic field provides an effective shield against these energetic particles, while the intensity of the cosmic rays increases when the activity is low. Therefore, higher solar activity leads to a lower production rate of C-14, and vice versa.

By mixing processes in the atmosphere, the C-14 produced by cosmic rays reaches the biosphere and part of it is incorporated in the biomass of trees. Some tree trunks can be recovered from below the ground thousands of years after their death and the content of C-14 stored in their tree rings can be measured. The year in which the C-14 had been incorporated is determined by comparing different trees with overlapping life spans. In this way, one can measure the production rate of C-14 backward in time over 11,400 years, right to the end of the last ice age. The research group have used these data to calculate the variation of the number of sunspots over these 11,400 years. The number of sunspots is a good measure also for the strength of the various other phenomena of solar activity.

The method of reconstructing solar activity in the past, which describes each link in the complex chain connecting the isotope abundances with the sunspot number with consistent quantitative physical models, has been tested and gauged by comparing the historical record of directly measured sunspot numbers with earlier shorter reconstructions on the basis of the cosmogenic isotope Be-10 in the polar ice shields. The models concern the production of the isotopes by cosmic rays, the modulation of the cosmic ray flux by the interplanetary magnetic field (the open solar magnetic flux), as well as the relation between the large-scale solar magnetic field and the sunspot number. In this way, for the first time a quantitatively reliable reconstruction of the sunspot number for the whole time since the end of the last ice age could be obtained.

Because the brightness of the Sun varies slightly with solar activity, the new reconstruction indicates also that the Sun shines somewhat brighter today than in the 8,000 years before. Whether this effect could have provided a significant contribution to the global warming of the Earth during the last century is an open question. The researchers around Sami K. Solanki stress the fact that solar activity has remained on a roughly constant (high) level since about 1980 – apart from the variations due to the 11-year cycle – while the global temperature has experienced a strong further increase during that time. On the other hand, the rather similar trends of solar activity and terrestrial temperature during the last centuries (with the notable exception of the last 20 years) indicates that the relation between the Sun and climate remains a challenge for further research.

Original Source: Max Planck Society News Release