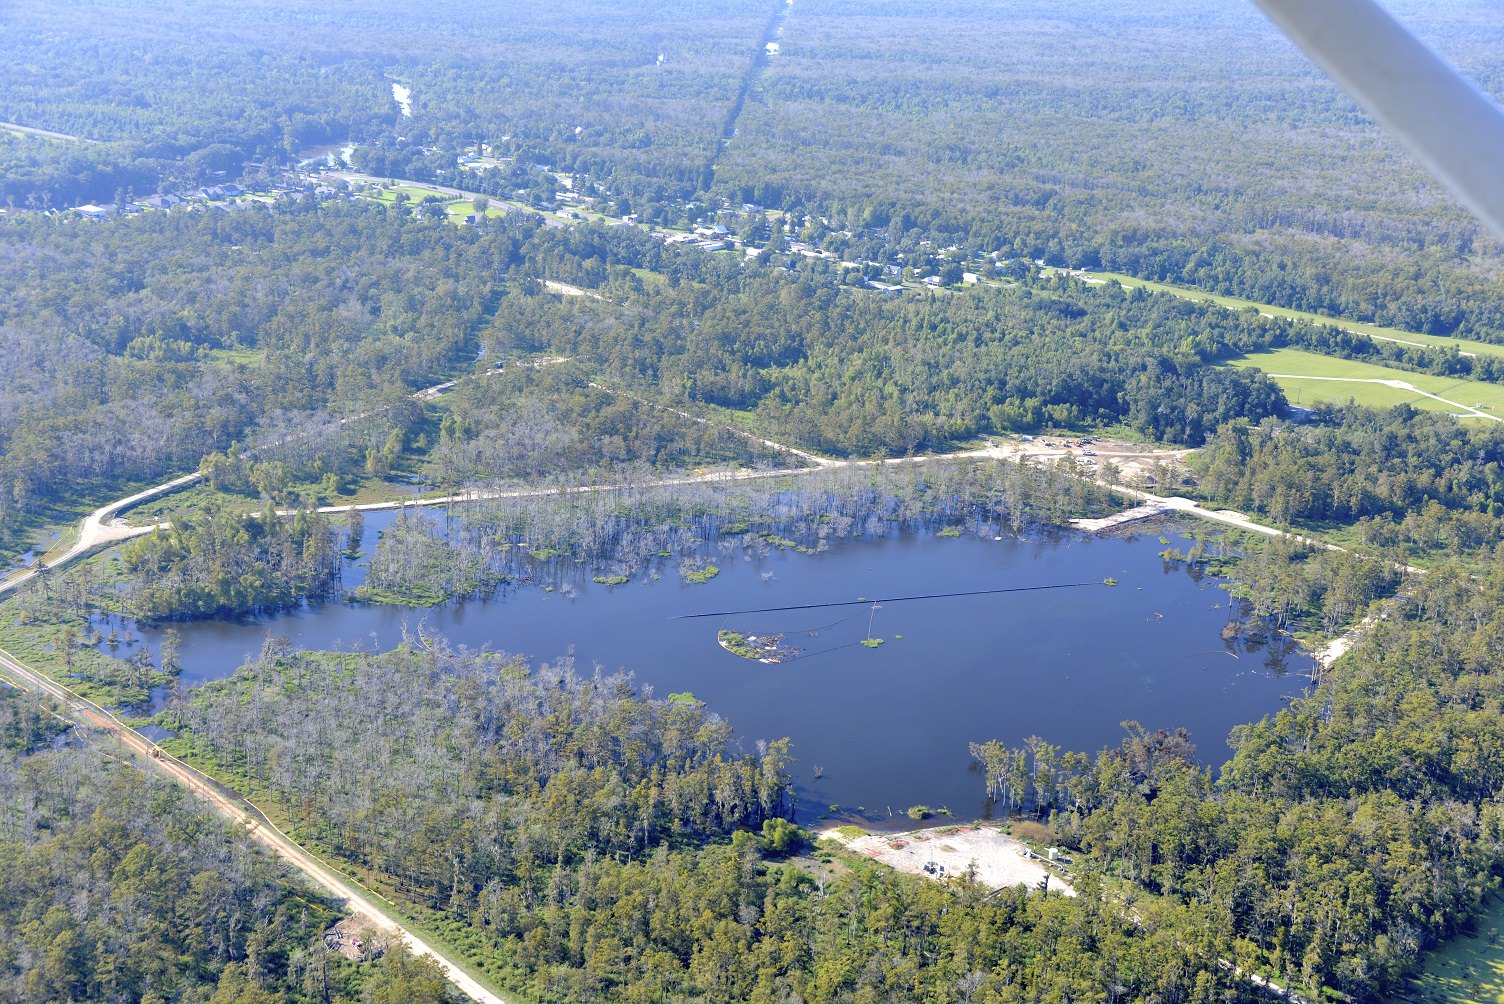
A 25-acre sinkhole near Bayou Corne, Louisiana that formed in Aug. 2012. In 2014, a new analysis of NASA radar data found that the sinkhole was evident in that information before its collapse. Credit: On Wings of Care, New Orleans, La.
A Louisiana sinkhole the size of 19 American football fields shifted sideways in radar measurements before its collapse and resulting evacuations in 2012, a study reveals.
The implication is that if certain types of radar measurements are collected regularly from above, it is possible to see some sinkholes before they collapse. The researchers added, however, that their discovery was “serendipitous” and there are no plans to immediately use a NASA robotic Gulfstream plane used for the study to fly over spots that could be vulnerable to sinkholes.
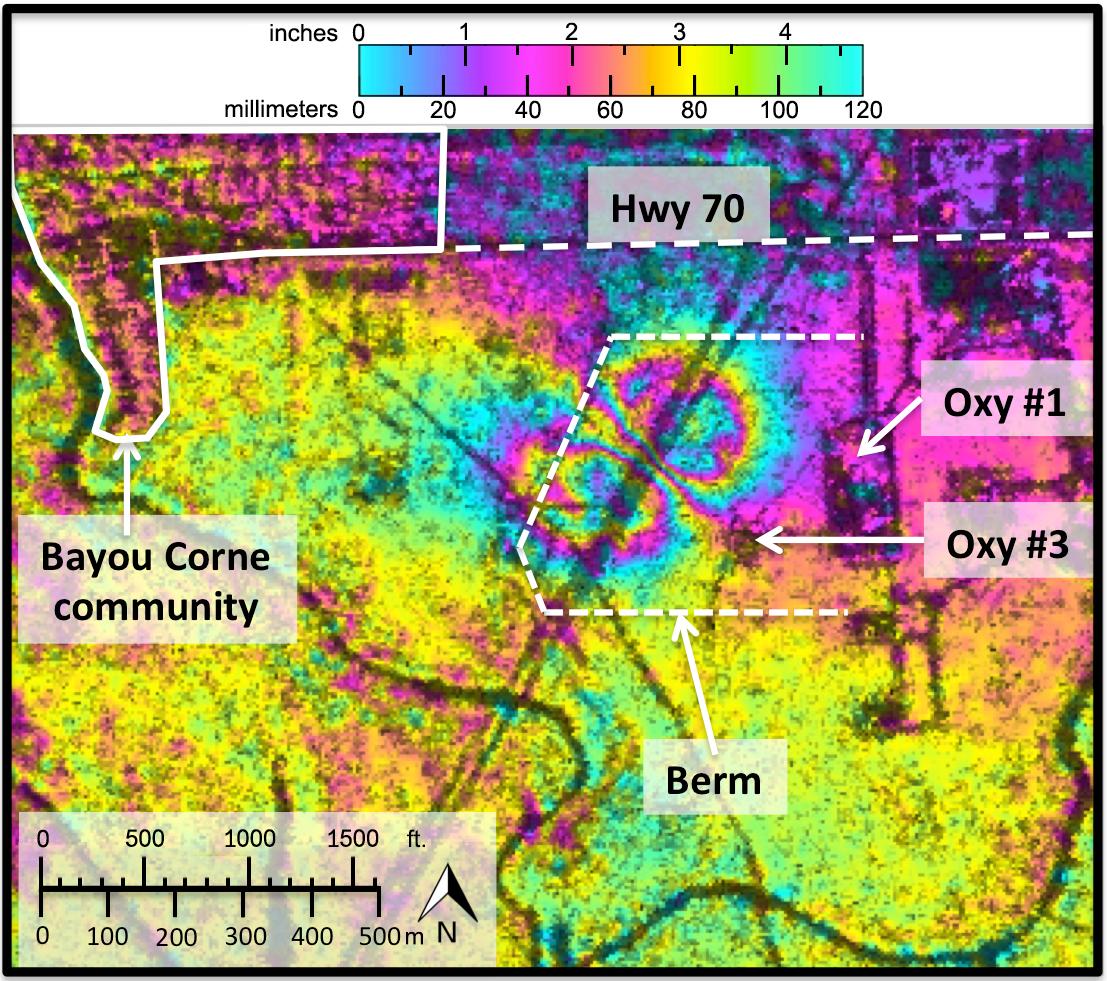
Data showed the ground near Bayou Corne moving horizontally up to 10.2 inches (26 centimeters) toward where the sinkhole appeared suddenly in August 2012. The hole started out at about 2 acres of size (1 hectare) — an area smaller than the initial ground movements — and now measures about 25 acres (10 hectares).
The research was published in the journal Geology in February, and was first made available online in December. NASA highlighted the information in a press release published in early March.
“While horizontal surface deformations had not previously been considered a signature of sinkholes, the new study shows they can precede sinkhole formation well in advance,” stated Cathleen Jones, leader of the research and a part of NASA’s Jet Propulsion Laboratory in California.
Regions and rock types of the United States that could be vulnerable to sinkholes. Credit: U.S. Geological Survey
“This kind of movement may be more common than previously thought, particularly in areas with loose soil near the surface.”
Jones and her NASA JPL colleague, Blom, found the information in NASA’s interferometric synthetic aperture radar (inSAR), which flew over the region in June 2011 and July 2012 on the agency’s Uninhabitated Aerial Vehicle Synthetic Aperture Radar. The radar can see shifts in the Earth’s surface.
The sinkhole — which is full of water and ground-up solids and is still getting bigger — collapsed after several small earthquakes and after the community became aware of “bubbling natural gas” in the area, NASA stated.
A sinkhole threatens the nearby community of Bayou Corne, Louisiana in this image released on NASA’s website in March 2014. Credit: NASA/JPL-Caltech
“It was caused by the collapse of a sidewall of an underground storage cavity connected to a nearby well operated by Texas Brine Company and owned by Occidental Petroleum,” the agency added.
“On-site investigation revealed the storage cavity, located more than 3,000 feet (914 meters) underground, had been mined closer to the edge of the subterranean Napoleonville salt dome than thought.” (A salt dome is a location in sedimentary rocks where salt is pushed up beneath the surface.)
Measurements of the area were taken as recently as October 2013, as the growing sinkhole is threatening the nearby community as well as a highway in the region.
The International Space Station will be getting its very own laser at the end of 2014. And unlike the planet-smashing capabilities of the Death Star of Star Wars fame, this laser will to be enlisted for the purpose of science.
It’s called CATS, and no, it isn’t the latest attempt to put feline astronauts in space. CATS stands for the Cloud Aerosol Transport System. The goal of CATS is to study the distribution of tiny particles of dust and air contaminants known as aerosols.
Developed by research scientist Matt McGill at NASA’s Goddard Space Flight Center in Greenbelt Maryland, CATS is slated to head to the International Space Station later this year on September 12th aboard SpaceX’s CRS-5 flight of the Dragon spacecraft. CATS will be installed on the Japanese Experiment Module-Exposed Facility (JEM-EF) and will demonstrate the utility of state-of-the-art multi-wavelength laser technology to study aerosol distribution and transport in the atmosphere.
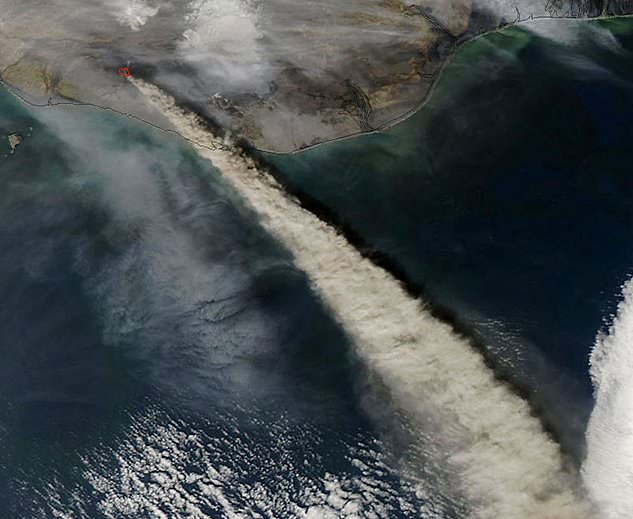
Such knowledge is critical in understanding the path and circulation of aerosols and pollutants worldwide. When the Eyjafjallajökull volcano erupted in Iceland back in 2010, many trans-Atlantic flights were grounded as a precaution. These measures are necessary as several flights have suffered engine failures in the past due to encounters with volcanic ash clouds, such as the four engine failure of KLM Fight 867 in 1989 and the British Airways Flight 9 incident over Southeast Asia in 1982. Knowing where these dangerous ash clouds are is crucial to the safety of air travel.
The expanding ash cloud spewing from Iceland’s Eyjafjallajökull volcano as seen from space in 2010. Credit: NASA.
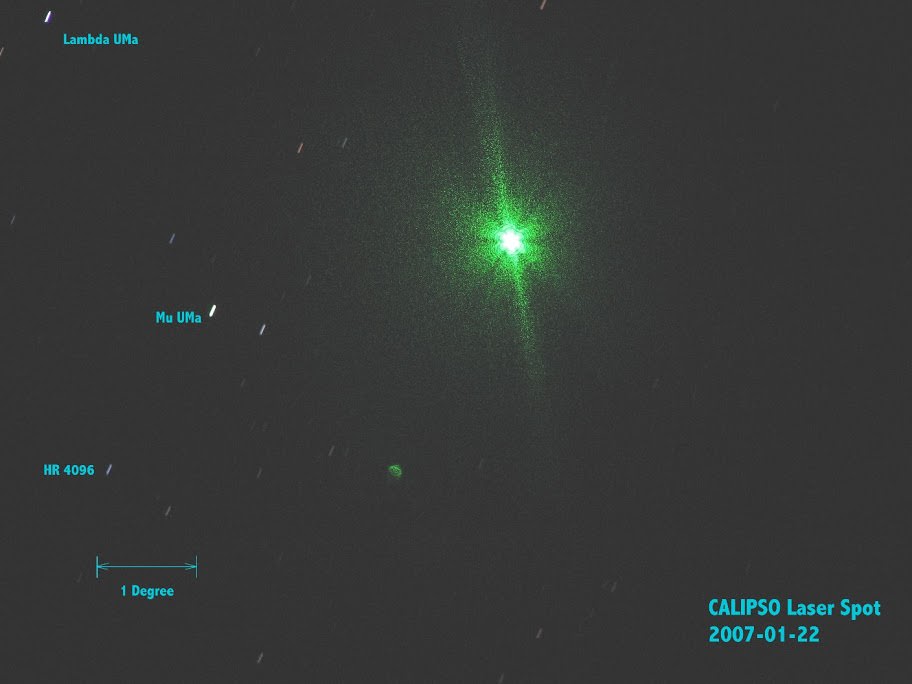
To accomplish this, CATS will emit 5,000 1 milliJoule laser pulses a second at the 1064, 532 and 355 nanometer wavelengths. This represents a vast improvement in power requirements and thermal capabilities over a similar instrument currently in service aboard the Cloud-Aerosol Lidar and Infrared Pathfinder Satellite Observations (CALIPSO) Earth remote sensing spacecraft.
And it’s that third 355 nanometer wavelength that will make CATS stand out from CALIPSO. This will also allow researchers to differentiate between particle size and measure the horizontal and vertical distribution of aerosol particles in the atmosphere. CATS will also be capable of measuring the number of individual photons being reflected back at it, which will provide a much better resolution and understanding of current atmospheric activity.
“You get better data quality because you make fewer assumptions, and you get, presumably, a more accurate determination of what kind of particles you’re seeing in the atmosphere,” McGill said in a recent press release.
The International Space Station also provides a unique vantage point for CATS. In a highly inclined 51.7 degree orbit, the station passes over a good swath of the planet on 16 orbits daily on a westward moving ground track that repeats roughly every three days. This will assure CATS has coverage over a large percentage of the planet, including known pollutant transport routes across the northern Pacific and down from Canada over the U.S. Great Lakes region.
While the first two lasers will operate in the infrared and visual wavelengths, said third laser will work in the ultraviolet. And while this will give CATS an enhanced capability, engineers also worry that it may also be susceptible to contamination. “If you get contamination on any of your outgoing optics, they can self-destruct, and then your system is dead. You end up with a very limited instrument lifetime,” McGill said.
Still, if CATS is successful, it may pave the way for larger, free-flying versions that will monitor long-range atmospheric patterns and shifts in climate due to natural and man-made activity. And the ISS makes a good platform to test pathfinder missions like CATS at low cost. “In our current budget-constrained environment, we need to use what we already have, such as the [station], to do more with less,” McGill said.
CALIPSO’s LiDAR imagedfrom the ground by Gregg Hendry in 2008. Used with permission.
The advent of a LiDAR system aboard the ISS has also generated a spirited discussion in the satellite tracking community concerning prospects for spotting CATS in operation from the ground. The CALIPSO LiDAR has been captured by ground spotters in the past. However, CALIPSO fires a much more powerful 110 milliJoule pulse at a rate of 20 times a second. Still, the lower power CATS system will be firing at a much faster rate, delivering a cumulative 5,000 milliJoules a second. CATS won’t be bright enough to show up on an illuminated pass of the ISS, but it just might be visible during darkened passes of the ISS through the Earth’s shadow. And, unlike CALLIPSO — which is part of the difficult to observe A-Train of Earth-observing satellites — the ISS passes in view of a majority of humanity. At very least, activity from CATS will be worth watching out for, and may well be seen either visually or photographically.
We’ll soon be adding CATS to the long list of outstanding science experiments being conducted aboard the International Space Station, and the sight of this “fully armed and operational battle station” may soon be coming to a dark sky site near you!
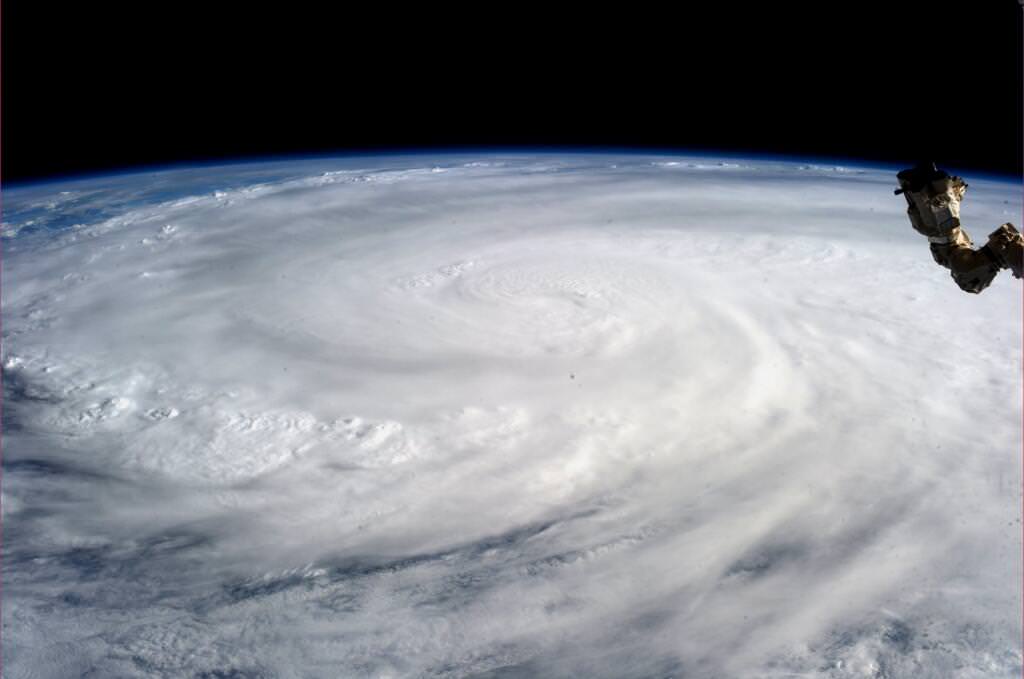
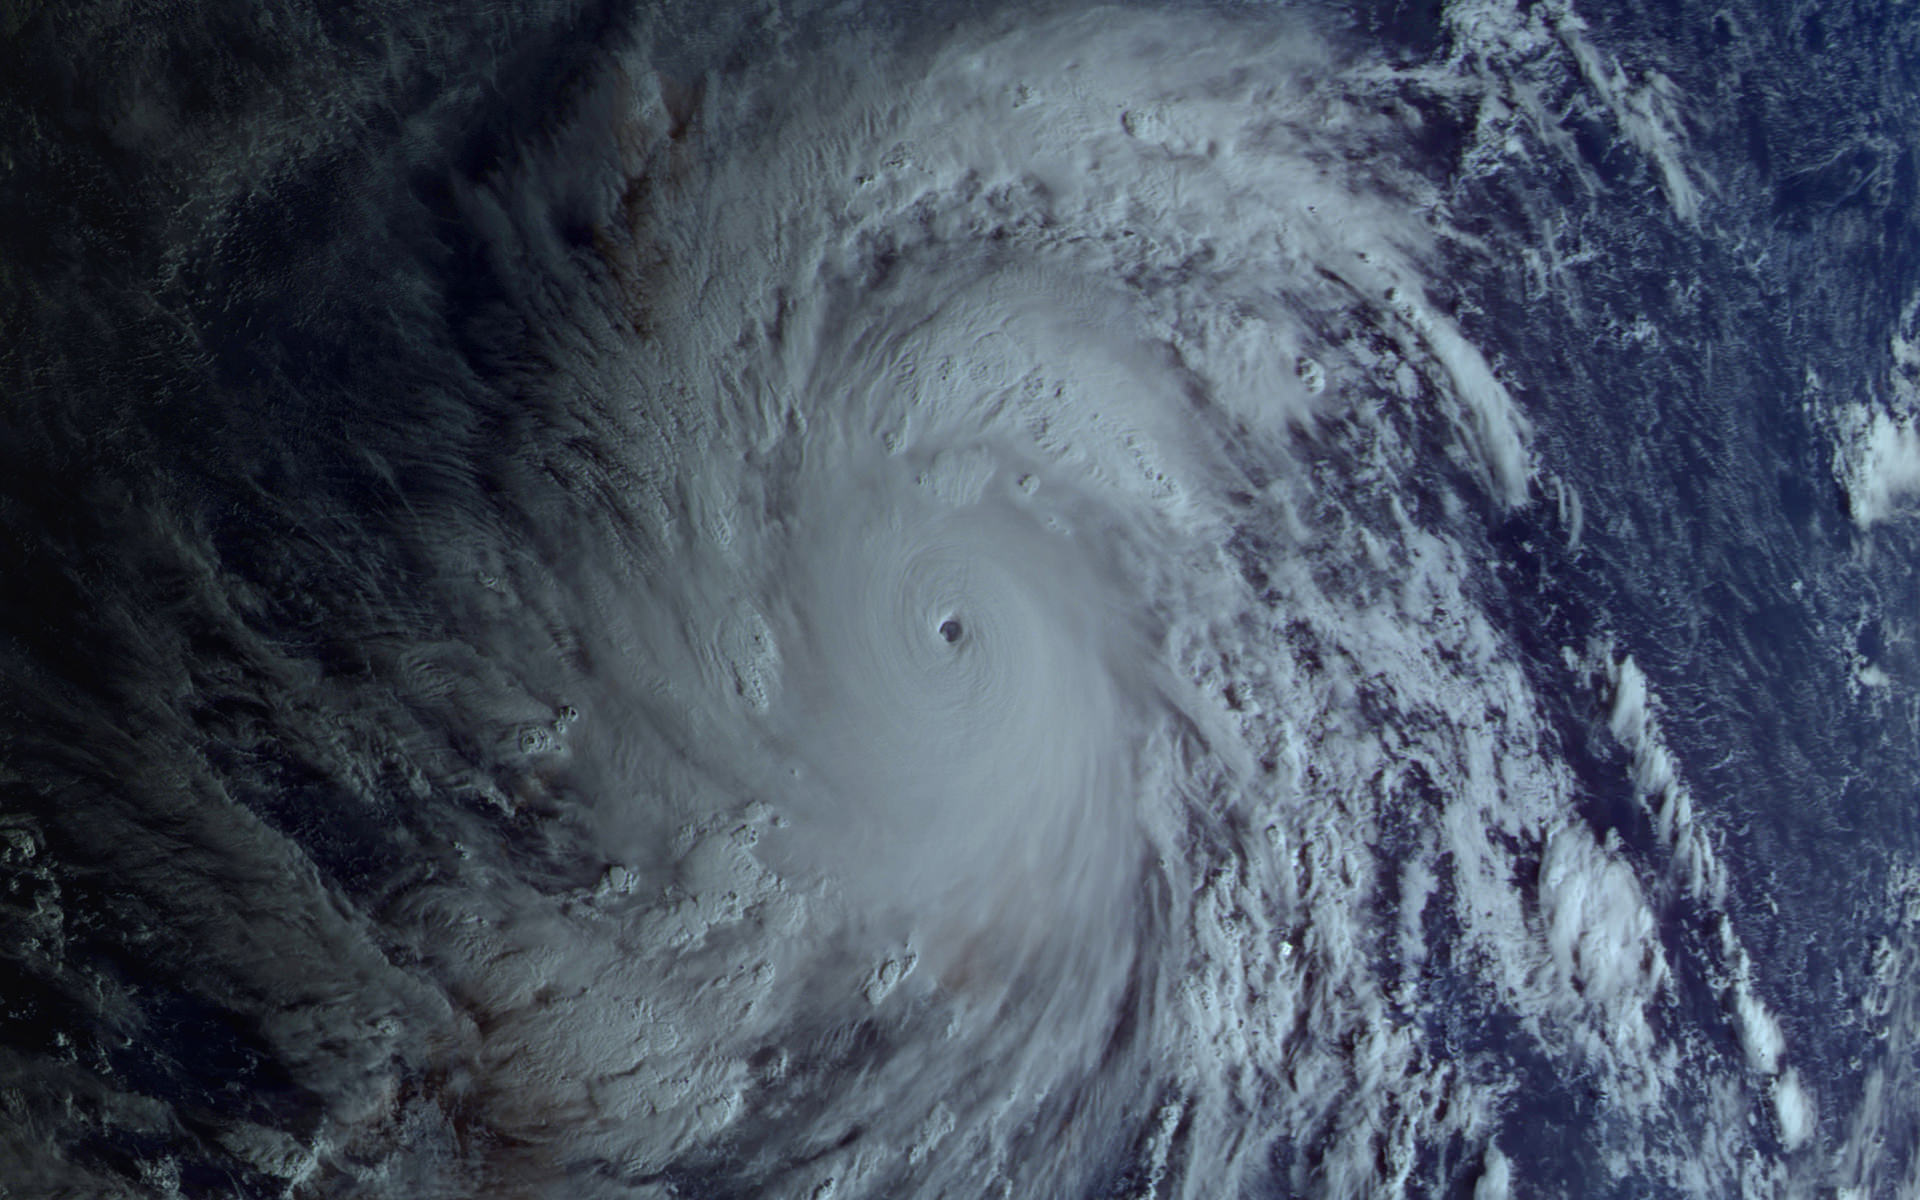
Super Typhoon Haiyan over the Philippines on November 9, 2013 as imaged from Earth orbit by NASA Astronaut Karen Nyberg aboard the International Space Station. Credit: NASA/Karen Nyberg
Super Typhoon Haiyan over the Philippines on November 9, 2013 as imaged from Earth orbit by NASA Astronaut Karen Nyberg aboard the International Space Station.Category 5 killer storm Haiyan stretches across the entire photo from about 250 miles (400 kilometer) altitude. Credit: NASA/Karen Nyberg See more Super Typhoon Haiyan imagery and video below
[/caption]
NASA GODDARD SPACE FLIGHT CENTER, MARYLAND – Super Typhoon Haiyan smashed into the island nation of the Philippines, Friday, Nov. 8, with maximum sustained winds estimated at exceeding 195 MPH (315 kilometer per hour) by the U.S. Navy Joint Typhoon Warning Center – leaving an enormous region of catastrophic death and destruction in its terrible wake.
The Red Cross estimates over 1200 deaths so far. The final toll could be significantly higher. Local media reports today say bodies of men, women and children are now washing on shore.
The enormous scale of Super Typhoon Haiyan can be vividly seen in space imagery captured by NASA, ISRO and Russian satellites – as well as astronaut Karen Nyberg flying overhead on board the International Space Station (ISS); collected here.
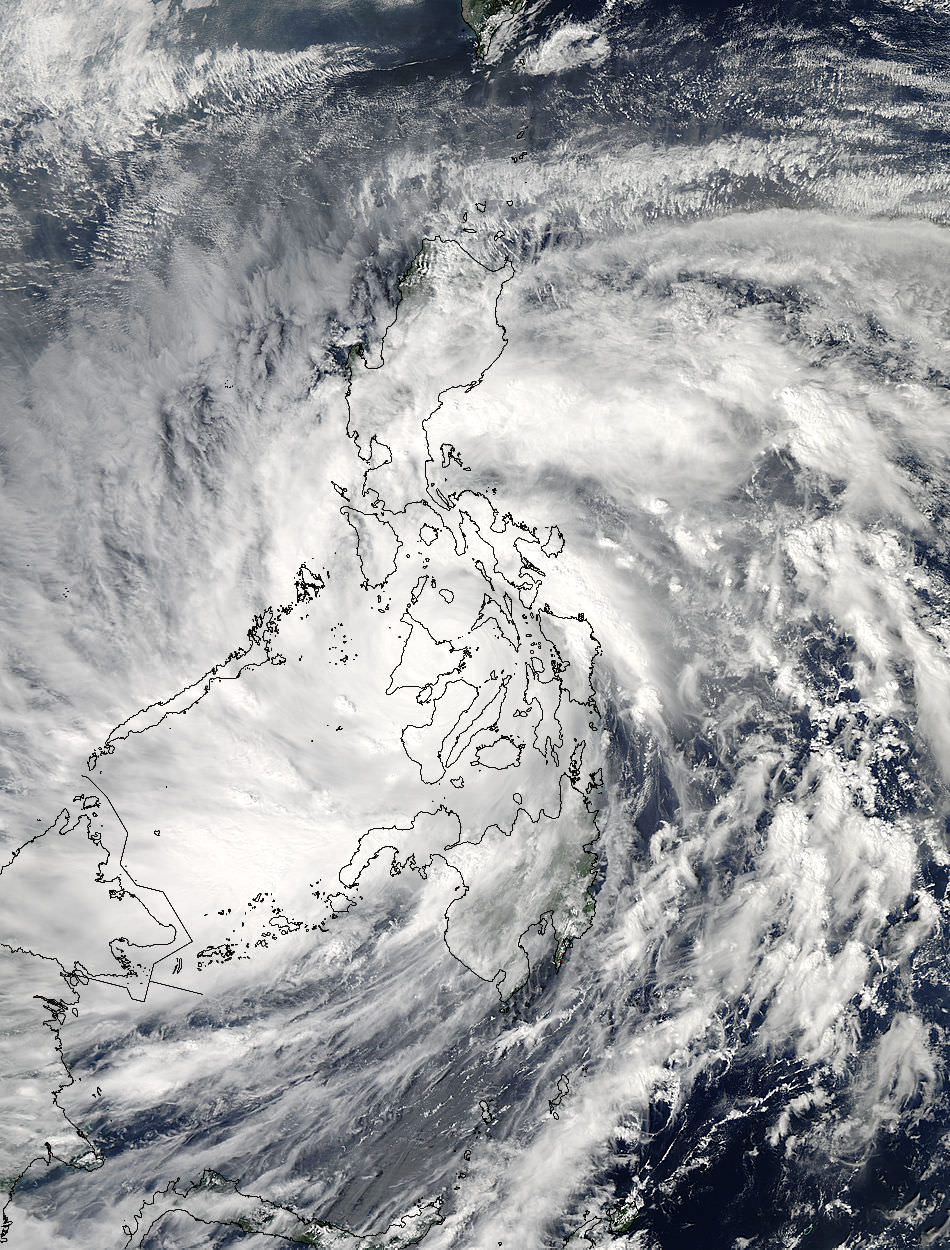
As Super-Typhoon Haiyan moved over the central Philippines on Nov. 8 at 05:10 UTC/12:10 a.m. EDT, the MODIS instrument aboard NASA’s Aqua satellite captured this visible image. Credit: NASA Goddard MODIS Rapid Response Team
Super Typhoon Haiyan is reported to be the largest and most powerful storm ever to make landfall in recorded human history.
Haiyan is classified as a Category 5 monster storm on the U.S. Saffir-Simpson scale.
It struck the central Philippines municipality of Guiuan at the southern tip of the province of Eastern Samar early Friday morning Nov. 8 at 20:45 UTC (4:45 am local time).
As Haiyan hit the central Philippines, NASA says wind gusts exceeded 235 mph (379 kilometers per hour).
The high resolution imagery and precise measurements provided by the worlds constellation of Earth observing space satellites (including NASA, Roscosmos, ISRO, ESA, JAXA) are absolutely essential to tracking killer storms and providing significant advance warning to evacuate residents in affected areas to help minimize the death toll and damage.
More than 800,000 people were evacuated. The storm surge caused waves exceeding 30 feet (10 meters), mudslides and flash flooding.
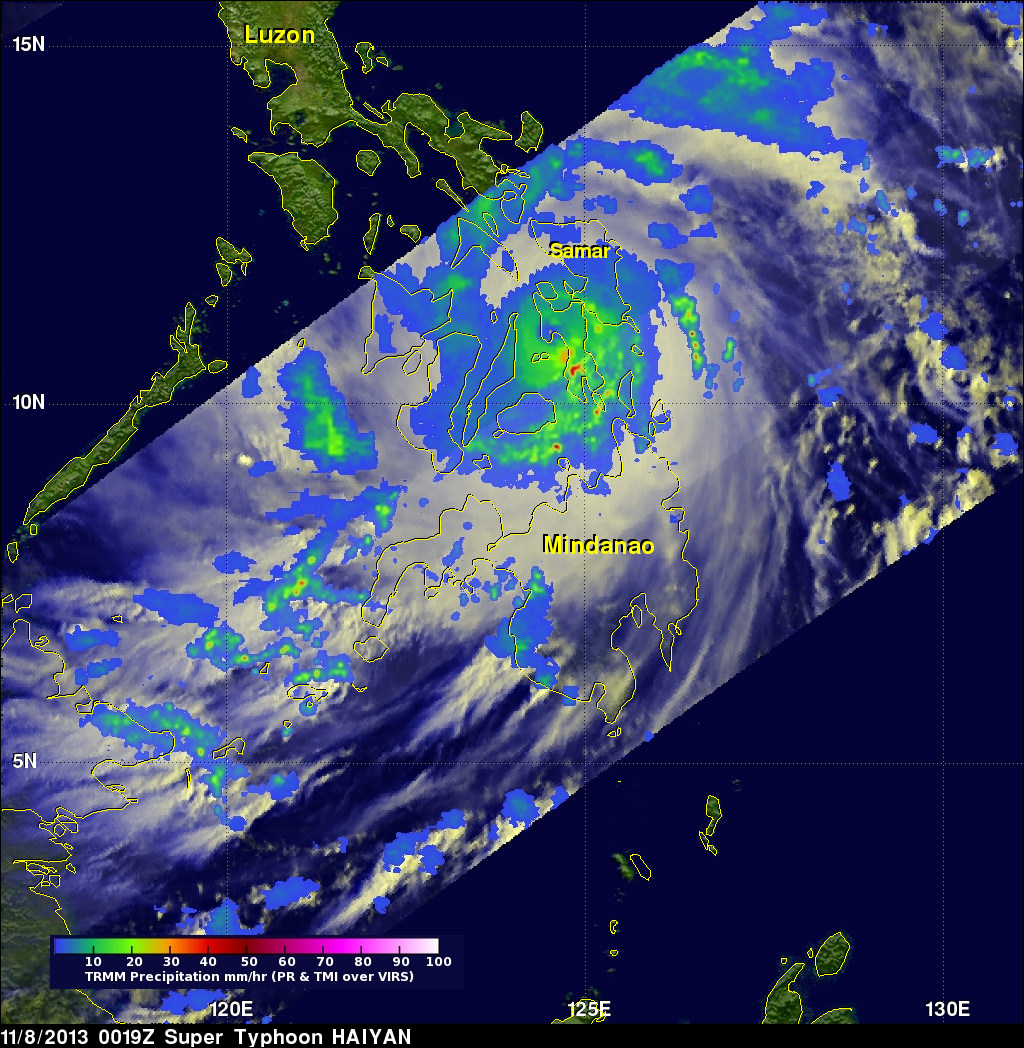
NASA’s Tropical Rainfall Measuring Mission (TRMM) satellite captured visible, microwave and infrared data on the storm just as it was crossing the island of Leyte in the central Philippines, reports NASA – see image below.
NASA’s TRMM satellite data on Nov. 8 at 00:19 UTC showed Haiyan had a well-defined eye surrounded by a symmetric area of moderate rain (green ring with a blue center) with several rainbands wrapping in from the south (green arcs) while crossing the island of Leyte in the central Philippines. Credit: NASA/SSAI, Hal Pierce
TRMM data from rain rates are measured by the TRMM Precipitation Radar (PR) and TRMM Microwave Imager (TMI) and combined with infrared (IR) data from the TRMM Visible Infrared Scanner (VIRS) by science teams working at NASA’s Goddard Space Flight Center in Greenbelt, Md.
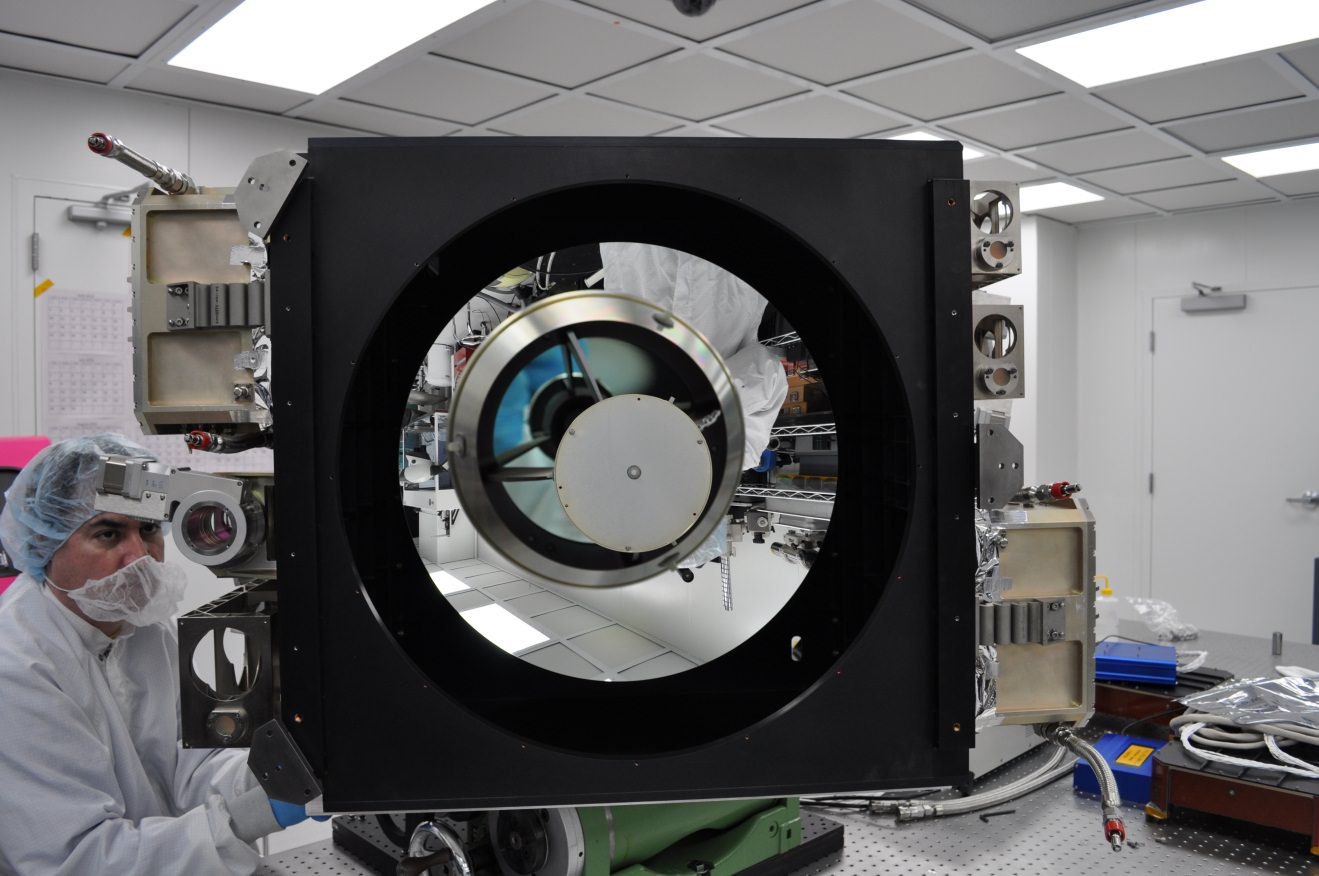
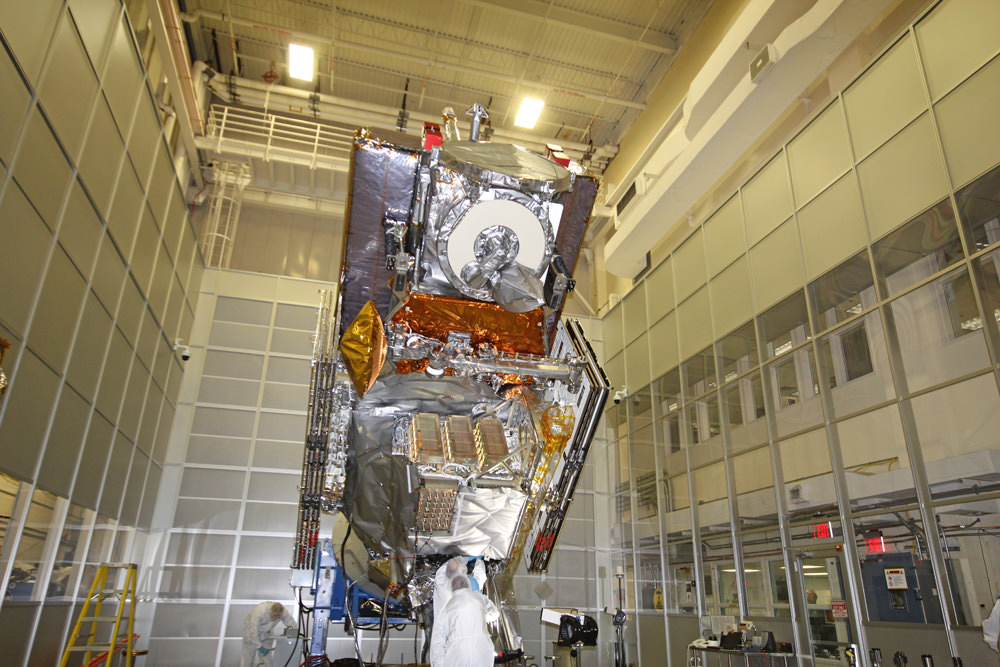
Coincidentally NASA Goddard has just completed assembly of the next generation weather satellite Global Precipitation Measurement (GPM) observatory that replaces TRMM – and where I inspected the GPM satellite inside the Goddard clean room on Friday.
“GPM is a direct follow-up to NASA’s currently orbiting TRMM satellite,” Art Azarbarzin, GPM project manager, told Universe Today during my exclusive clean room inspection of the huge GPM satellite.
NASA’s next generation Global Precipitation Measurement (GPM) observatory inside the clean room at NASA Goddard Space Flight Center. GPM is slated to launch In February 2014 and will provide global measurements of rain and snow every 3 hours – as a direct follow-up to NASA’s currently orbiting TRMM satellite; reaching the end of its usable lifetime.
Credit: Ken Kremer/kenkremer.com
“TRMM is reaching the end of its usable lifetime. GPM launches in February 2014 and we hope it has some overlap with observations from TRMM.”
“The Global Precipitation Measurement (GPM) observatory will provide high resolution global measurements of rain and snow every 3 hours,” Dalia Kirschbaum, GPM research scientist, told me at Goddard.
GPM is equipped with advanced, higher resolution radar instruments. It is vital to continuing the TRMM measurements and will help provide improved forecasts and advance warning of extreme super storms like Hurricane Sandy and Super Typhoon Haiyan, Azarbarzin and Kirschbaum explained.
Video Caption: Super Typhoon Haiyan imaged on Nov 6 – 8, 2013 by the Russian Elektro-L satellite operating in geostationary orbit. Credit: Roscosmos via Vitaliy Egorov
The full magnitude of Haiyan’s destruction is just starting to be assessed as rescue teams reach the devastated areas where winds wantonly ripped apart homes, farms, factories, buildings and structures of every imaginable type vital to everyday human existence.
Typhoon Haiyan is moving westward and is expected to forcefully strike central Vietnam in a day or two. Mass evacuations are underway at this time
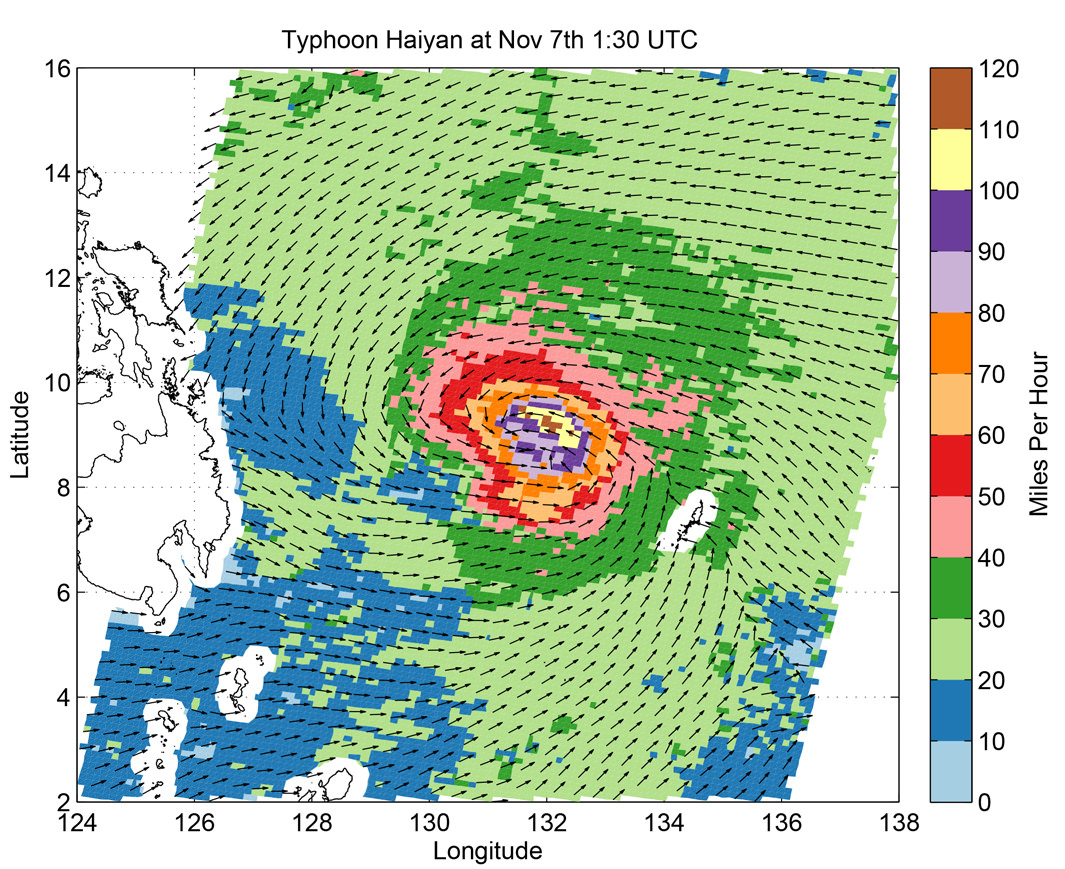
Super Typhoon Haiyan imaged by the Russian Elektro-L satellite operating in geostationary orbit. Credit: Roscosmos via Vitaliy EgorovSuper Typhoon Haiyan’s ocean surface winds were measured by the OSCAT radar scatterometer on the Indian Space Research Organization’s (ISRO) OceanSAT-2 satellite at 5:30 p.m. PST on Nov. 6. The colors indicate wind speed and arrows indicate wind direction. Credit: ISRO/NASA/JPL-Caltech
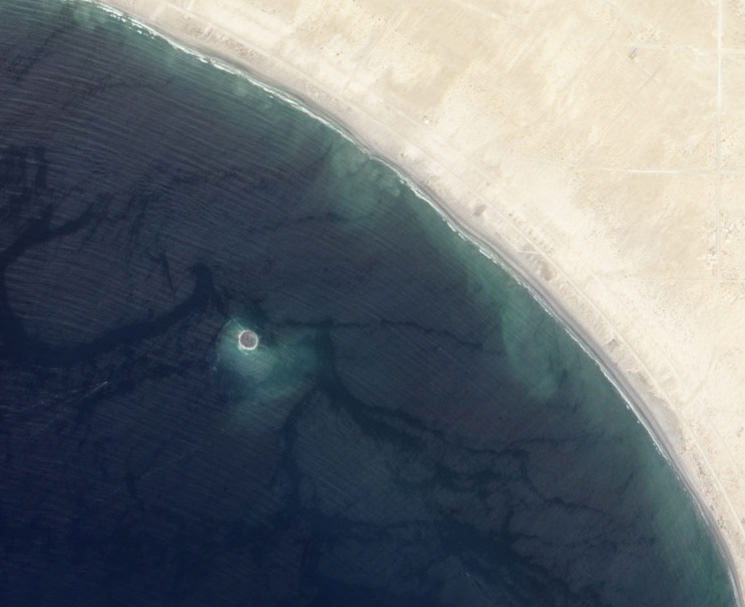
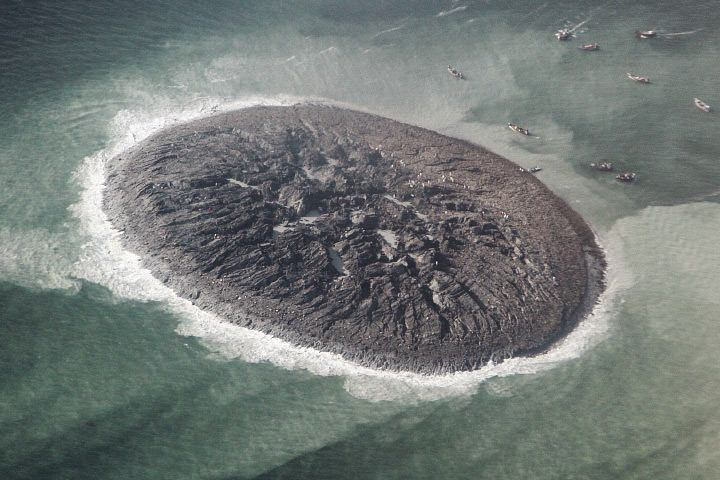
Mud island off the coast of Gwadar imaged by NASA's EO-1 satellite on Sept. 26, 2013
On the afternoon of Tuesday September 24, 2013, a 7.7-magnitude earthquake struck Balochistan province in southern Pakistan, causing widespread destruction across several districts during more than 2 minutes of powerful tremors and shaking. Sadly at least 400 people were killed (some reports say 600) and over 100,000 have been left homeless. But a weirder — if much less tragic — effect of the quake that was soon reported worldwide was the sudden appearance of a new island off the coast, a mound of mud and bubbling methane seeps rising nearly 20 meters (70 feet) from the ocean surface.
The image above, taken by NASA’s Earth Observing-1 satellite, shows the newly-formed mud island a kilometer (0.6 miles) off the Gwadar coast.
According to an article by the Pakistani news site Dawn.com, the 250-by-100-foot-long pile of mud and rocks is leaking flammable gases.
“Our team found bubbles rising from the surface of the island which caught fire when a match was lit and we forbade our team to start any flame,” said Mohammad Danish, a marine biologist from Pakistan’s National Institute of Oceanography. “It is methane gas.”
Aerial photo of the Gwadar mud volcano (National Institute of Oceanography, Pakistan)
Pakistan’s many earthquakes are the result of collisions between the Indian, Arabian, and Eurasian tectonic plates. These sorts of mud volcanoes are not particularly unusual after large quakes there… it just so happened that this one occurred near a populated coast and in relatively shallow water. (Source)
(In fact two days later another mud island was spotted off the coast of the nearby coastal town of Ormara.)
The mud volcano, which is being called “Zalzala Jazeera” (earthquake island) is not expected to last long. Wave action will eventually sweep the sediment away over the course of several months. (Dawn.com.)
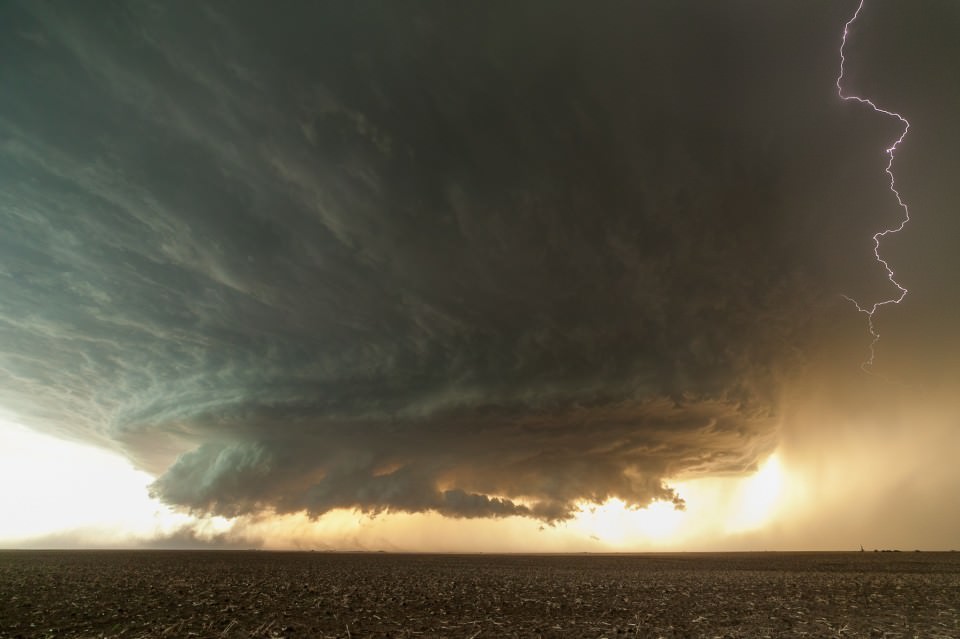
An impressive, gorgeous, powereful supercell northwest of Booker, Texas from June 3rd, 2013. Credit and copyright: Mike Olbinski/Olbinski Photography.
Photographer and storm chaser Mike Olbinski has captured some incredible storm footage over the years (such as this apocalyptic haboob in Arizona in 2011.) But his latest timelapse was something he’s been chasing down for over four years: a rotating supercell. Mike lives in Arizona, where that type of storm doesn’t happen. But he regularly visits the US Central Plains and said on his website that he’s been hoping to capture footage of “clouds that rotate and look like alien spacecraft hanging over the Earth.”
To quote Mike again, “Boy, did we find it.”
On June 3, 2013 he and his team were following storms near Booker, Texas. “We chased this storm from the wrong side (north) and it took us going through hail and torrential rains to burst through on the south side. And when we did…this monster cloud was hanging over Texas and rotating like something out of Close Encounters.”
Watch it below:
It never turned into a tornado, thankfully.
The timelapse was shot on a Canon 5D Mark II with a Rokinon 14mm 2.8 lens.
Mike says:
It’s broken up into four parts. The first section ends because it started pouring on us. We should have been further south when we started filming but you never know how long these things will last, so I started the timelapse as soon as I could.
One thing to note early on in the first part is the way the rain is coming down on the right and actually being sucked back into the rotation. Amazing.
This video has gone viral, and unfortunately some sites aren’t crediting Mike as the photographer. But just to be clear, this is a Mike Olbinski original!
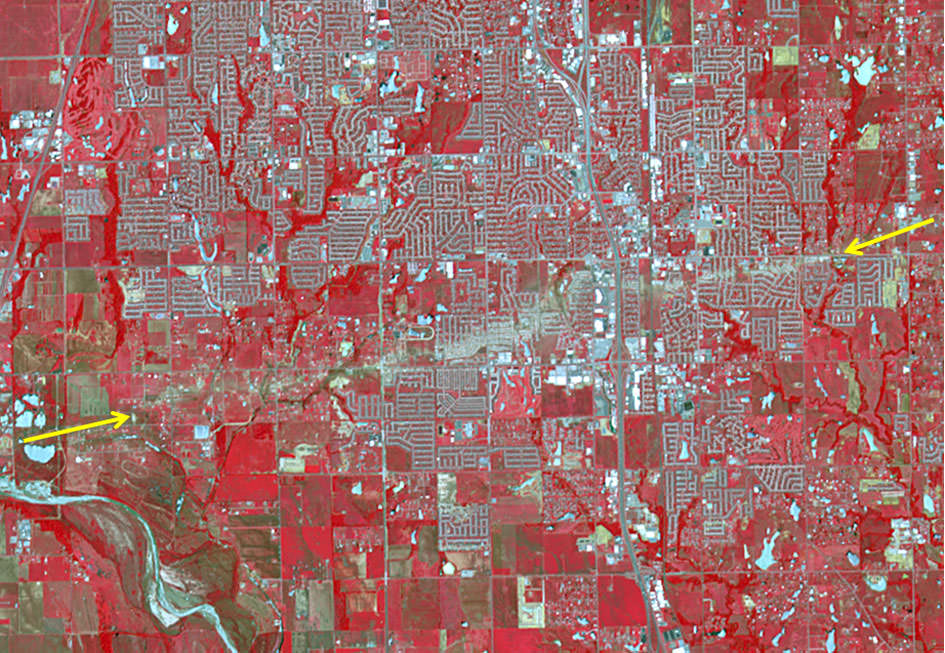
The track of the tornado that struck Moore, Oklahoma on May 20, 2013 is visible from space in this false color image taken on June 2, 2013 by the Advanced Spaceborne Thermal Emission and Reflection Radiometer (ASTER) on NASA’s Terra satellite.
The tornado that devastated the region around Moore and Newcastle, Oklahoma on May 20, 2013 has been determined to be an EF-5 tornado, the most severe on the enhanced Fujita scale, and has been called one of the most powerful and destructive tornadoes ever recorded. In this new image taken by the Advanced Spaceborne Thermal Emission and Reflection Radiometer (ASTER) on NASA’s Terra satellite, the scar of destruction on the Oklahoma landscape is clearly visible from space. In this false-color infrared image, red highlights vegetation, and the tornado track appears as a beige strip running west to east across this image; the color reveals the lack of vegetation in the wake of the storm.
According to the National Weather Service, the tornado was on the ground for 39 minutes, ripping across 17 miles (27 kilometers) from 4.4 miles west of Newcastle to 4.8 miles east of Moore. At its peak, the funnel cloud was 1.3 miles (2.1 kilometers) wide and wind speeds reached 210 miles (340 km) per hour. The storm killed at least 24 people, injured 377, and affected nearly 33,000 in some way.
In this image, infrared, red, and green wavelengths of light have been combined to better distinguish between water, vegetation, bare ground, and human developments. Water is blue. Buildings and paved surfaces are blue-gray.
You can also see an interactive satellite map from Google and Digital Globe, showing detail of every building that was damaged or destroyed. Satellite data like this are helping to assist in the recovery and rebuilding of the area. Satellite imagery can provide a systematic approach to aiding, monitoring and evaluating the process.
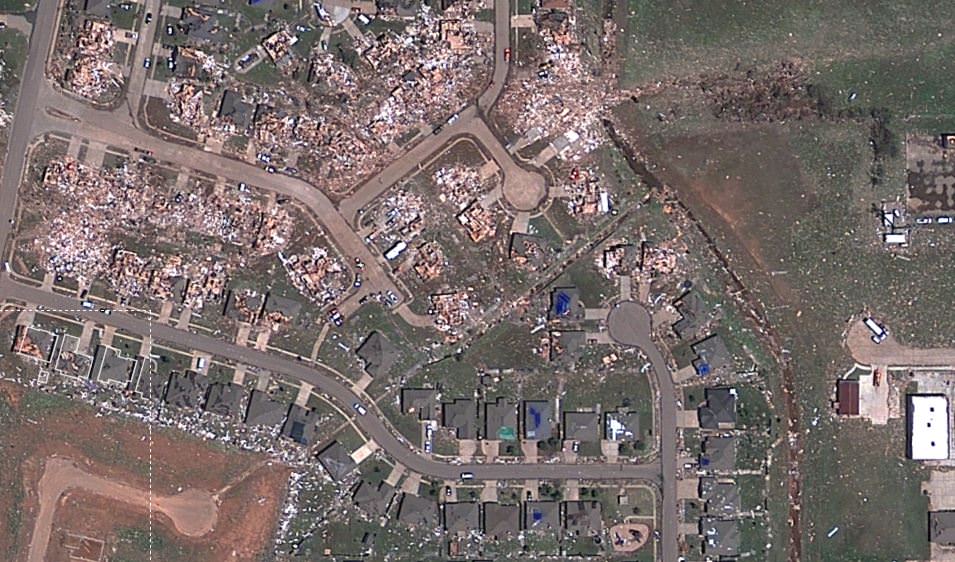
Sceenshot of a satellite view from Google/Digital Globe of the destruction in Moore, Oklahoma after the May 20, 2013 tornado. Click image to have access to an interactive, zoomable version via NPR.
A new satellite map from Google and Digital Globe shows just-released satellite imagery of the damage from the tornado that struck the area of Moore, Oklahoma on May 20, 2013. It’s been called one of the most powerful and destructive tornadoes ever recorded — determined to be an EF5 tornado, the strongest rating for a tornado — and the destruction is heartbreaking. In the screenshot above, you can see how some houses were left undamaged, while others were completely destroyed.
Click on the image above to have access to an interactive map that shows hi-resolution views of the damage, providing details of where the buildings and houses once were. NPR put this map together, using satellite data from Digital Globe, along with property data from City of Oklahoma City, City of Moore, and Cleveland County. Satellite data like this are helping to assist the recovery and rescue teams on the ground.
In the immediate aftermath of a natural catastrophe such as this tornado, the priority is searching for survivors and saving lives.
But longer term recovery — including the rebuilding of infrastructure and amenities such as schools and hospitals — can take decades, and satellite imagery can provide a systematic approach to aiding, monitoring and evaluating this process.
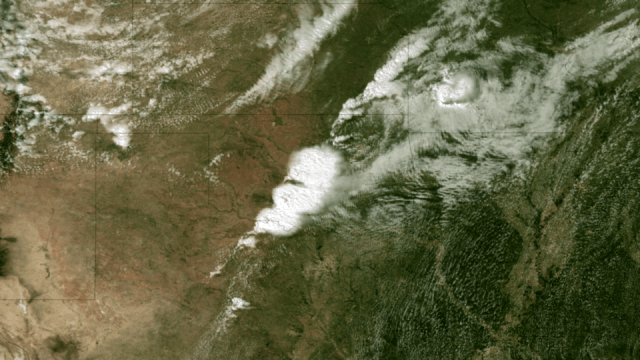
Satellite view of the destructive tornado that passed just south of Oklahoma City. The Moderate Resolution Imaging Spectroradiometer (MODIS) on NASA’s Aqua satellite acquired this image of the storm at 2:40 p.m. local time (19:40 UTC) on May 20, 2013. Credit: NASA image courtesy Jeff Schmaltz, LANCE/EOSDIS MODIS Rapid Response Team at NASA GSFC.
The Take Part website has a list of organizations that are providing support for the recovery and care of the people affected, if you would like to contribute.
Satellite Image of Oklahoma Tornado. Acquired at 2:55 CT on May 20, 2013, this image from the NOAA GOES-13 satellite shows the storms developing directly over central Oklahoma. One minute later an incredibly destructive tornado touched down in Moore, OK. Credit: NOAA.
The massive tornado that tore through parts of Oklahoma on My 20, 2013 left a 32 km (20-mile) swath of destruction and death, with winds approaching 320 km/hr (200 mph). The US National Weather Service said the 3 km (2-mile)-wide tornado spent 40 minutes on the ground in the area of Moore, Oklahoma, outside of Oklahoma City, destroying schools, a hospital and hundreds of homes, killing dozens of people. Satellite images and video show how the storm developed.
Below is a video showing satellite imagery from the GOES 13 satellite from May 19-20, 2013. It shows the tornado outbreak and supercell thunderstorms that developed across portions of the Great Plains:
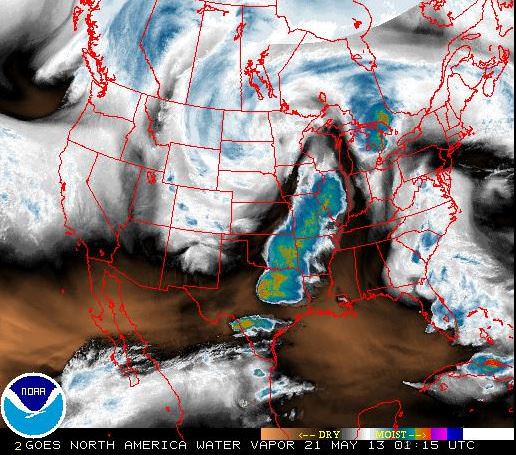
Weather satellites help scientists to observe weather patterns from the unique vantage point of space. This provides the ability to see a larger area of the Earth rather than with conventional radar which does not reveal a true overview of cloud structure and wind patterns.
These satellites can measure many different things, such as in the image below, which looks at water vapor content of the clouds. The satellites operated by NASA and NOAA and are equipped to send back images in infrared and other wavelengths, providing snapshots of things like the water vapor measurements, temperatures, wind patterns, cloud coverage, storm movement and many other readings. This information also helps with the prediction of storms, allowing for warnings for people to seek shelter from potentially destructive weather events.
This screenshot shows a false color view of the water vapor content in the clouds during the tornado outbreak in Oklahoma on May 20, 2013, as seen from NOAA geostationary (GOES) satellites. Click on image to go to current NOAA imagery.
The news from Oklahoma is ongoing, and we encourage you to keep current on the latest information from other news sites. But as Phil Plait pointed out, if you are interested in helping the people involved in this tragedy, the Take Part website has a list of organizations that are in the area providing support.
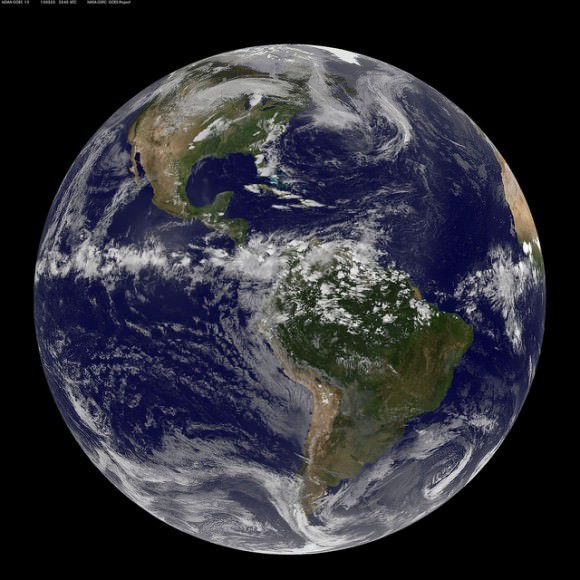
This full-disk view of Earth shows the formation of the Oklahoma tornado, from the Aqua satellite. Credit: NASA Goddard Space Flight Center.
Comets always seem to bring ‘em out of the wood work.
There’s a scene from the 1998 movie Deep Impact where the president, played by Morgan Freeman, reveals a terrible truth… the U.S. government has known for over a year that a doomsday comet is headed straight towards Earth, with Hollywood CGI destruction sure to follow.
While dramatic, the scenario is also extremely implausible. On any given evening, amateur astronomers are sweeping the skies using telescopes mounted in backyard observatories that are the envy of many major universities. This effort to discover comets is collaborative and worldwide. If the “Big One” were headed our way, even the likes of Morgan Freeman couldn’t keep it secret.
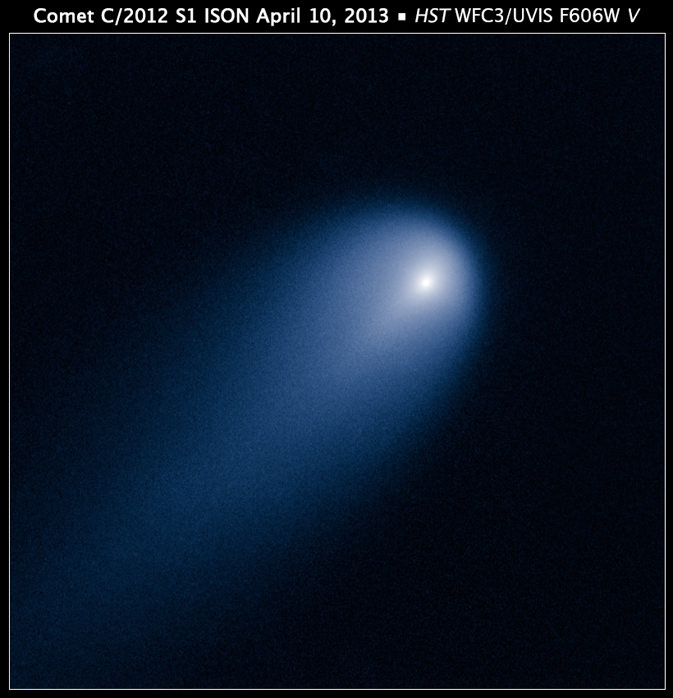
Trouble is, many unfounded claims are already making their way around the internet about this years’ much anticipated “Comet of the Century,” C/2012 S1 ISON.
Many of these conspiracy theories seem to be a recycling of last years’ Nibiru nonsense. The train of thought runs something like this: Does NASA know something that they’re not telling us? Why are they so interested in this comet? We’ve even had folks ask us why certain patches of Google Earth are “blacked out!”
What ARE they hiding, man?
It’s funny how pseudoscience seems to bubble to the top on YouTube, but I won’t give these conspiracy videos the exposure of the Universe Today platform. With hundreds of thousands of hits, they certainly don’t seem to need it. A simple YouTube search of “ISON” will scare up many wacky ideas about the comet.
In any event, we’ve already fielded several questions from friends and the public on the “dangers” posed by this comet, so we can only imagine that these will grow in intensity as the comet approaches the inner solar system, especially if it performs up to expectations.
What are some of the conspiracy theories out there about Comet ISON?
One currently circulating claim states that Comet ISON has “companions” that have been imaged trailing it. While comets do indeed fragment on occasion, the culprits that can be seen in the .gif animation circulating the internet are easily identified by photography experts as hot pixels in the camera.
Another even more extravagant claim is that Comet ISON will somehow appear “as bright as the Sun.” Even if Comet ISON reaches an expected magnitude equal to that of the full Moon at -13, it will do so when it is less than a degree from the Sun. Our Sun shines at magnitude -26.74, or over 158,000 times brighter, so it would be very difficult for this comet to compete with the Sun’s brightness in the daytime!
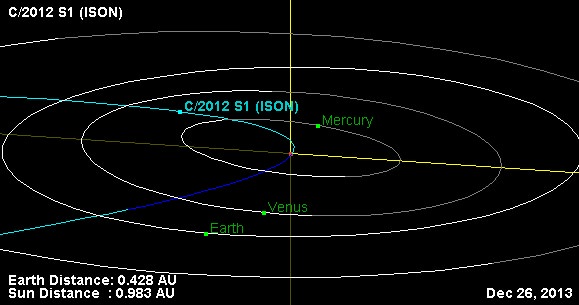
Others seem to worry that this comet — or particles from ISON — could impact Earth. Comet ISON will be making its inner solar system passage safely 0.426 A.U., or a little over 63 million kilometers from Earth even on its closest approach on December 26th. Scientists have defined this comet’s orbit very precisely, and it won’t hit Earth. So, no Comet ISON is not Nibiru — that ‘tenth planet’ destined to destroy Earth that conspiracy lovers can’t seem to let go of.
The debris — which might create a very nice meteor shower — is made up of extremely tiny grains of dust, no more than a few microns wide. Since they will be hitting Earth’s atmosphere at speeds up to 200,000 km/hr (125,000 miles per hour), the particles will burn up.
Here’s a video NASA released about the potential meteor shower from ISON:
Other claims focus on how this comet may cause earthquakes or wreak other untold havoc on Earth. This type of comet hysteria is nothing new. Name a bright comet in history, and you can find a historical event for a convenient tie-in. When haven’t there been earthquakes, pandemics, and wars in history? Plus, according to the US Geological Survey, on any given day there will be an average of 2,750 earthquakes around the world of which 275 are large enough to be felt by humans. But only about 100 earthquakes a year are large enough to cause any damage.
And so, its too easy to tie the “causes” of earthquakes and other events to comets in the sky. Comets have been seen before and during the Norman invasion of England in 1066, an outbreak of the Black Plague in London in 1665, and much more. Gary Kronk maintains a wacky and wonderful list of historical (and sometimes comical) comet “signs and omens” on his Cometography site.
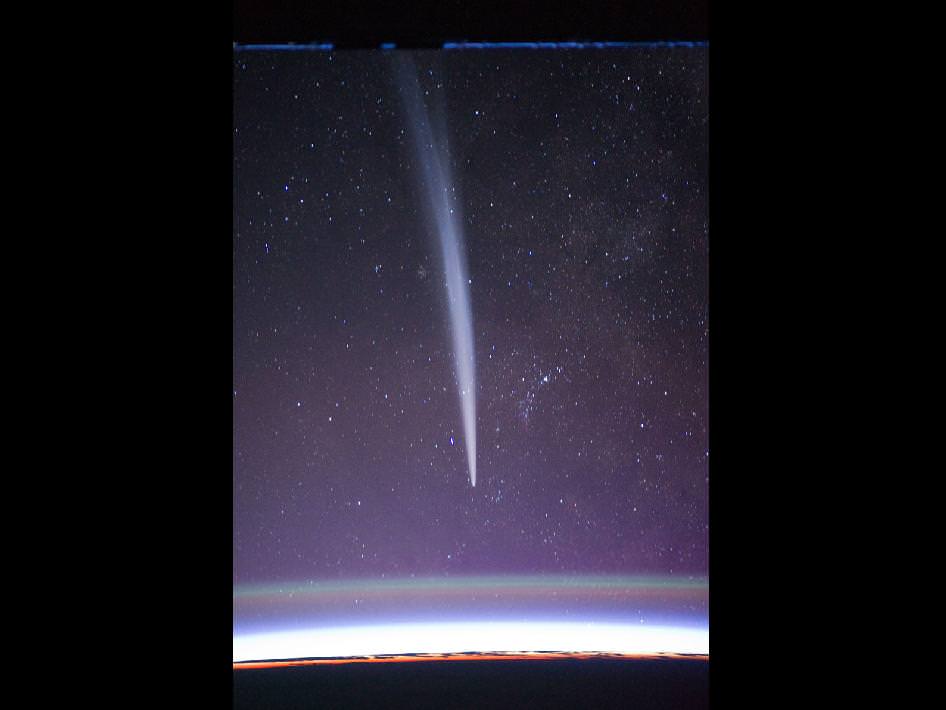
Another brilliant sungrazer, Comet Lovejoy as seen from the International Space Station on December, 2011. (Credit: NASA).
Halley’s Comet produced one of the first great comet hypes of the 20th century with its 1910 passage. Ironically, another comet made a brilliant passage just a few months prior, which became known as the Great Comet of 1910. In fact, many viewers in the general public actually saw this comet and confused it with Halley’s! The recent discovery of cyanogen in the comet’s spectra sparked a panic in the public as hucksters made a small fortune hawking “comet pills” and gas masks to panicked buyers. Never mind that folks ingest more toxic carcinogens from their daily environment than are ever seeded by the tenuous tails of comets.
Another curious bit of hype sprung up in 2011 around Comet Elenin, which promptly broke up and dissipated without even putting on a show. And the supposed earthquakes that conspiracy theorists predicted? Well, the evidence speaks loudly: nothing happened. And the same will be true of Comet ISON. It won’t cause any earthquakes or other disasters. As Don Yeomans from NASA said about Comet Elenin, “It will have an immeasurably miniscule influence on our planet. By comparison, my subcompact automobile exerts a greater influence on the ocean’s tides than comet Elenin ever will.”
So, what’s the harm in all the comet hysteria? Well, one only has to look at the mass suicide of the Heaven’s Gate cult in 1997 to realize that it can be no laughing matter. The suicide was sparked by the idea popularized on the late night Coast to Coast with Art Bell radio show that a spacecraft had been spotted following Comet Hale-Bopp.
Dozens of comets are discovered every year. A great majority are tiny iceballs in unfavorable orbits that never rise above magnitude +10 and are thus of little interest to backyard observers. A couple of times a year, a comet might reach magnitude +6 to +10 and become a fine binocular object.
When a discovery is made — be it by amateur or professional — the first task is to gain enough observations of the object to ascertain its orbit. Once again, we see the international collaborative methods employed by modern science. Already, the cosmic cat’s out of the bag as observatories worldwide make follow up measurements. There are no secrets about Comet ISON that hundreds of astronomers could keep quiet.
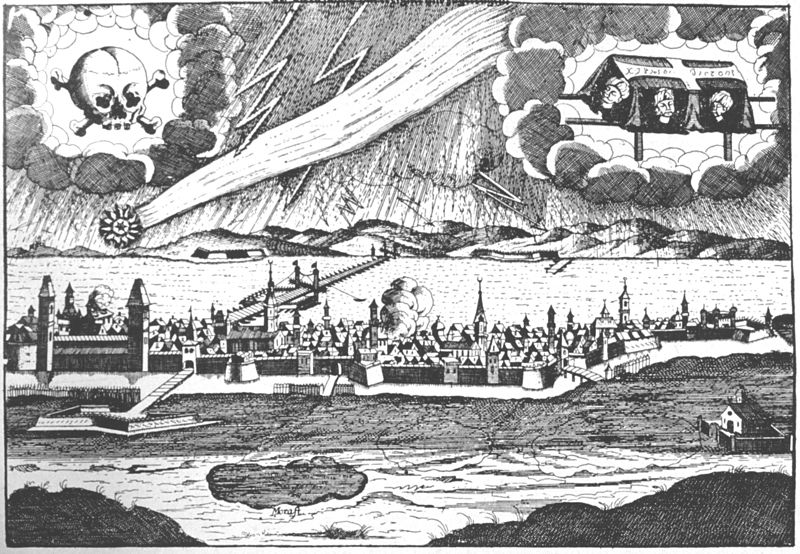
You get the idea… a 1687 leaflet depicting the havoc that a comet is sure to bring. (Wikimedia Commons image in the Public Domain).
But here are some facts about Comet C/2012 S1 ISON. It was discovered last September by Russian amateurs Vitali Nevski and Artyom Novichonok while making observations for the International Scientific Optical Network (ISON), hence the comet’s name. At the time, it was farther than Jupiter and impossibly faint, but once ISON’s orbit was determined, astronomers realized the comet would pass only 1.1 million miles from center of the Sun (680,000 miles above its surface) on November 28, 2013.
Comet ISON belongs to a special category of comets called sungrazers. As the comet performs a hairpin turn around the Sun on that date, its ices will vaporize furiously in the intense solar heat. Assuming it defies death by evaporation, ISON is expected to become a brilliant object perhaps 10 times brighter than Venus, or maybe even brighter. But that would only occur for a brief time around at perihelion (closest approach to the Sun).
In the end, Comet ISON may put on a good show, but don’t believe the hype.
Comets are notoriously unpredictable when it comes to brightness estimations. To quote comet-hunter David Levy, “Comets are like cats… they have tails, and they do exactly what they want.” But they cannot, however, violate the laws of orbital mechanics!
The orbit and orientation of Comet ISON the day after Christmas 2013 on it closest approach to the Earth. (Credit: NASA/JPL’s Small-Body Database Browser).
Impactors strike during the reign of the dinosaurs (image credit: MasPix/devianart)
The recent meteor explosion over Chelyabinsk brought to the forefront a topic that has worried astronomers for years, namely that an impactor from space could cause widespread human fatalities. Indeed, the thousand+ injured recently in Russia was a wake-up call. Should humanity be worried about impactors? “Hell yes!” replied astronomer Neil deGrasse Tyson to CNN’s F. Zakharia .
The geological and biological records attest to the fact that some impactors have played a major role in altering the evolution of life on Earth, particularly when the underlying terrestrial material at the impact site contains large amounts of carbonates and sulphates. The dating of certain large impact craters (50 km and greater) found on Earth have matched events such as the extinction of the Dinosaurs (Hildebrand 1993, however see also G. Keller’s alternative hypothesis). Ironically, one could argue that humanity owes its emergence in part to the impactor that killed the Dinosaurs.
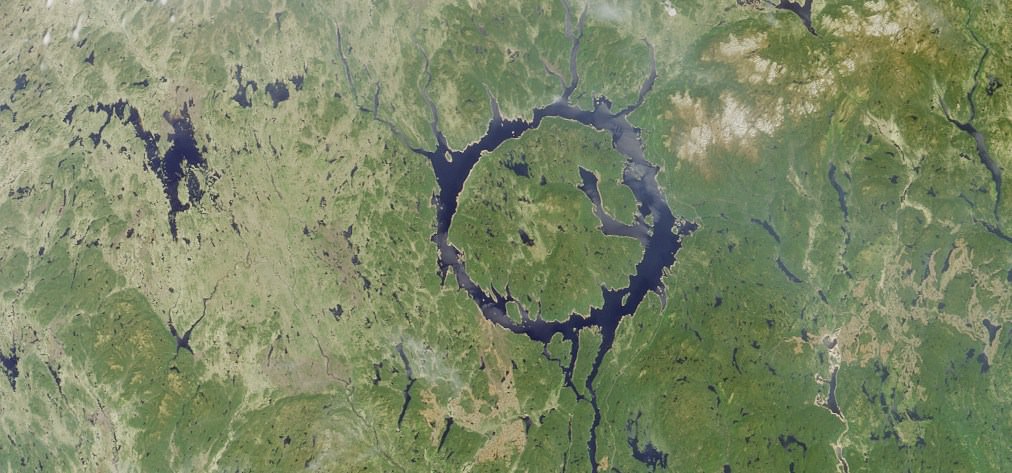
More than a dozen known impactors created 50 km sized craters (and larger) on Earth. One such example is the Manicouagan crater in Quebec, Canada. The crater is 215 million years old, and exhibits an 85 km diameter (image credit: NASA).
Only rather recently did scientists begin to widely acknowledge that sizable impactors from space strike Earth.
“It was extremely important in that first intellectual step to recognize that, yes, indeed, very large objects do fall out of the sky and make holes in the ground,” said Eugene Shoemaker. Shoemaker was a co-discoverer of Shoemaker-Levy 9, which was a fragmented comet that hit Jupiter in 1994 (see video below).
Hildebrand 1993 likewise noted that, “the hypothesis that catastrophic impacts cause mass extinctions has been unpopular with many geologists … some geologists still regard the existence of ~140 known impact craters on the Earth as unproven despite compelling evidence to the contrary.”
Beyond the asteroid that struck Mexico 65 million years ago and helped end the reign of the dinosaurs, there are numerous lesser-known terrestrial impactors that also appear destructive given their size. For example, at least three sizable impactors struck Earth ~35 million years ago, one of which left a 90 km crater in Siberia (Popigai). At least two large impactors occurred near the Jurassic-Cretaceous boundary (Morokweng and Mjolnir), and the latter may have been the catalyst for a tsunami that dwarfed the recent event in Japan (see also the simulation for the tsunami generated by the Chicxulub impactor below).
Glimsdal et al. 2007 note, “it is clear that both the geological consequences and the tsunami of an impact of a large asteroid are orders off magnitude larger than those of even the largest earthquakes recorded.”
However, in the CNN interview Neil deGrasse Tyson remarked that we’ll presumably identify the larger impactors ahead of time, giving humanity the opportunity to enact a plan to (hopefully) deal with the matter. Yet he added that often we’re unable to identify smaller objects in advance, and that is problematic. The meteor that exploded over the Urals a few weeks ago is an example.
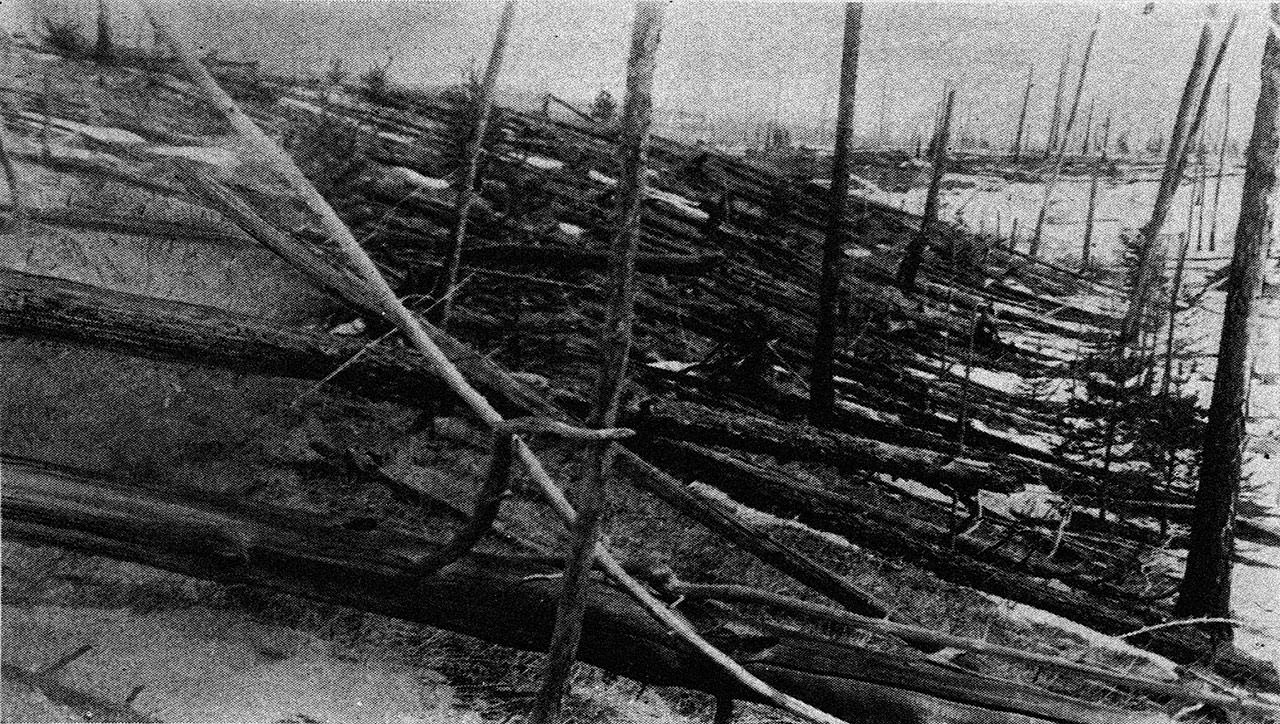
In recent human history the Tunguska event, and the asteroid that recently exploded over Chelyabinsk, are reminders of the havoc that even smaller-sized objects can cause. The Tunguska event is presumed to be a meteor that exploded in 1908 over a remote forested area in Siberia, and was sufficiently powerful to topple millions of trees (see image below). Had the event occurred over a city it may have caused numerous fatalities.
Mark Boslough, a scientist who studied Tunguska noted, “That such a small object can do this kind of destruction suggests that smaller asteroids are something to consider … such collisions are not as improbable as we believed. We should be making more efforts at detecting the smaller ones than we have till now.”
Neil deGrasse Tyson hinted that humanity was rather lucky that the recent Russian fireball exploded about 20 miles up in the atmosphere, as its energy content was about 30 times larger than the Hiroshima explosion. It should be noted that the potential negative outcome from smaller impactors increases in concert with an increasing human population.
In 1908 the Tunguska impactor toppled millions of trees in a rather remote part of Siberia (image credit: Kulik). Had the object exploded over a city, the effects may have been catastrophic.
So how often do large bodies strike Earth, and is the next catastrophic impactor eminent? Do such events happen on a periodic basis? Scientists have been debating those questions and no consensus has emerged. Certain researchers advocate that large impactors (leaving craters greater than 35 km) strike Earth with a period of approximately 26-35 million years.
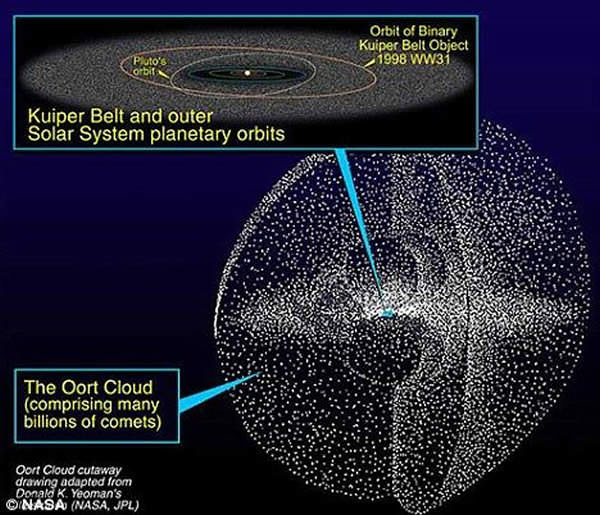
The putative periodicity (i.e., the Shiva hypothesis) is often linked to the Sun’s vertical oscillations through the plane of the Milky Way as it revolves around the Galaxy, although that scenario is likewise debated (as is many of the assertions put forth in this article). The Sun’s motion through the denser part of the Galactic plane is believed to trigger a comet shower from the Oort Cloud. The Oort Cloud is theorized to be a halo of loosely-bound comets that encompasses the periphery of the Solar System. Essentially, there exists a main belt of asteroids between Mars and Jupiter, a belt of comets and icy bodies located beyond Neptune called the Kuiper belt, and then the Oort Cloud. A lower-mass companion to the Sun was likewise considered as a perturbing source of Oort Cloud comets (“The Nemesis Affair” by D. Raup).
A halo of comets designated the Oort Cloud is theorized to encircle the periphery of the Solar System, and reputedly acts as a reservoir for objects that may become terrestrial impactors (image credit: NASA/JPL).
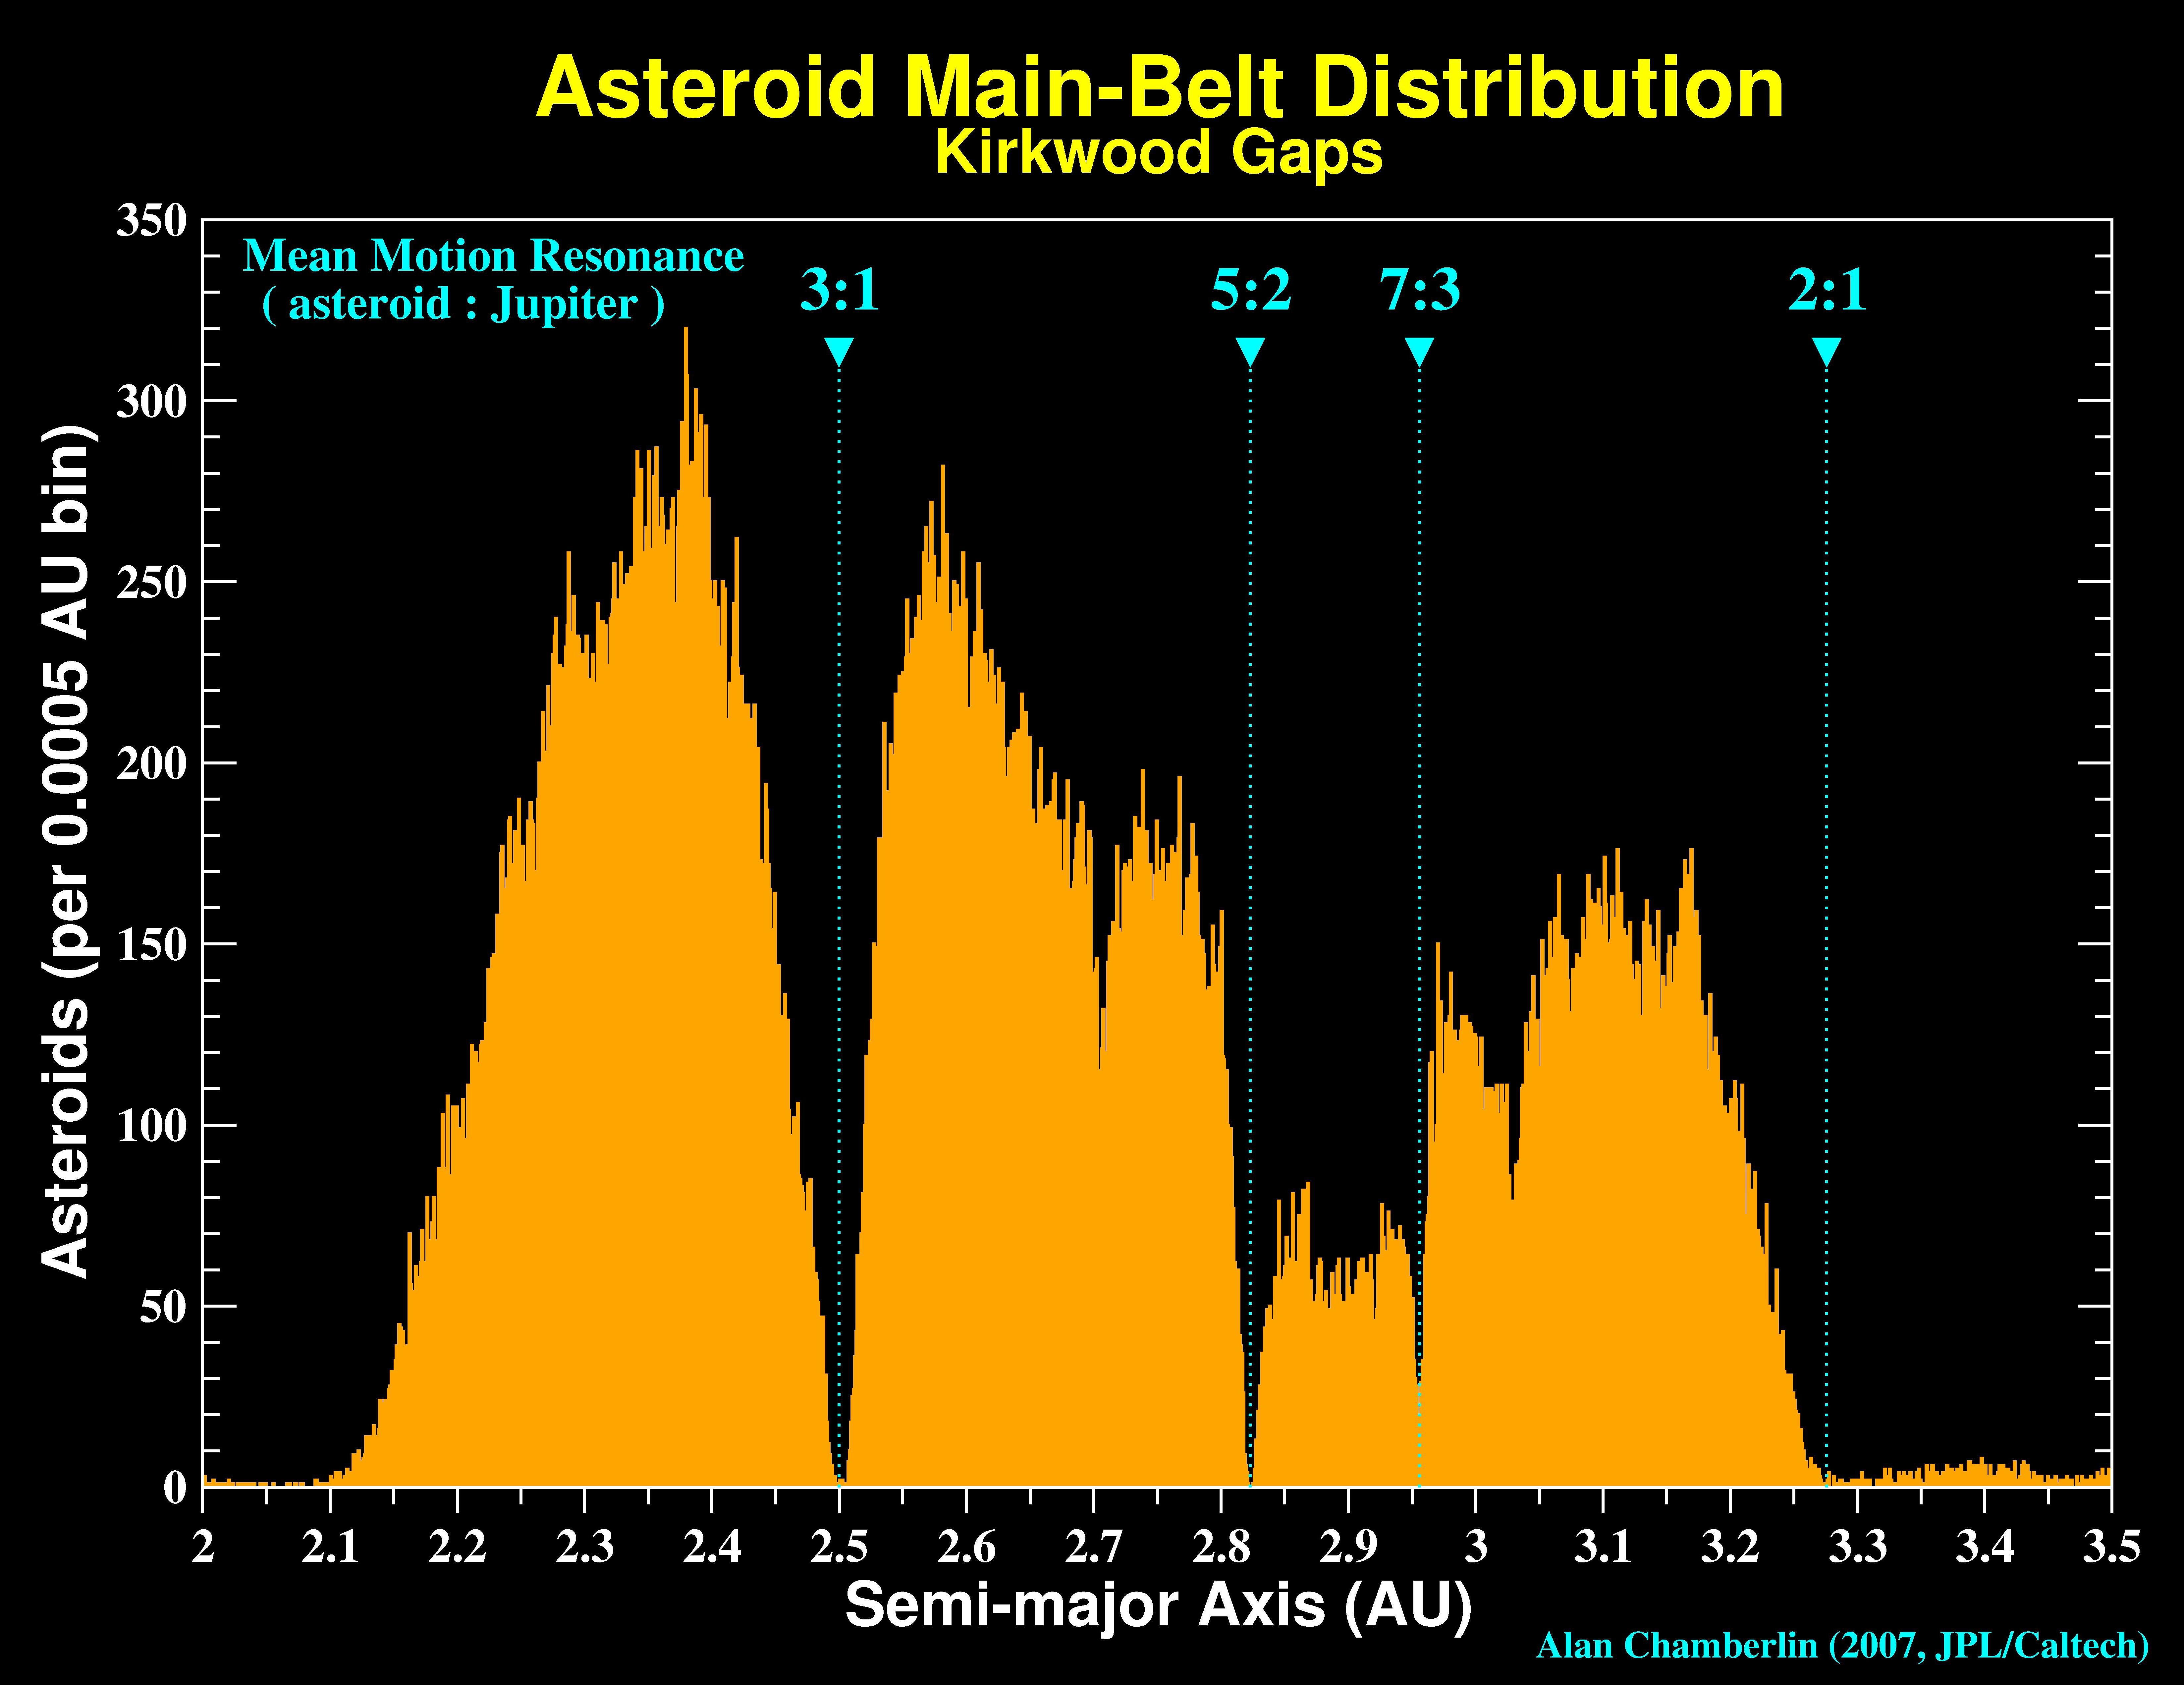
The aforementioned theory pertains principally to periodic comets showers, however, what mechanism can explain how asteroids exit their otherwise benign orbits in the belt and enter the inner solar system as Earth-crossers? One potential (stochastic) scenario is that asteroids are ejected from the belt via interactions with the planets through orbital resonances. Evidence for that scenario is present in the image below, which shows that regions in the belt coincident with certain resonances are nearly depleted of asteroids. A similar trend is seen in the distribution of icy bodies in the Kuiper belt, where Neptune (rather than say Mars or Jupiter) may be the principal scattering body. Note that even asteroids/comets not initially near a resonance can migrate into one by various means (e.g., the Yarkovsky effect).
Indeed, if an asteroid in the belt were to breakup (e.g., collision) near a resonance, it would send numerous projectiles streaming into the inner solar system. That may help partly explain the potential presence of asteroid showers (e.g., the Boltysh and Chicxulub craters both date to near 65 million years ago). In 2007, a team argued that the asteroid which helped end the reign of the Dinosaurs 65 million years ago entered an Earth-crossing orbit via resonances. Furthermore, they noted that asteroid 298 Baptistina is a fragment of that Dinosaur exterminator, and it can be viewed in the present orbiting ~2 AU from the Sun. The team’s specific assertions are being debated, however perhaps more importantly: the underlying transport mechanism that delivers asteroids from the belt into Earth-crossing orbits appears well-supported by the evidence.
A histogram featuring the number of asteroids as a function of their average distance from the Sun. Regions depleted of asteroids are often coincident with orbital resonances, the latter being a mechanism by which objects in the belt can be scattered into enter Earth-crossing orbits (image credit: Alan Chamberlain, JPL/Caltech).
Thus it appears that the terrestrial impact record may be tied to periodic and random phenomena, and comet/asteroid showers can stem from both. However, reconstructing that terrestrial impact record is rather difficult as Earth is geologically active (by comparison to the present Moon where craters from the past are typically well preserved). Thus smaller and older impactors are undersampled. The impact record is also incomplete since a sizable fraction of impactors strike the ocean. Nevertheless, an estimated frequency curve for terrestrial impacts as deduced by Rampino and Haggerty 1996 is reproduced below. Note that there is considerable uncertainty in such determinations, and the y-axis in the figure highlights the “Typical Impact Interval”.
Estimated frequency of impactors as a function of diameter, energy yield, and typical impact interval. Results assume an impact speed of 20 km/s and density of 3 g/cm^3 (image credit: Fig. 2 from Rampino and Haggerty 1996, NASA ADS/Springer).
In sum, as noted by Eugene Shoemaker, large objects do indeed fall out of the sky and cause damage. It is unclear when in the near or distant future humanity will be forced to rise to the challenge and counter an incoming larger impactor, or again deal with the consequences of a smaller impactor that went undetected and caused human injuries (the estimated probabilities aren’t reassuring given their uncertainty and what’s in jeopardy). Humanity’s technological progress and scientific research must continue unabated (and even accelerated), thereby affording us the tools to better tackle the described situation when it arises.
Is discussion of this topic fear mongering and alarmist in nature? The answer should be obvious given the fireball explosion that happened recently over the Ural mountains, the Tunguska event, and past impactors. Given the stakes excessive vigilance is warranted.
Fareed Zakharia’s discussion with Neil deGrasse Tyson is below.