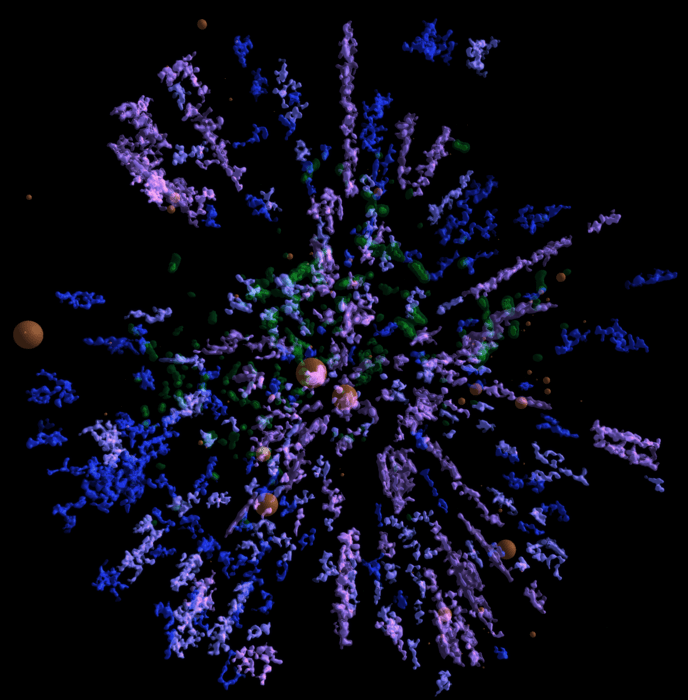
Using information from Gaia's second data release, a team of scientists have made refined estimates of the Milky Way's mass. Credit: ESA/Gaia/DPAC
Since the birth of modern astronomy, scientists have sought to determine the full extent of the Milky Way galaxy and learn more about its structure, formation and evolution. At present, astronomers estimate that it is 100,000 to 180,000 light-years in diameter and consists of 100 to 400 billion stars – though some estimates say there could be as many as 1 trillion.
And yet, even after decades of research and observations, there is still much about our galaxy astronomers do not know. For example, they are still trying to determine how massive the Milky Way is, and estimates vary widely. In a new study, a team of international scientists presents a new method for weighing the galaxy based the dynamics of the Milky Way’s satellites galaxies.
Star density map, created from the second data release of ESA’s Gaia mission. Credit: Galaxy Map / K. Jardine
In December of 2013, the European Space Agency (ESA) launched the Gaia mission, a space observatory designed to measure the positions of movements of celestial bodies. Over the course of its five-year mission, this observatory has been studying a total of 1 billion objects – including distant stars, planets, comets, asteroids, quasars, etc. – for the sake of creating the largest and most precise 3D space catalog ever made.
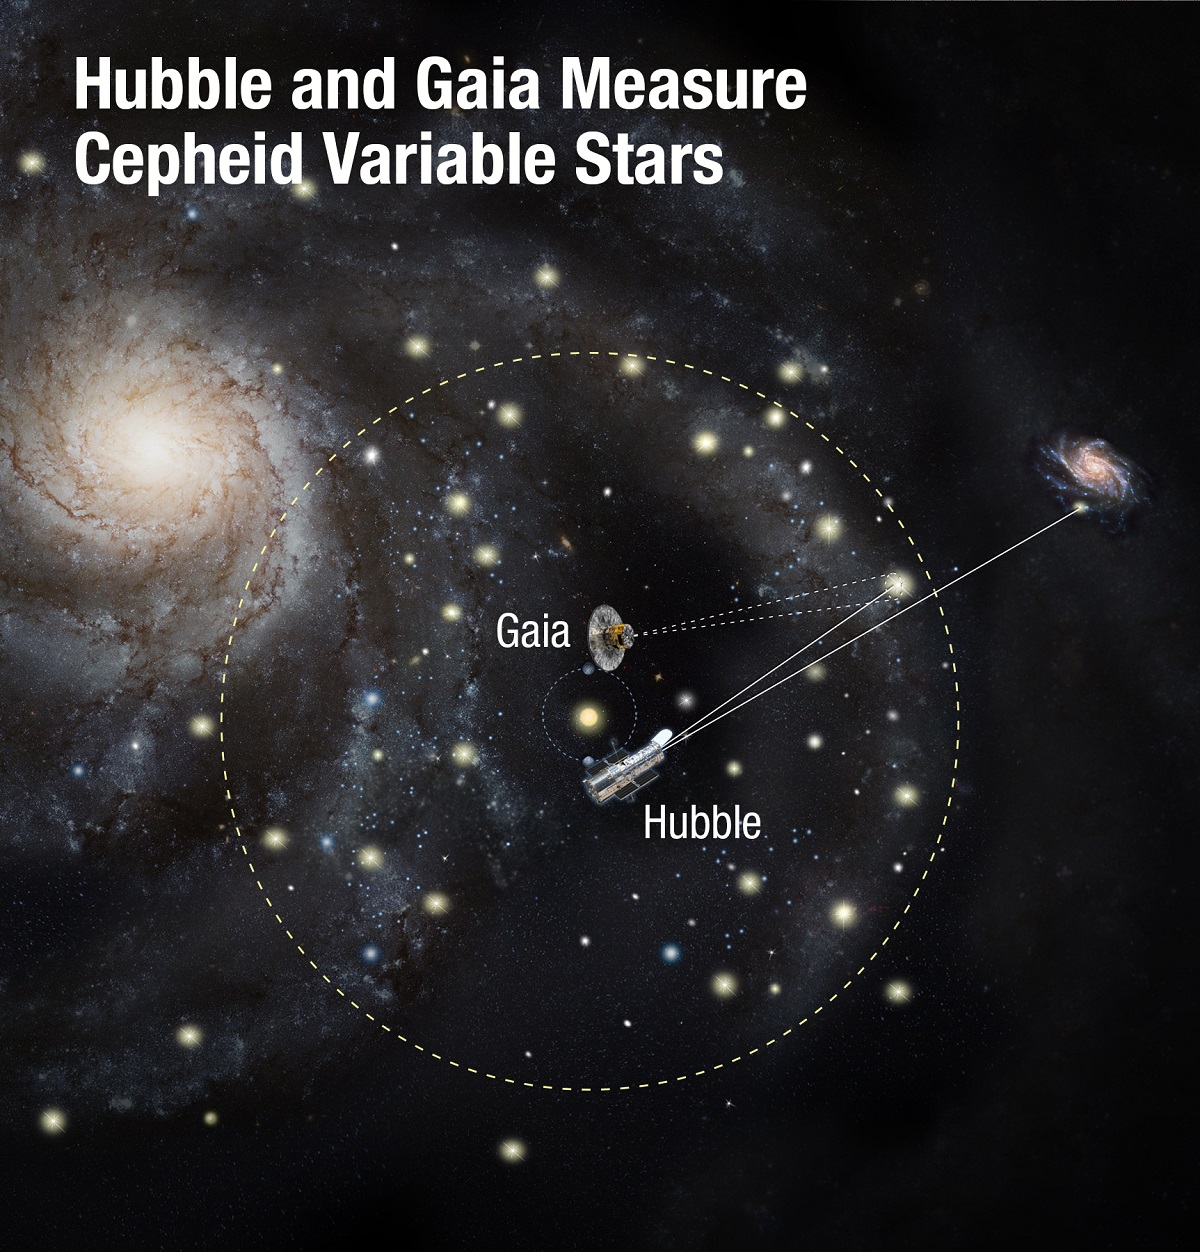
Using two of the world’s most powerful space telescopes - NASA’s Hubble and ESA’s Gaia - astronomers have made the most precise measurements to date of the universe’s expansion rate. Credits: NASA, ESA, and A. Feild (STScI)
In the 1920s, Edwin Hubble made the groundbreaking discovery that the Universe was in a state of expansion. Originally predicted as a consequence of Einstein’s Theory of General Relativity, measurements of this expansion came to be known as Hubble’s Constant. Today, and with the help of next-generation telescopes – like the aptly-named Hubble Space Telescope (HST) – astronomers have remeasured and revised this law many times.
These measurements confirmed that the rate of expansion has increased over time, though scientists are still unsure why. The latest measurements were conducted by an international team using Hubble, who then compared their results with data obtained by the European Space Agency’s (ESA) Gaia observatory. This has led to the most precise measurements of the Hubble Constant to date, though questions about cosmic acceleration remain.
This illustration shows three steps astronomers used to measure the universe’s expansion rate (Hubble constant) to an unprecedented accuracy. Credits: NASA, ESA, A. Feild (STScI), and A. Riess (STScI/JHU)
Since 2005, Adam Riess – a Nobel Laureate Professor with the Space Telescope Science Institute and the Johns Hopkins University – has been working to refine the Hubble Constant value by streamlining and strengthening the “cosmic distance ladder”. Along with his team, known as Supernova H0 for the Equation of State (SH0ES), they have successfully reduced the uncertainty associated with the rate of cosmic expansion to just 2.2%
To break it down, astronomers have traditionally used the “cosmic distance ladder” to measure distances in the Universe. This consists of relying on distance markers like Cepheid variables in distant galaxies – pulsating stars whose distances can be inferred by comparing their intrinsic brightness with their apparent brightness. These measurements are then compared to the way light from distant galaxies is redshifted to determine how fast the space between galaxies is expanding.
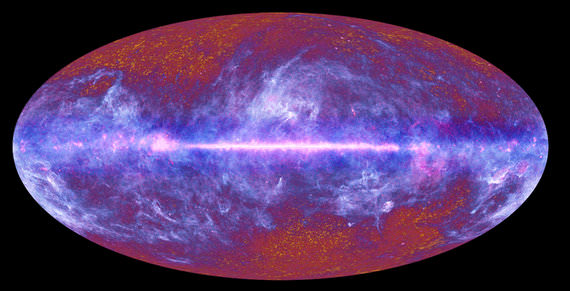
From this, the Hubble Constant is derived. Another method that is used is to observe the Cosmic Microwave Background (CMB) to trace the expansion of the cosmos during the early Universe – circa. 378,000 years after the Big Bang – and then using physics to extrapolate that to the present expansion rate. Together, the measurements should provide an end-to-end measurement of how the Universe has expanded over time.
However, astronomers have known for some time that the two measurements don’t match up. In a previous study, Riess and his team conducted measurements using Hubble to obtain a Hubble Constant value of 73 km/s (45.36 mps) per megaparsec (3.3 million light-years). Meanwhile, results based on the ESA’ Planck observatory (which observed the CMB between 2009 and 2013) predicted that the Hubble constant value should now be 67 km/s (41.63 mps) per megaparsec and no higher than 69 km/s (42.87 mps) – which represents a discrepancy of 9%.
A multi-color all-sky image of the microwave sky. Credit: ESA, HFI and LFI consortia
“The tension seems to have grown into a full-blown incompatibility between our views of the early and late time universe. At this point, clearly it’s not simply some gross error in any one measurement. It’s as though you predicted how tall a child would become from a growth chart and then found the adult he or she became greatly exceeded the prediction. We are very perplexed.”
In this case, Riess and his colleagues used Hubble to gauge the brightness of distant Cepheid variables while Gaia provided the parallax information – the apparent change in an objects position based on different points of view – needed to determine the distance. Gaia also added to the study by measuring the distance to 50 Cepheid variables in the Milky Way, which were combined with brightness measurements from Hubble.
This allowed the astronomers to more accurately calibrate the Cepheids and then use those seen outside the Milky Way as milepost markers. Using both the Hubble measurements and newly released data from Gaia, Riess and his colleagues were able to refine their measurements on the present rate of expansion to 73.5 kilometers (45.6 miles) per second per megaparsec.
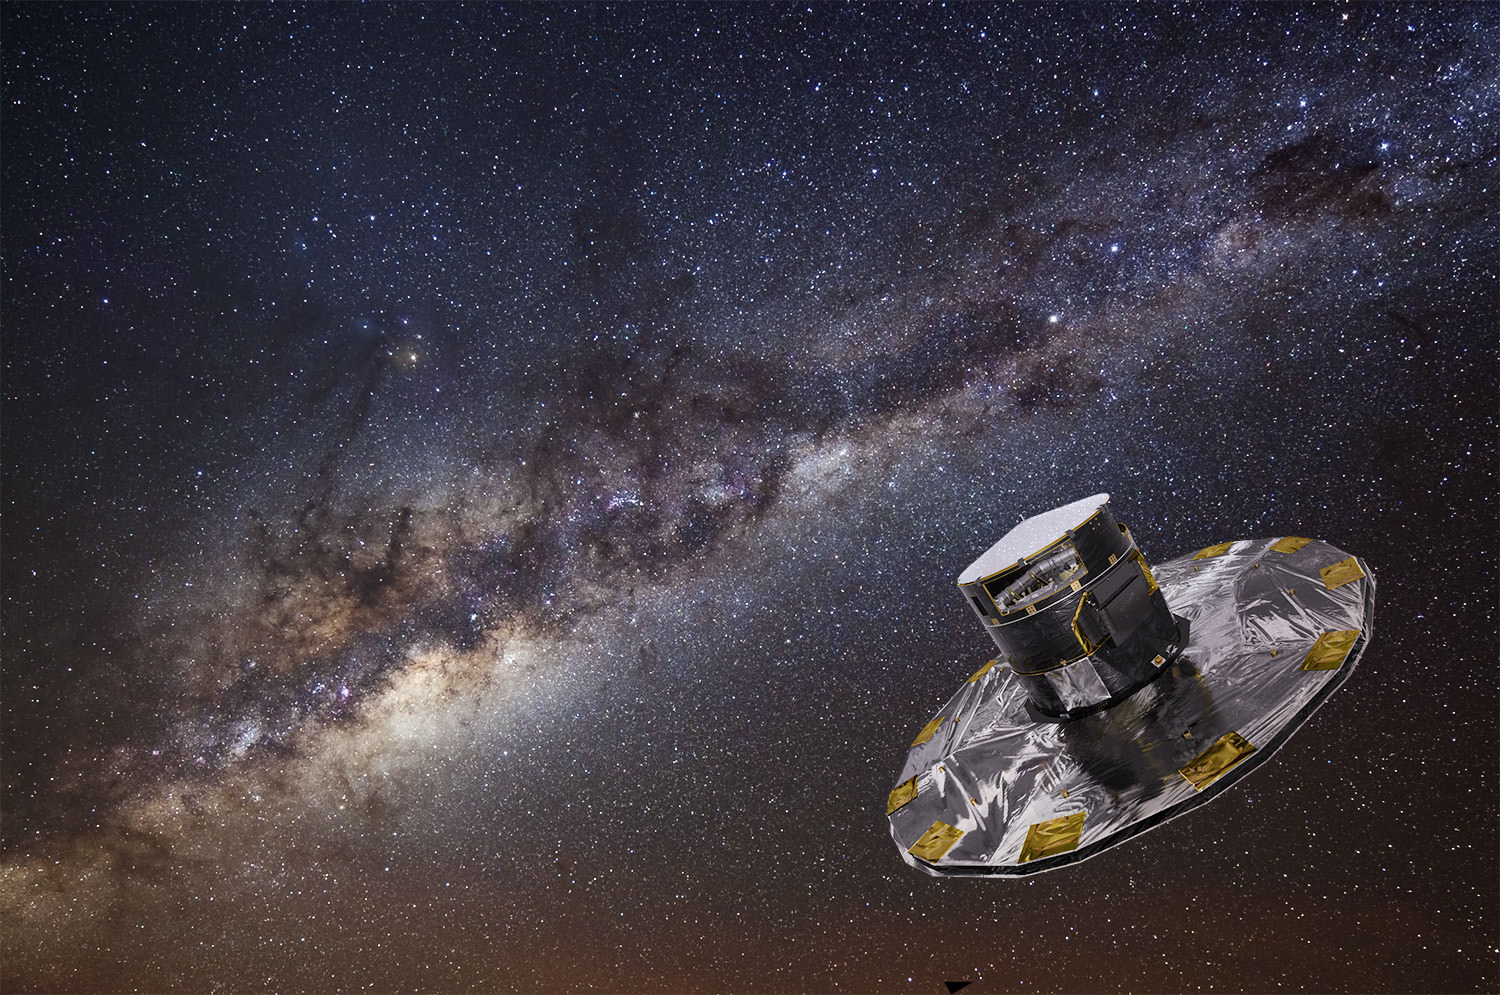
ESA’s Gaia is currently on a five-year mission to map the stars of the Milky Way. Image credit: ESA/ATG medialab; background: ESO/S. Brunier.
As Stefano Casertano, of the Space Telescope Science Institute and a member of the SHOES team, added:
“Hubble is really amazing as a general-purpose observatory, but Gaia is the new gold standard for calibrating distance. It is purpose-built for measuring parallax—this is what it was designed to do. Gaia brings a new ability to recalibrate all past distance measures, and it seems to confirm our previous work. We get the same answer for the Hubble constant if we replace all previous calibrations of the distance ladder with just the Gaia parallaxes. It’s a crosscheck between two very powerful and precise observatories.”
Looking to the future, Riess and his team hope to continue to work with Gaia so they can reduce the uncertainty associated with the value of the Hubble Constant to just 1% by the early 2020s. In the meantime, the discrepancy between modern rates of expansion and those based on the CMB will continue to be a puzzle to astronomers.
In the end, this may be an indication that other physics are at work in our Universe, that dark matter interacts with normal matter in a way that is different than what scientists suspect, or that dark energy could be even more exotic than previously thought. Whatever the cause, it is clear the Universe still has some surprises in store for us!
Using information from Gaia's second data release, a team of scientists have made refined estimates of the Milky Way's mass. Credit: ESA/Gaia/DPAC
In 2013, the European Space Agency (ESA) deployed the Gaia mission, a space observatory designed to measure the positions of movements of celestial bodies. For the past four years, Gaia has been studying distant stars, planets, comets, asteroids, quasars and other astronomical objects, and the data it has acquired will be used to construct the largest and most precise 3D space catalog ever made, totaling 1 billion objects.
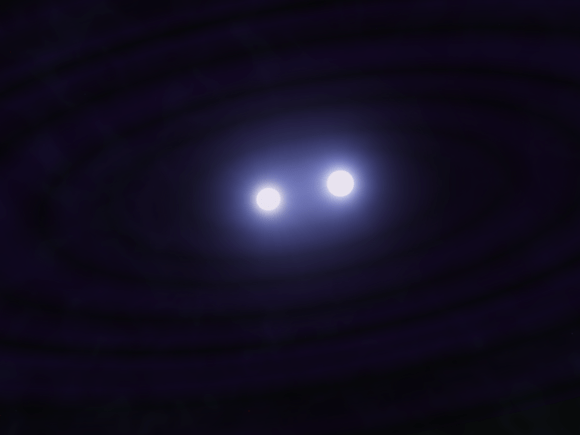
The second release of Gaia data, which took place on April 25th, 2018, has already resulted in a number of impressive discoveries. The latest was made by an international team of scientists who identified 13,928 white dwarfs within 100 parsecs (326 light-years) of the Sun, many of which were formed through mergers. This is the first time that white dwarf stars have been directly detected within the Solar neighborhood.
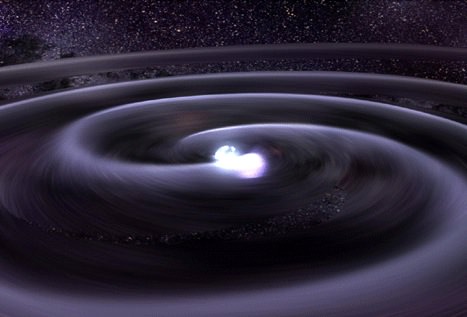
Artist impression of colliding white dwarfs. Credit: CfA
Basically, white dwarfs are what become of the majority of stars (with masses less than 8 Solar masses) once they exit the main sequence phase of their lives. This consists of a star exhausting its hydrogen fuel and expanding to several times its size (entering its Red Giant Branch Phase). These stars then blow off their external layers (a supernova) and leaving behind a white dwarf remnant.
By studying them, astronomers can learn far more about the life cycle of stars and how they evolve. As Dr. Kilic explained to Universe Today via email:
“[W]e’re basically doing Galactic archaeology when we study nearby white dwarfs. They tell us about the ages and star formation histories of the Galactic disk and halo. More importantly, white dwarfs explode as a Type Ia supernova when they reach 1.4 times the mass of the Sun. We use these supernovae to study the shape of the Universe and conclude that the expansion of the universe is accelerating. However, we have not yet found the progenitor systems of these supernovae. One of the channels to form Type Ia supernovae is through mergers of white dwarfs. Hence, the direct detection of merged white dwarfs is important for understanding the frequency of these white dwarf mergers.”
However, until recently only a few hundred white stars have been found within the local galactic neighborhood (500 within a 40 parsec radius). In addition, astronomers were only able to obtain accurate parallax (distance) measurements for about half of these. But thanks to the Gaia data, the number of white dwarfs systems that astronomers are able to study has increased exponentially.
Artist’s impression of a white dwarf star in orbit around Sirius (a white supergiant). Credit: NASA, ESA and G. Bacon (STScI)
“Gaia provided distance measurements,” said Kilic. “We can now create complete samples of white dwarfs within a given volume. For example, prior to Gaia, we only knew about 100 white dwarfs within 20 parsecs of the Sun. With Gaia Data Release 2, we identified more than 13,000 white dwarfs within 100 parsecs of the Sun. The difference in numbers is amazing!”
The Gaia data was also helpful in determining the nature of these white dwarf systems and how they formed. As they indicate in their study, previous research has shown that the majority of white dwarf stars in our local galaxy (roughly 56%) are the product of single-star evolution, whereas 7 to 23% were the product of mergers between binaries. The remainder were white dwarf binaries, or binaries with one white dwarf and a main sequence star.
Using the Gaia data – which included the color and distribution data of thousands of white dwarf stars within ~326 light-years of the Sun – the team was able to determine how massive these stars are. This, in turn, provided vital clues as to how they formed, which indicated that mergers were far more common than previous studies suggested. As Kilic explained:
“Massive white dwarfs tend to be smaller, which means that they are also fainter (since they have a smaller surface area). Since Gaia gave us a complete sample of white dwarfs within 100 parsecs of the Sun, for the first time, we were able to derive the magnitude distribution (hence the mass distribution) of thousands of white dwarfs and find a large fraction of massive white dwarfs. We see that the number of massive white dwarfs is significantly higher than expected from single star evolution. Therefore, we concluded that many of these massive white dwarfs actually formed through mergers in previously binary systems.”
Artist’s impression of white dwarf binary pair CSS 41177. Credit: Andrew Taylor.
From this, the team was able to assemble the first reliable Hertzsprung-Russell Diagram for nearby field white dwarf stars, as well as estimates on how often white dwarf binaries merge. As Kilic indicated, this could have significant implications for other areas of astronomical study.
“Based on the frequency of these single white dwarfs that formed through mergers, we can estimate how many white dwarf mergers occur on average and with what mass distribution,” he said. “We can then infer the rate of Type Ia supernovae from these mergers and see if it’s enough to explain part or all of the Ia supernova explosions. This is an ongoing area of research and I’m sure we will some results on these very soon.”
These findings are yet another gem to come from the second Gaia data release, which has proven to be a treasure trove for astronomers. The third release of Gaia data is scheduled to take place in late 2020, with the final catalog being published in the 2020s. Meanwhile, an extension has already been approved for the Gaia mission, which will now remain in operation until the end of 2020 (to be confirmed at the end of this year).
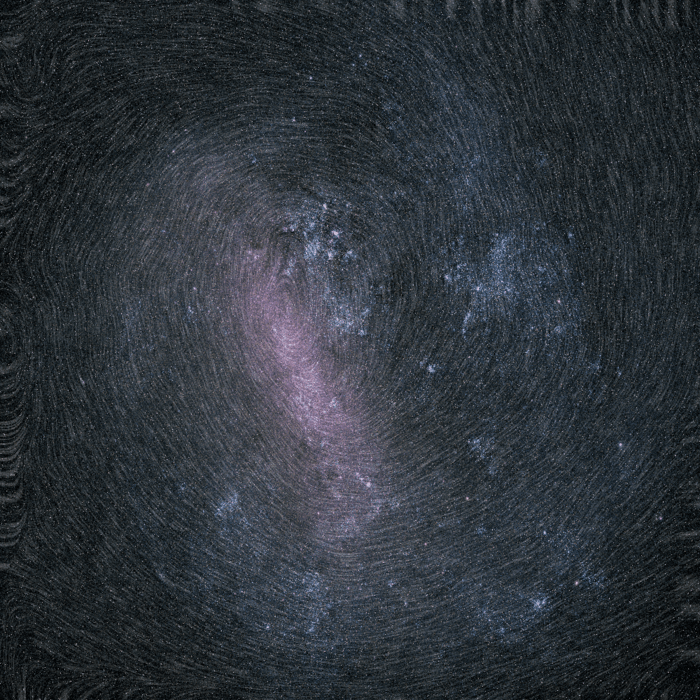
Rotation of the Large Magellanic Cloud, as revealed by the ESA's Gaia spacecraft. Copyright: ESA/Gaia/DPAC
On December 19th, 2013, the European Space Agency’s (ESA) Gaia spacecraft took to space with for a very ambitious mission. Over the course of its planned 5-year mission (which was recently extended), this space observatory would map over a billion stars, planets, comets, asteroids and quasars in order to create the largest and most precise 3D catalog of the Milky Way ever created.
Since that time, the ESA has made two data releases that cover the first three years of the Gaia mission. The second data release, which took on April 25th, 2018, has already proven to be a treasure trove for astronomers. In addition to the positions, distance indicators and motions of over a billion stars and celestial objects in the Milky Way Galaxy, it also contained a hidden gem – the proper motions of stars within the Large Magellanic Cloud (LMC).
Located about 200,000 light-years from Earth, the LMC has dense clouds of dust that results in it experiencing high rates of star formation. In addition, it’s central bar is warped (where the east and west ends are nearer to the Milky Way), suggesting that it was once a barred dwarf spiral galaxy who’s spiral arms were disrupted by interaction with the Small Magellanic Cloud (SMC) and the Milky Way.
The proper motions of the stars in the LMC, as captured by the Gaia spacecraft (without color). Copyright: ESA/Gaia/DPAC
For these reasons, astronomers have been hoping to derive the orbits of dwarf galaxies (and globular clusters) that revolve around the Milky Way. In so doing, they hope to learn more about how our galaxy evolved due to mergers with clusters and other galaxies. By determining the proper motions of the LMC’s stars, the Gaia mission has provided clues as to how the Milky Way and its largest satellite galaxy have interacted over time.
As you can see from the image (at top), the bar of the LMC is outlined in great detail, along with individual star-forming regions like the Tarantula Nebula (aka. 30 Doradus, which is visible just above the center of the galaxy). The image combines the total amount of radiation detected by the observatory in each pixel. The radiation measurements were then taken through different filters on the spacecraft to generate color information.
This allowed Gaia to obtain information about the total density of stars within the LMC as well as their proper motions. As you can see, the image is dominated by the brightest, most massive stars, which greatly outshine their fainter, lower-mass counterparts. The proper motions of the stars observed is represented as the texture of the image – which looks a lot like a fingerprint.
The Large Magellanic Cloud (LMC), one of the nearest galaxies to our Milky Way, as viewed by ESA’s Gaia satellite using information from the mission’s second data release. Copyright ESA/Gaia/DPAC
From this, scientists were able to see an imprint of the stars rotating clockwise around the center of the galaxy. Using this information, astronomers will be able to create new models on how the LMC, SMC, and Milky Way evolved together over time. This, in turn, could shed light on how galaxies like our own, formed and evolved over the course of billions of years.
As with other information contained in the first and second data releases, this latest discovery demonstrates that the Gaia mission is fulfilling its intended purpose. The third release of Gaia data is scheduled to take place in late 2020, with the final catalog being published in the 2020s. Meanwhile, an extension has already been approved for the Gaia mission, which will now remain in operation until the end of 2020 (to be confirmed at the end of this year).
And be sure to enjoy this animated view of the LMC’s rotation, courtesy of the ESA:
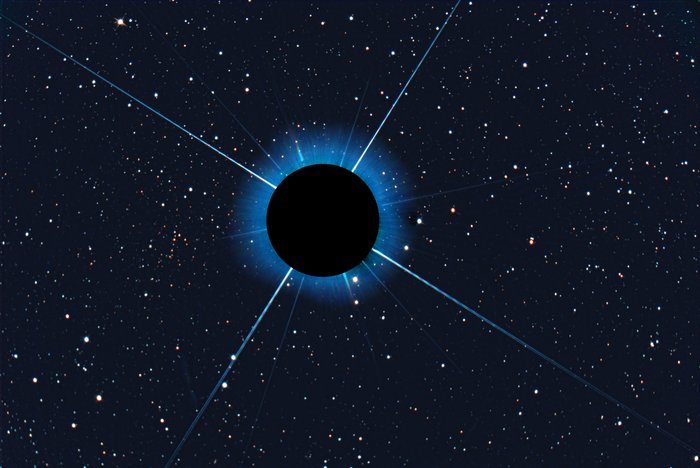
Obscured Sirius reveals Gaia 1 cluster.
Credit and Copyright: H. Kaiser/ESA
In December of 2013, the European Space Agency’s Gaia mission took to space. Since that time, this space observatory has been studying a billion astronomical objects – including stars, planets, comets, asteroids and galaxies – for the sake of creating the most precise 3D space catalog ever made. By the time the mission wraps up (later this year, barring extensions), it is expected to reveal some truly amazing things about our Universe.
In fact, with the first release of its data, the Gaia probe revealed something that has gone completely unnoticed until now. While viewing Sirius, the brightest star in the night sky, Gaia revealed a stellar cluster that had previously been obscured by Sirius’ bright light. This cluster – now known as the Gaia 1 Cluster – is now available to the public thanks to a picture that was taken by an amateur astronomer from Germany.
Given its brightness and the fact that it is visible from just about anywhere on the planet, Sirius has been known since antiquity, and was featured prominently in the astrological and astronomical traditions of many cultures. To the ancient Egyptians, the star was used to keep track of time and agriculture, since its return to the sky was linked to the annual flooding of the Nile.
Artist’s impression of a white dwarf star in orbit around Sirius (a main sequence white dwarf). Credit: NASA, ESA and G. Bacon (STScI)
In Ancient Greek mythology, Sirius represented the eye of the Canis Major constellation. Along with Canis Minor, it formed the Great Dog that diligently followed Orion, the Hunter. In Chinese astronomy, the star is known as the star of the “celestial wolf” and lies in the Mansion of Jing. And when Ptolemy created his influential astronomical tract in the 3rd century CE (the Almagest), he used Sirius as the location for the globe’s central meridian.
By the mid-19th century, astronomers determined that Sirius is actually a binary star system. Essentially, the star system consists of a main sequence white dwarf that is roughly two Solar masses and a white dwarf that is slightly more massive than our Sun. Sirius’ bright appearance means that astronomers have had plenty of light to study the star’s properties, but also causes it to outshine other celestial objects in its vicinity.
However, in the course of counting the stars around Sirius, Gaia’s sophisticated instruments managed to detect the Gaia 1 Cluster for the first time. News of both this cluster and another newly-discovered one (the Gaia 2 Cluster) became public after the first release of Gaia data, which took place in September 2016. News of this discovery sent ripples through the astronomical community and has led to much research into this cluster and its companion.
News of the discovery also prompted attempts to visually capture the cluster. Roughly a year ago, Harald Kaiser – an amateur astronomer from Karlsruhe, Germany – attended a public talk about the Gaia mission, where he learned about the Gaia 1 Cluster being spotted near Sirius. Kaiser then eagerly waited for the next clear night so he could find the cluster himself using his 30 cm telescope.
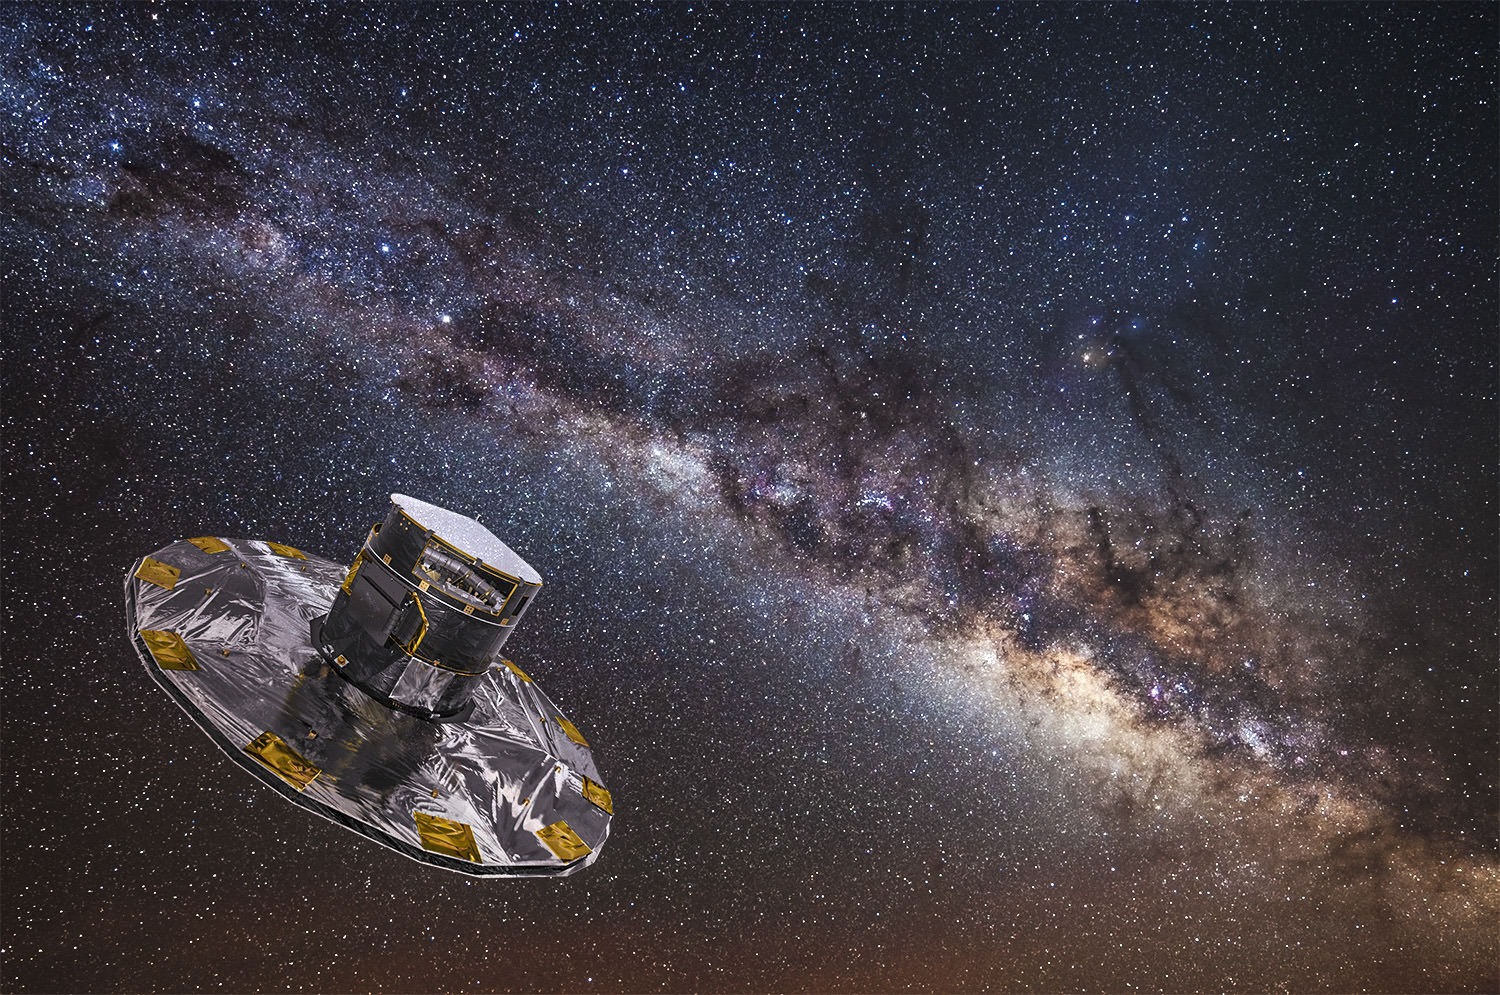
The ESA’s Gaia mission is currently on a five-year mission to map the stars of the Milky Way. Credit: ESA/ATG medialab; background: ESO/S. Brunier.
After snapping a picture of Sirius and correcting for its bright glare, he was able to capture some of the brightest stars in the cluster. As you can see from the image he took (at top), the cluster lies slightly to the left of Sirius and shows a smattering of some of its largest and brightest stars. In addition to revealing the location of this cluster, Kaiser’s efforts are also part of a larger effort to capitalize on the Gaia mission’s progress.
According to a study released in February of last year – led by Sergey Kopsov of Carnegie Melon University – Gaia 1 is a particularly massive cluster. In essence, it weighs in at an impressive 22,000 Solar Masses, is about 29 light-years (9 parsecs) in diameter, and is located 15,000 light years (4.6 kiloparsecs) from Earth. In addition to its size and the fact that it was previously undiscovered, it’s proximity also makes it an opportune target for future research.
The announcement of this cluster has also caused a fair degree of excitement in the scientific community since it validates the capabilities of Gaia and serves as an example of the kinds of things it is expected to reveal. Astronomers are now looking forward to Gaia’s second data release (planned for April 25th) which is expected to provide even more possibilities for new and exciting discoveries.
And be sure to check out this video about the Gaia mission, courtesy of the ESA:
Color view of M31 (The Andromeda Galaxy), with M32 (a satellite galaxy) shown to the lower left. Credit and copyright: Terry Hancock.
The European Space Agency’s (ESA) Gaia mission is an ambitious project. Having launched in December of 2013, the purpose of this space observatory has been to measure the position and distances of 1 billion objects – including stars, extra-solar planets, comets, asteroids and even quasars. From this, astronomers hope to create the most detailed 3D space catalog of the cosmos ever made.
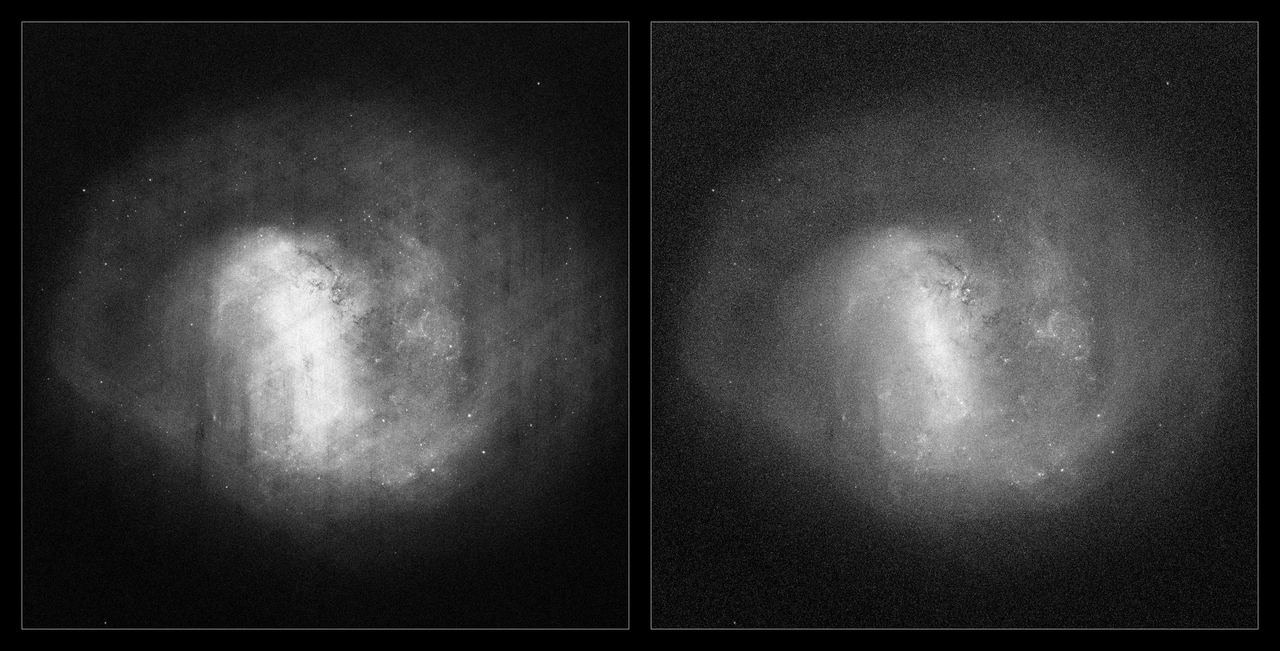
Back in 2016, the first batch of Gaia data (based on its first 14 months in space) was released. Since then, scientists have been poring over the raw data to obtain clearer images of the neighboring stars and galaxies that were studied by the mission. The latest images to be released, based on Gaia data, included revealing pictures of the Large Magellanic Cloud (LMC), the Andromeda galaxy, and the Triangulum galaxy.
The first catalog of Gaia data consisted of information on 1.142 billion stars, including their precise position in the night sky and their respective brightness. Most of these stars are located in the Milky Way, but a good fraction were from galaxies beyond ours, which included about ten million belonging to the LMC. This satellite galaxy, located about 166 000 light-years away, has about 1/100th the mass of the Milky Way.
Gaia’s view of the Large Magellanic Cloud. Click here for further details, full credits, and larger versions of the image. Credit: ESA/Gaia/DPAC
The two images shown above display composite data obtained by the Gaia probe. The image on the left, which was compiled by mapping the total density of stars detected by Gaia, shows the large-scale distribution of stars in the LMC. This image also delineates the extent of the LMC’s spiral arms, and is peppered with bright dots that represent faint clusters of stars.
The image on the right, on the other hand, reveals other aspects of the LMC and its stars. This image was created by mapping radiation flux in the LMC and is dominated by the brightest and most massive stars. This allows the bar of the LMC to be more clearly defined and also shows individual regions of star-formation – like 30 Doradus, which is visible just above the center of the galaxy in the picture.
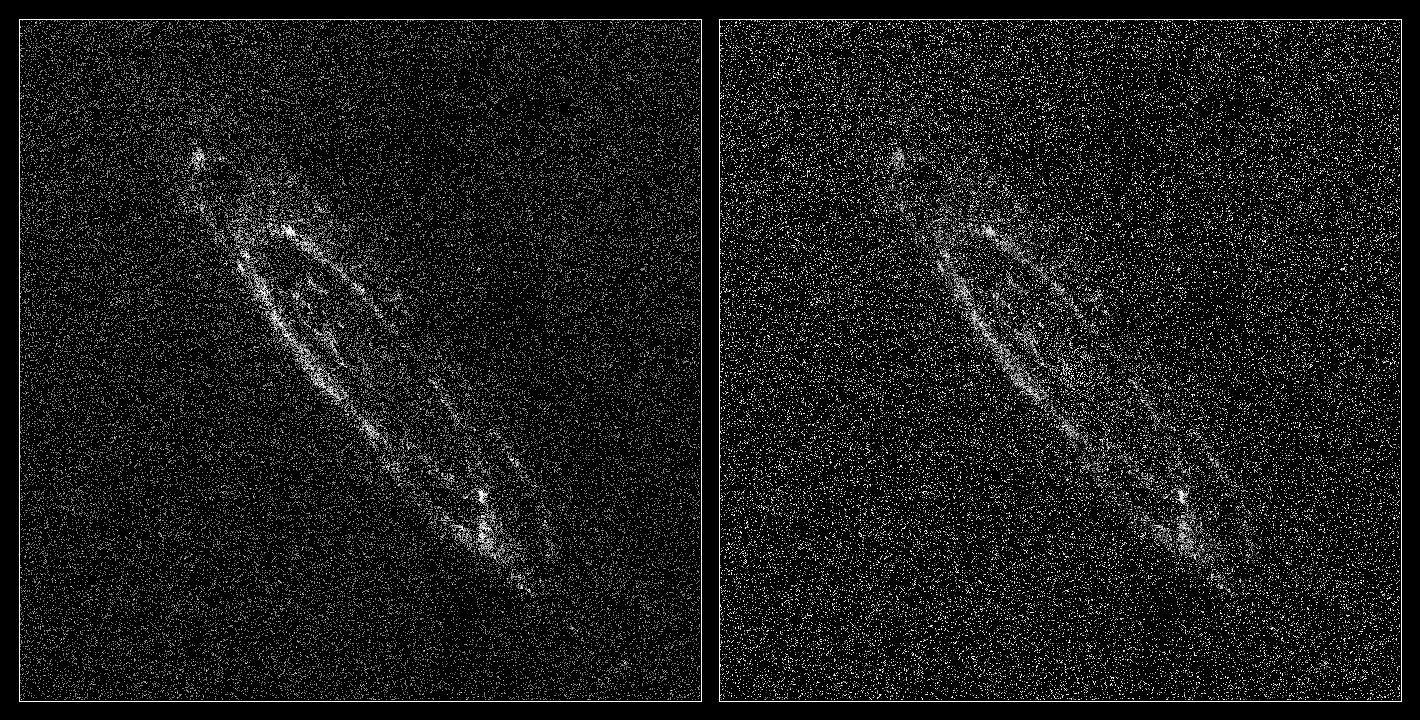
The next set of images (shown below), which were also obtained using data from the first 14 months of the Gaia mission, depict two nearby spiral galaxies – the Andromeda galaxy (M31) and its neighbor, the Triangulum galaxy (M33). The Andromeda galaxy, located 2.5 million light-years away, is the largest galaxy in our vicinity and slightly more massive than our own. It is also destined to merge with the Milky Way in roughly 4 billion years.
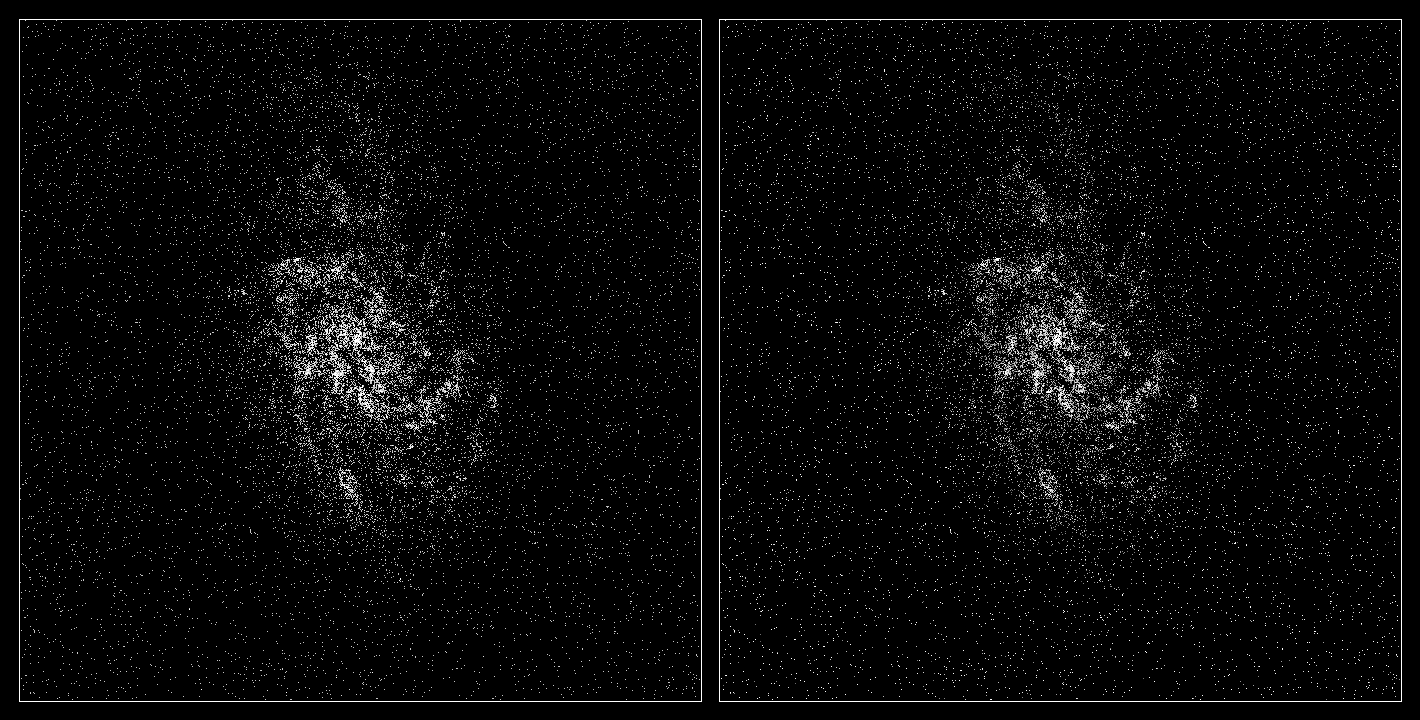
The Triangulum galaxy, meanwhile, is a fraction the size of the Milky Way (with an estimated fifty billion stars) and is located slightly farther from us than Andromeda – about 2.8 million light-years distant. As with the LMC images, the images on the left are based on the total density of stars and show stars of all types, while images on the right are based on the radiation flux of each galaxy and mainly show the bright end of the stellar population.
Gaia’s view of the Andromeda galaxy. Credit: ESA/Gaia/DPAC
Another benefit of the images on the right is that they indicate the regions where the most intense star formation is taking place. For many years, astronomers have known that the LMC boasts a significant amount of star-forming activity, forming stars at five times the rate of the Milky Way Galaxy. Andromeda, meanwhile, has reached a point of near-inactivity in the past 2 billion years when it comes to star formation.
In comparison, the Triangulum Galaxy still shows signs of star formation, at a rate that is about four and a half times that of Andromeda. Thanks to the Gaia images, which indicate the relative rates of star formation from elevated levels of radiation flux and brightness, these differences between Andromeda, Triangulum and the LMC is illustrated quite beautifully.
What’s more, by analyzing the motions of individual stars in external galaxies like the LMC, Andromeda, or Triangulum, it will be possible to learn more about the overall rotation of stars within these galaxies. It will also be possible to determine the orbits of the galaxies themselves, which are all part of the larger structure known as the Local Group.
This region of space, which the Milky Way is part of, measures roughly 10 million light-years across and has an estimated 1.29 billion Solar masses. This, in turn, is just one of several collections of galaxies in the even larger Virgo Supercluster. Measuring how stars and galaxies orbit about these larger structures is key to determining cosmic evolution, how the Universe came to be as it is today and where it is heading.
The Triangulum galaxy (M33), based on data compiled by the Gaia mission. Credit: ESA/Gaia/DPAC
An international team of astronomers recently attempted to do just that using the CosmicFlows surveys. These studies, which were conducted between 2011 and 2016, calculated the distance and speed of neighboring galaxies. By pairing this data with other distance estimates and data on the galaxies gravity fields, they were able to chart the motions of almost 1,400 galaxies within 100 million light years over the course of the past 13 billion years.
In the case of the LMC, another team of astronomers recently attempted to measure its orbit using a subset of data from the first Gaia release – the Tycho–Gaia Astrometric Solution (TGAS). Combined with additional parallax and proper motion data from the Hipparcos mission, the team was able to identify 29 stars in the LMC and measure their proper motion, which they then used to estimate the rotation of the galaxy.
Gaia’s observations of the LMC and the Small Magellanic Cloud (SMC) are also important when it comes to studying Cepheid and RR Lyrae variables. For years, astronomers have indicated that these stars could be used as indicators of cosmic distances for galaxies beyond our own. In addition, astronomers working at the Gaia Data Processing and Analysis Consortium (DPAC) tested this method on hundreds of LMC variable stars in order to validate data from the first release.
Astronomers are eagerly awaiting the second release of Gaia data, which is scheduled for April of 2018. This will also contain measurements on stellar distances and their motions across the sky, and is expected to reveal even more about our galaxy and its neighbors. But in the meantime, there are still plenty of revelations to be found from the first release, and scientists expect to be busy with it for many years to come.
Gaia mapping the stars of the Milky Way. Credit: ESA/ATG medialab; background: ESO/S. Brunier
In 2013, the European Space Agency (ESA) deployed the Gaia mission, a space observatory designed to measure the positions of movements of celestial bodies. For the past four years, Gaia has been studying distant stars, planets, comets, asteroids, quasars and other astronomical objects, and the data it has acquired will be used to construct the largest and most precise 3D space catalog ever made, totaling 1 billion objects.
Using data provided by Gaia, a team of international scientists conducted a study of the recently-discovered star cluster known as Gaia 1. Located about 15,000 light years from Earth and measuring some 29 light years in radius, much about this cluster has remained unknown. As such, this study helped place constraints on a number of mysteries of this star cluster, which include its age, metallicity and origin.
For the sake of their study, which recently appeared in the journal Astronomy and Astrophysics under the title “Detailed Chemical Abundance Analysis of the Thick Disk Star Cluster Gaia 1“, the team conducted a detailed chemical abundance study of Gaia 1 to determine its unknown parameters. From this, accurate estimates on its age and composition are likely to now be possible.
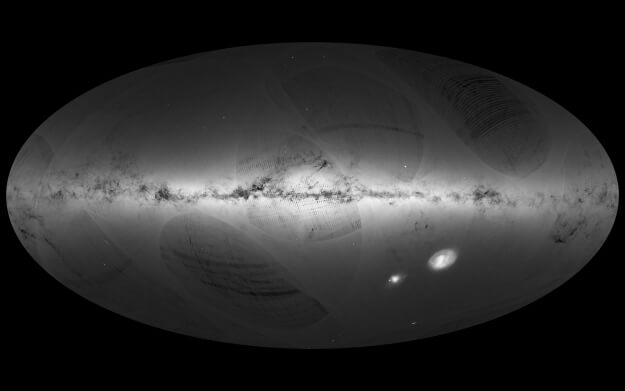
Sky map based on the first release of Gaia data (DR1). Credit: ESA/Gaia/DPAC/A. Moitinho & M. Barros, CENTRA – University of Lisbon.
This combined photometry also indicated that the cluster had a radius of about 29 light years and contained as much as 20,000 Solar Masses. However, further studies found that the cluster was actually far more metal-rich than previously thought. This indicated that Gaia 1 was likely to be significantly younger, with estimates now claiming that it was at least 3 billion years old.
In addition, these subsequent studies also raised the possibility that the cluster was extra-galactic in origin, based on the fact that it orbits about 5,500 light years (~1.7 kpc) above the Milky Way’s disk. To remedy this, the team – led by Andreas Koch of the University of Lancaster and the Center for Astronomy Heidelberg – used Gaia data in order to conduct a detailed study of just how metal-rich the cluster was to get a better idea of its age.
As they stated in their study: “[T]his work focuses on a detailed chemical abundance analysis of four red giant members of Gaia 1, based on high-resolution spectroscopy, which we complement by an investigation of the orbital properties of this transition object.” This consisted of measuring the abundances of 14 elements within these red giant stars, which were selected from the 2MASS survey.
What they determined was that the Gaia 1 was more metal poor than previously expected, which indicated that it is older than the revised age estimates indicated – between 3 billion and 5.3 billion years old. In addition, they also measured the proper motions and orbits of the four target stars, using data obtained from the fifth U.S. Naval Observatory CCD Astrograph Catalog (UCAC5).
This information revealed that in the course of their orbits, the four target stars would reach a maximum distance of 3,262 light years (1.0 kpc) above the galactic disk, which was an indication that they were not extra-galactic in origin. Last, but not least, they indicated that Gaia 1’s structure does not truly conform to that of a globular cluster, as it was originally designated. As they conclude in their study:
“This confirms that Gaia 1 is rather a massive and luminous open cluster than a low-mass globular cluster. Finally, orbital computations of the target stars bolster our chemical findings of Gaia 1’s present-day membership with the thick disk, even though it remains unclear, which mechanisms put it in that place.”
While this study has helped place constraints on one of a newly-discovered Gaia object, the team acknowledges that there is still much to be discovered about this star cluster. They also acknowledge that there is a margin of error when it comes to their study, and that further research is needed before Gaia 1 can be properly classified.
The band of light (the Milky Way) that is visible in the night sky, showing the stellar disk of our galaxy. Credit: Bob King
“However, the hint of a metallicity spread between different studies in the literature may point towards a more complex origin that could involve a once more massive progenitor,” they state. “Thus the question as to its exact formation and origin remains unclear and needs to await more data such as the precise and accurate parallaxes that Gaia can offer.”
This newly-discovered cluster, and all attempts to better understand it, are merely the tip of the iceberg when it comes to what the Gaia mission has revealed so far. The second official release of Gaia data – aka. Gaia DR2 – is scheduled to take place in April of 2018. This will be followed by a third release in 2020 and, barring any mission extensions, a fourth and final release in 2022.
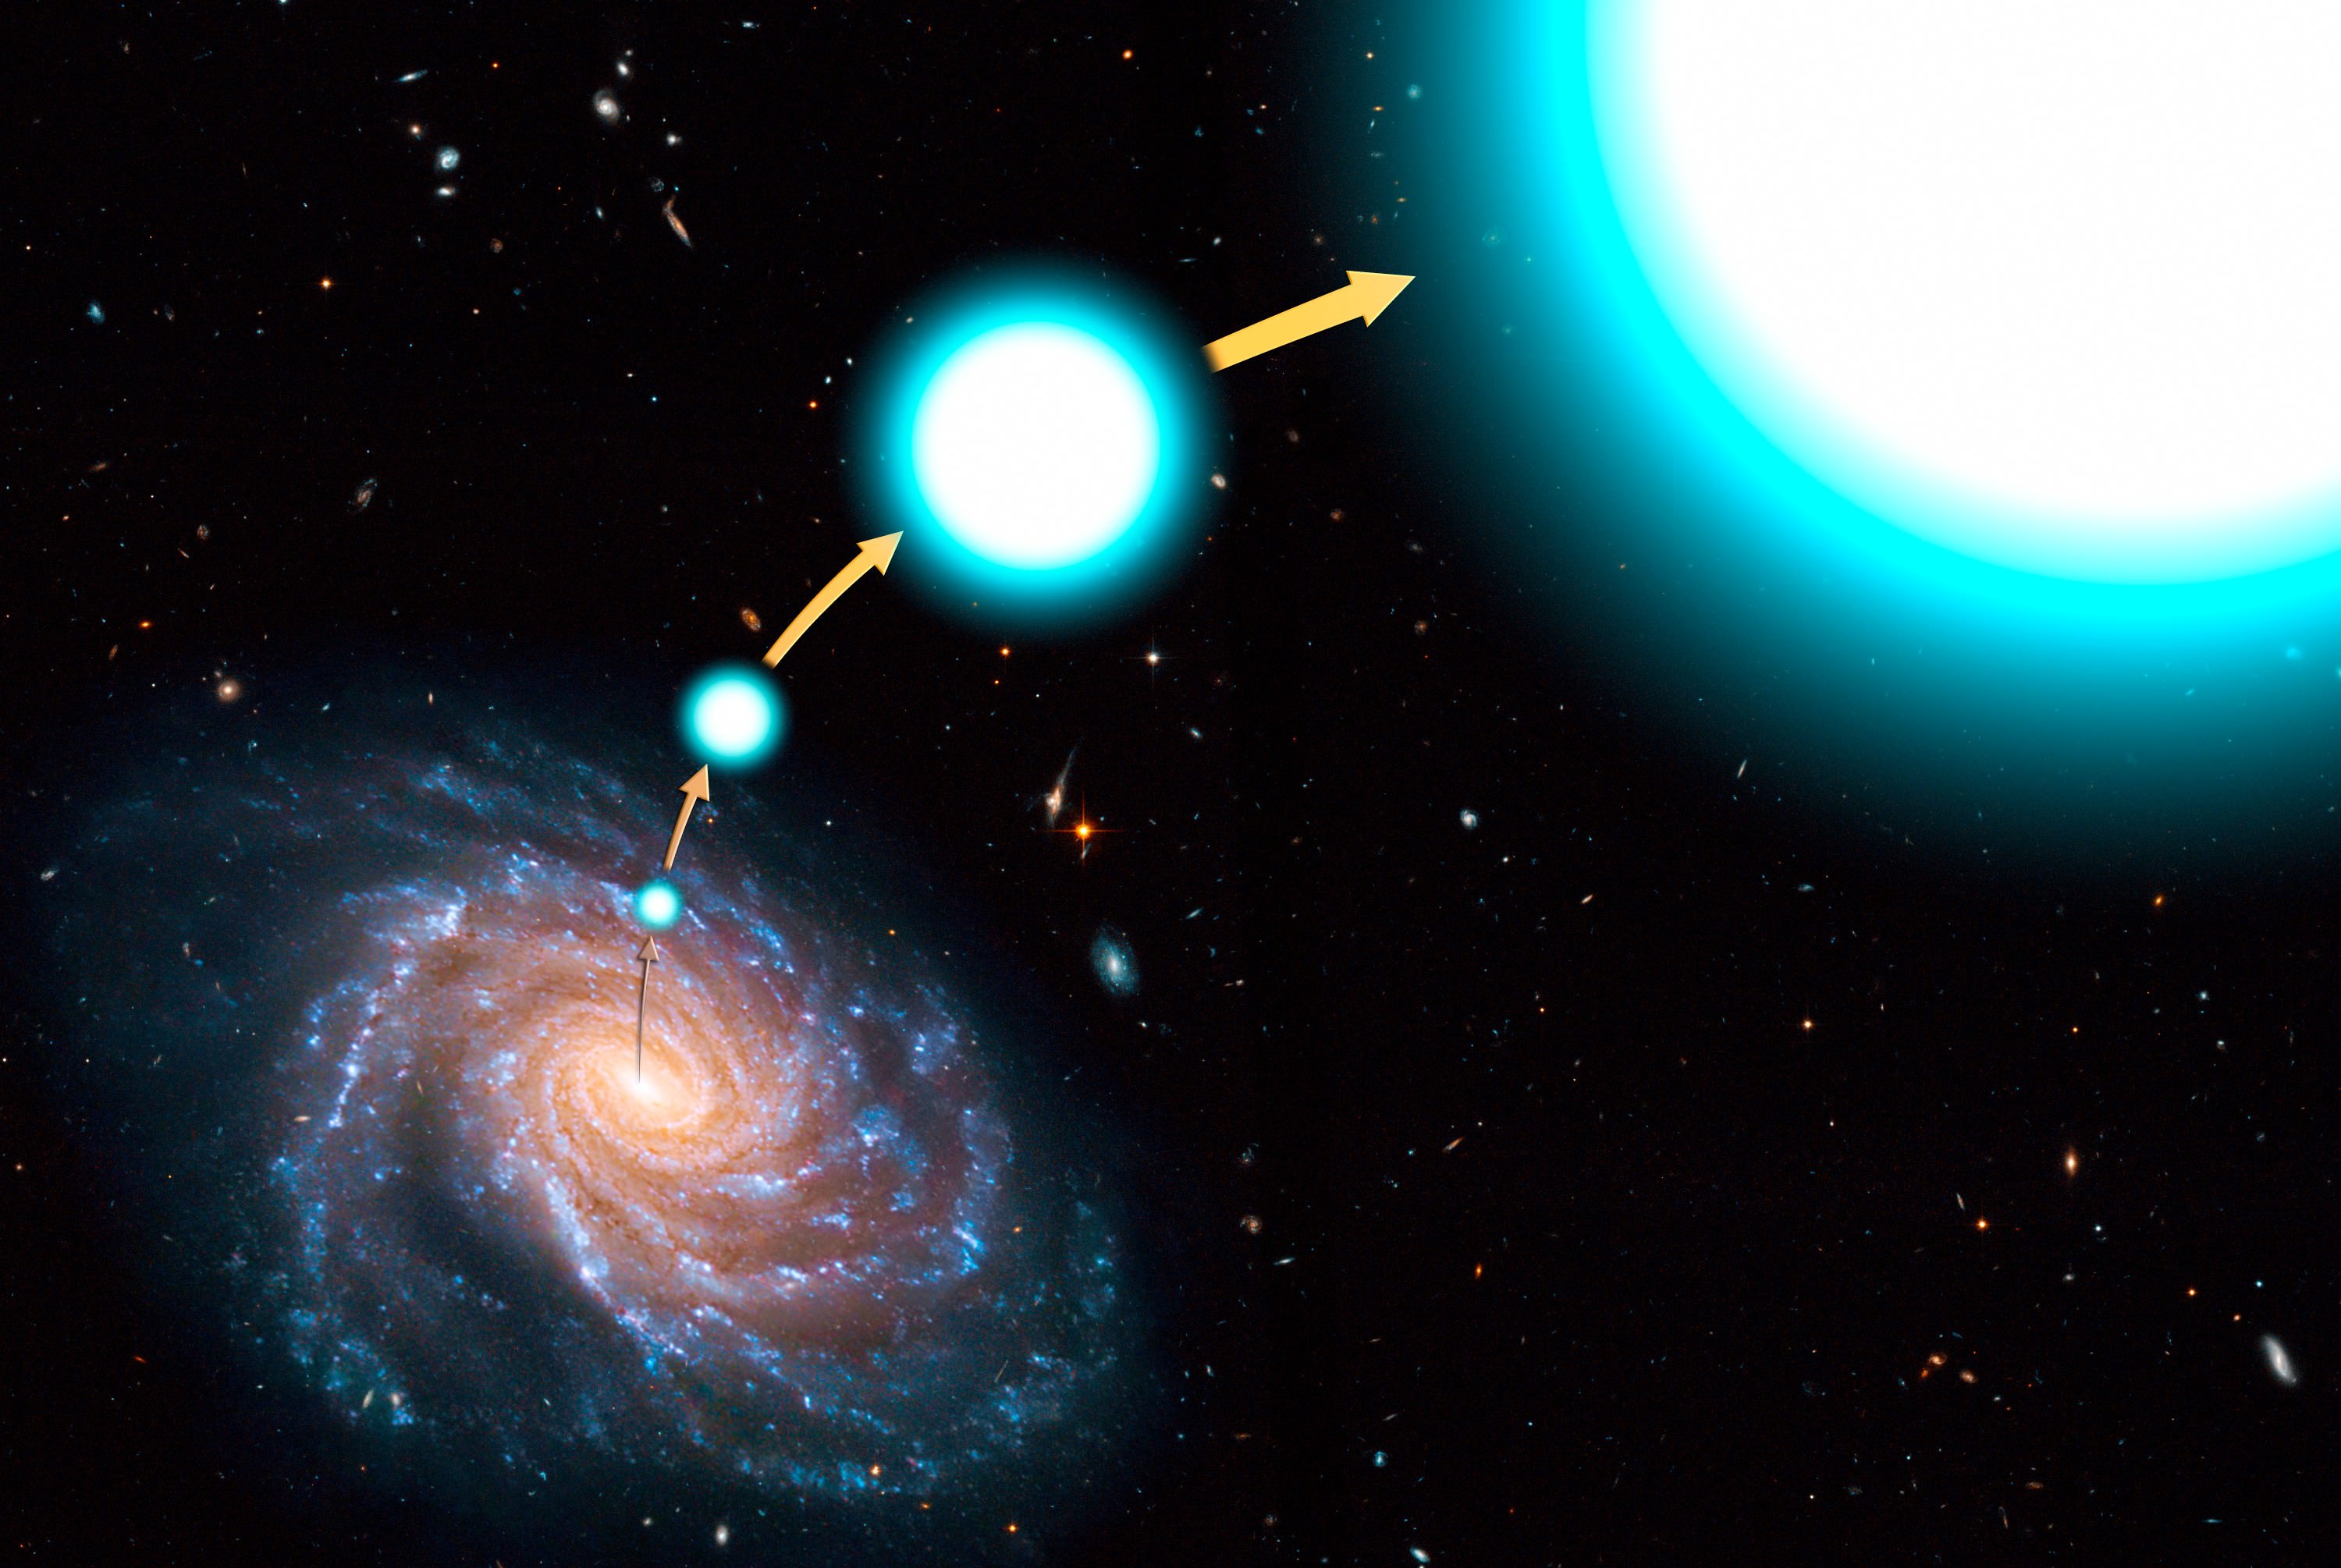
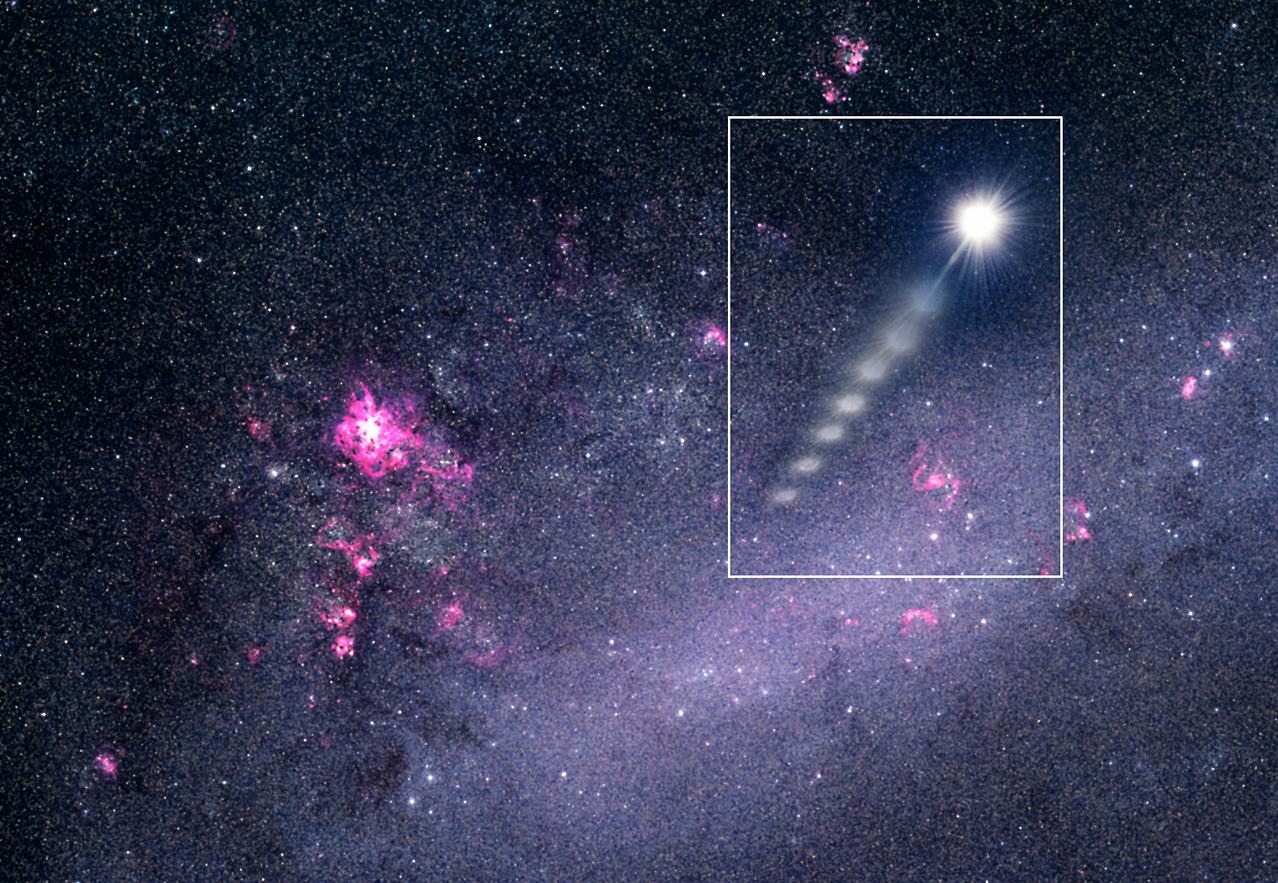
An artist's conception of a hypervelocity star that has escaped the Milky Way. Credit: NASA
Most stars in our galaxy behave predictably, orbiting around the center of the Milky Way at speeds of about 100 km/s (62 mi/s). But some stars achieve velocities that are significantly greater, to the point that they are even able to escape the gravitational pull of the galaxy. These are known as hypervelocity stars (HVS), a rare type of star that is believed to be the result of interactions with a supermassive black hole (SMBH).
The existence of HVS is something that astronomers first theorized in the late 1980s, and only 20 have been identified so far. But thanks to a new study by a team of Chinese astronomers, two new hypervelocity stars have been added to that list. These stars, which have been designated LAMOST-HVS2 and LAMOST-HVS3, travel at speeds of up to 1,000 km/s (620 mi/s) and are thought to have originated in the center of our galaxy.
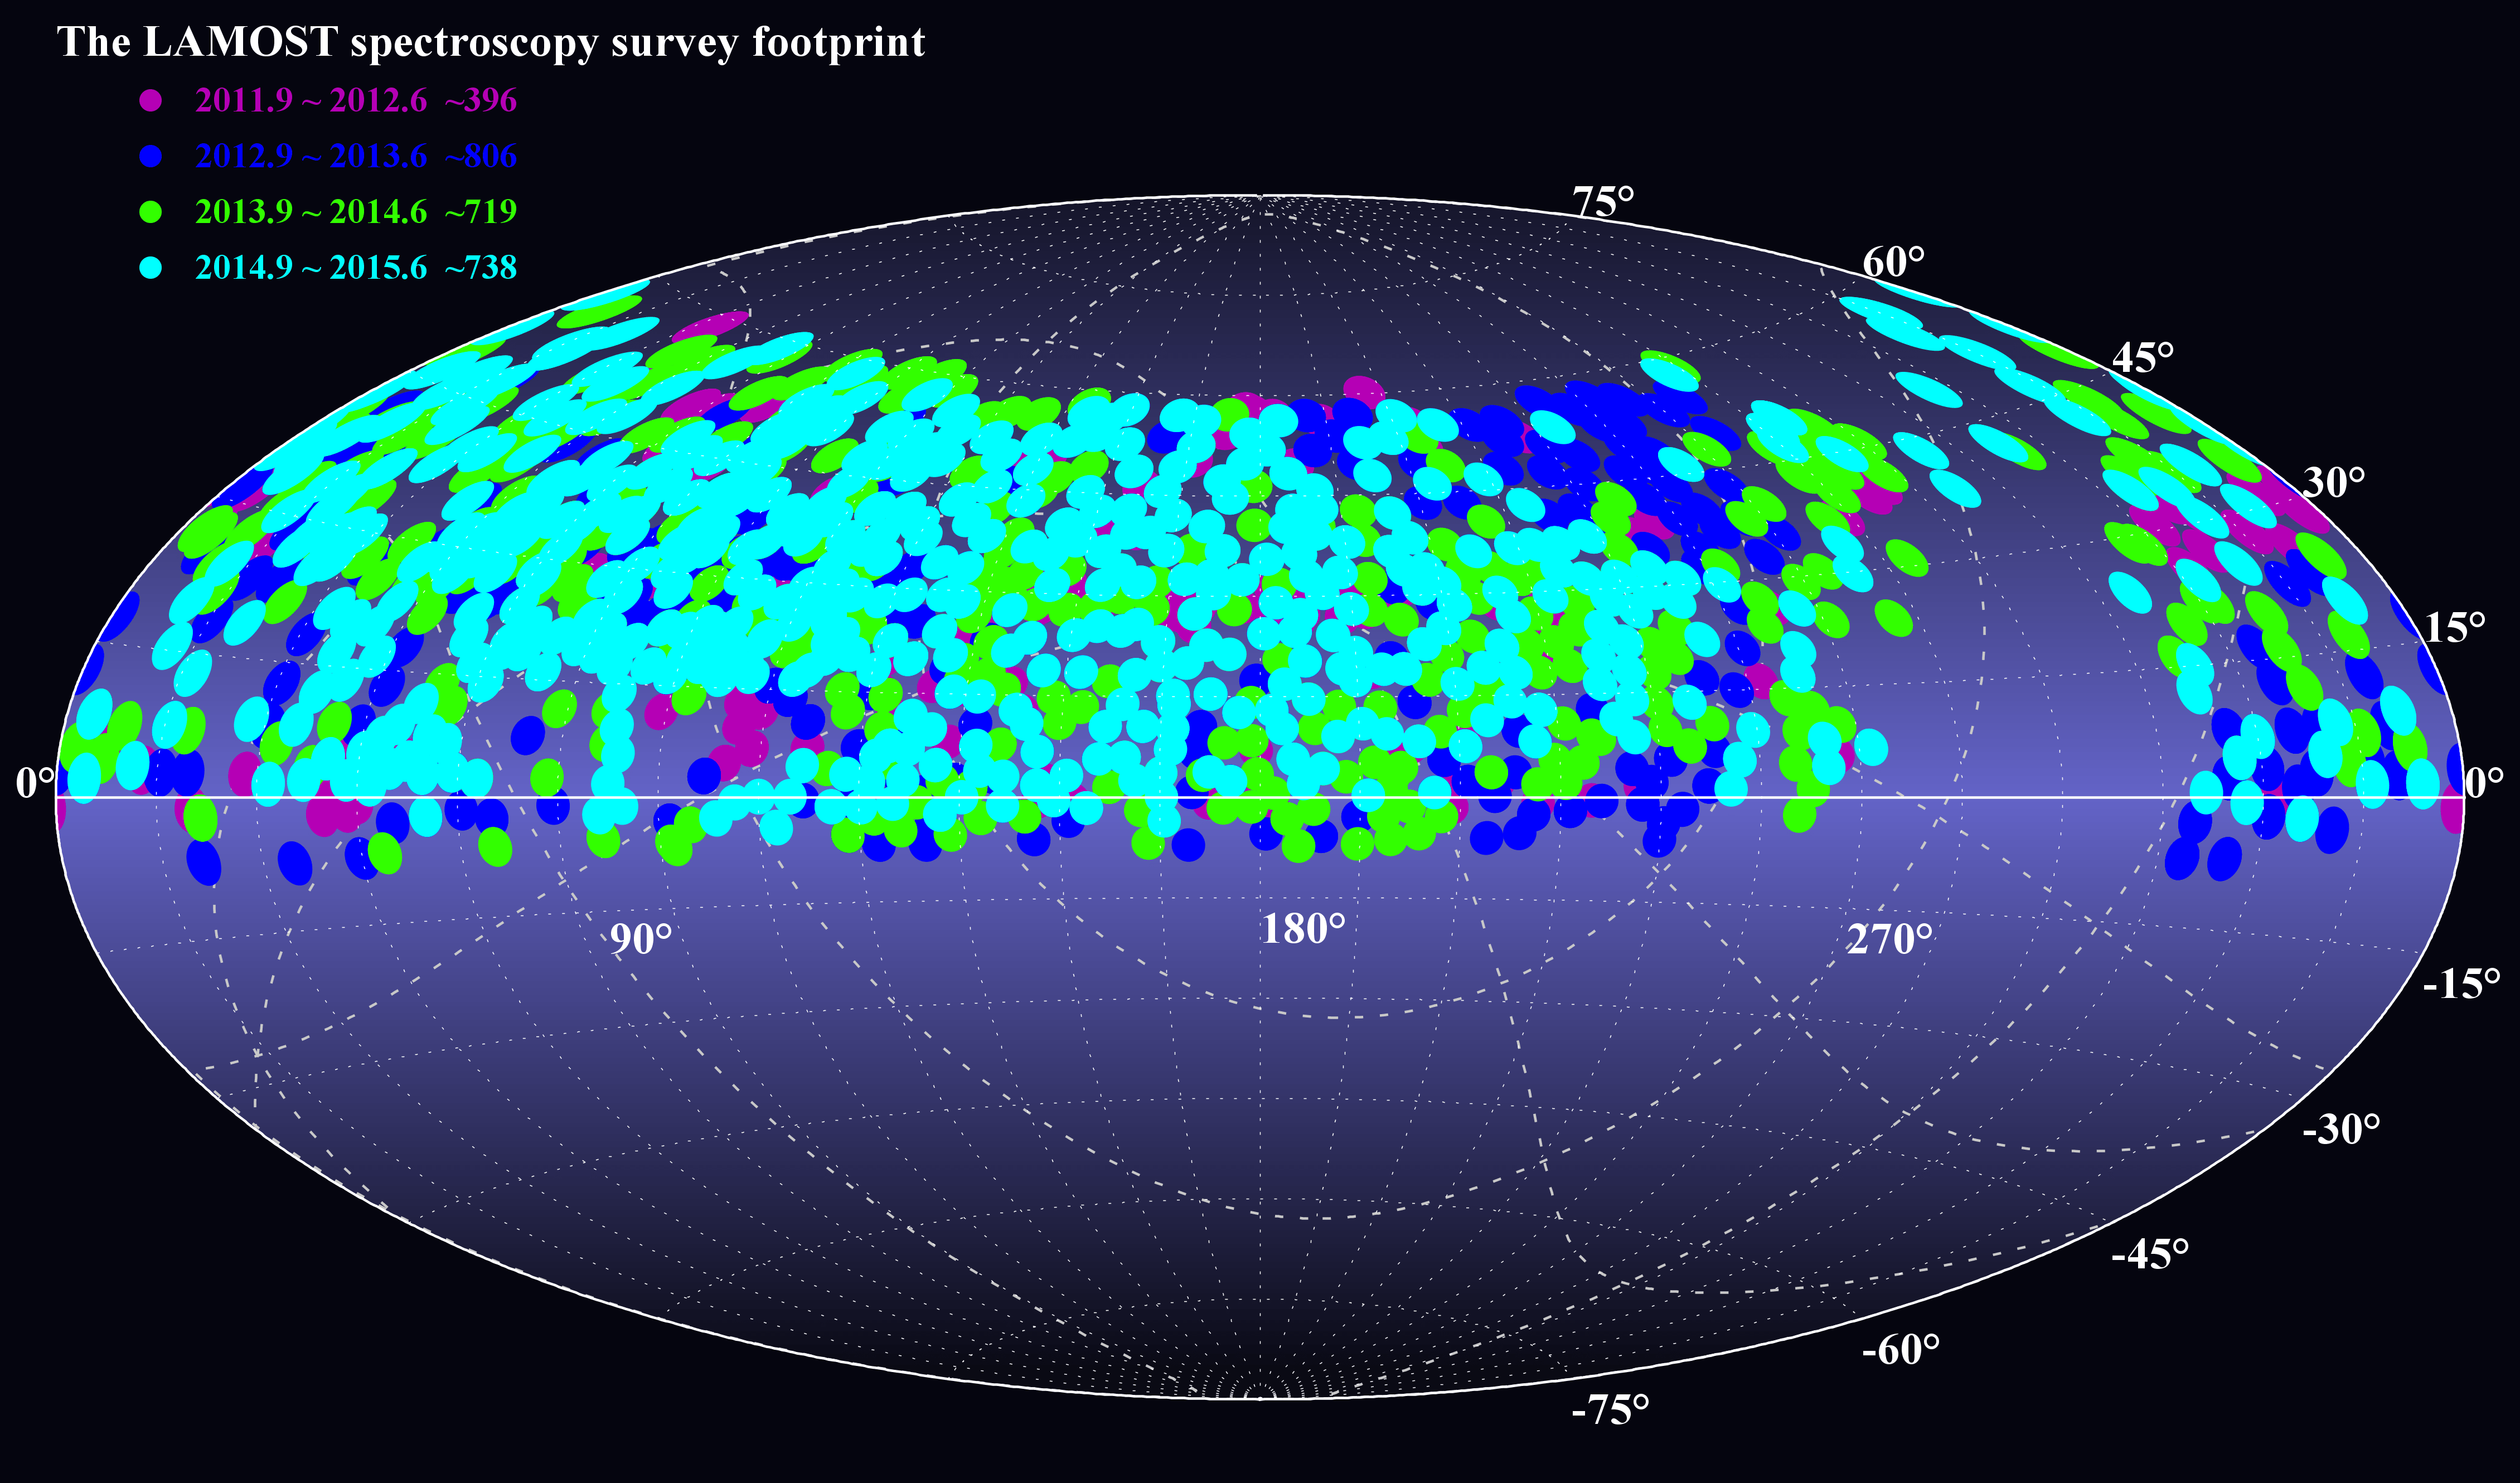
Footprint of the LAMOST pilot survey and the first three years’ general survey. Credit: LAMOST
Astronomers estimates that only 1000 HVS exist within the Milky Way. Given that there are as many as 200 billion stars in our galaxy, that’s just 0.0000005 % of the galactic population. While these stars are thought to originate in the center of our galaxy – supposedly as a result of interaction with our SMBH, Sagittarius A* – they manage to travel pretty far, sometimes even escaping our galaxy altogether.
It is for this very reason that astronomers are so interested in HVS. Given their speed, and the vast distances they can cover, tracking them and creating a database of their movements could provide constraints on the shape of the dark matter halo of our galaxy. Hence why Dr. Huang and his colleagues began sifting through LAMOST data to find evidence of new HVS.
Located in Hebei Province, northwestern China, the LAMOST observatory is operated by the Chinese Academy of Sciences. Over the course of five years, this observatory conducted a spectroscopic survey of 10 million stars in the Milky Way, as well as millions of galaxies. In June of 2017, LAMOST released its third Data Release (DR3), which included spectra obtained during the pilot survey and its first three years’ of regular surveys.
Containing high-quality spectra of 4.66 million stars and the stellar parameters of an additional 3.17 million, DR3 is currently the largest public spectral set and stellar parameter catalogue in the world. Already, LAMOST data had been used to identify one hypervelocity star, a B1IV/V-type (main sequence blue subgiant/subdwarf) star that was 11 Solar Masses, 13490 times as bright as our Sun, and had an effective temperature of 26,000 K (25,727 °C; 46,340 °F).
Artist’s impression of hypervelocity stars (HVSs) speeding through the Galaxy. Credit: ESA
This HVS was designated LAMOST-HSV1, in honor of the observatory. After detecting two new HVSs in the LAMOST data, these stars were designated as LAMOST-HSV2 and LAMOST-HSV3. Interestingly enough, these newly-discovered HVSs are also main sequence blue subdwarfs – or a B2V-type and B7V-type star, respectively.
Whereas HSV2 is 7.3 Solar Masses, is 2399 times as luminous as our Sun, and has an effective temperature of 20,600 K (20,327 °C; 36,620 °F), HSV3 is 3.9 Solar Masses, is 309 times as luminous as the Sun, and has an effective temperature of 14,000 K (24,740 °C; 44,564 °F). The researchers also considered the possible origins of all three HVSs based on their spatial positions and flight times.
In addition to considering that they originated in the center of the Milky Way, they also consider alternate possibilities. As they state in their study:
“The three HVSs are all spatially associated with known young stellar structures near the GC, which supports a GC origin for them. However, two of them, i.e. LAMOST-HVS1 and 2, have life times smaller than their flight times, indicating that they do not have enough time to travel from the GC to the current positions unless they are blue stragglers (as in the case of HVS HE 0437-5439). The third one (LAMOST-HVS3) has a life time larger than its flight time and thus does not have this problem.
In other words, the origins of these stars is still something of a mystery. Beyond the idea that they were sped up by interacting with the SMBH at the center of our galaxy, the team also considered other possibilities that have suggested over the years.
Artist’s impression of the ESA’s Gaia spacecraft, looking into the heart of the Milky Way Galaxy. Credit: ESA/ATG medialab/ESO/S. Brunier
As they state in these study, these “include the tidal debris of an accreted and disrupted dwarf galaxy (Abadi et al. 2009), the surviving companion stars of Type Ia supernova (SNe Ia) explosions (Wang & Han 2009), the result of dynamical interaction between multiple stars (e.g, Gvaramadze et al. 2009), and the runaways ejected from the Large Magellanic Cloud (LMC), assuming that the latter hosts a MBH (Boubert et al. 2016).”
In the future, Huang and his colleagues indicate that their study will benefit from additional information that will be provided by the ESA’s Gaia mission, which they claim will shed additional light on how HVS behave and where they come from. As they state in their conclusions:
“The upcoming accurate proper motion measurements by Gaia should provide a direct constraint on their origins. Finally, we expect more HVSs to be discovered by the ongoing LAMOST spectroscopic surveys and thus to provide further constraint on the nature and ejection mechanisms of HVSs.”
An artist's conception of a hypervelocity star that has escaped the Milky Way. Credit: NASA
In 2013, the European Space Agency launched the Gaia spacecraft. As the successor to the Hipparcos mission, this space observatory has spent the past three and a half years gathering data on the cosmos. Before it retires sometime next year (though the mission could be extended), this information will be used to construct the largest and most precise 3D astronomical map ever created.
In the course of surveying the cosmos, Gaia has also revealed some very interesting things along the way. For example, after examining the Gaia catalog with a specially-designed artificial neural network, a team of European researchers recently detected six new hypervelocity stars in the Milky Way. And one of these stars is moving so fast that it may eventually leave our galaxy.
Artist’s conception of the Gaia telescope backdropped by a photograph of the Milky Way taken at the European Southern Observatory. Credit: ESA/ATG medialab; background: ESO/S. Brunier
Hypervelocity stars are a rare and fascinating thing. Whereas all stars in the Milky Way are in constant motion, orbiting around the center of our galaxy, some are accelerated to speeds of up to hundreds of kilometers per second. In the past, astronomers have deduced that these fast-moving stars are the result of a close stellar encounter or a supernova explosion of a stellar companion.
And a little over a decade ago, astronomers became aware of a new class of high-speed stars that are believed to have been accelerated from past interactions with the supermassive black hole (Sagittarius A*) that sits at the center of our galaxy. These stars are extremely important to the study of the overall structure of the Milky Way, as they are indicative of the kinds of events and forces that have shaped its history.
As Elena Maria Rossi, from Leiden University in the Netherlands and one of the co-authors on the paper, explained in an ESA press release:
“These are stars that have traveled great distances through the Galaxy but can be traced back to its core – an area so dense and obscured by interstellar gas and dust that it is normally very difficult to observe – so they yield crucial information about the gravitational field of the Milky Way from the centre to its outskirts.“
Artist’s impression of stars speeding through the Galaxy. Credit: ESA
Finding such stars is no easy task, mainly because their velocity makes them extremely difficult to spot in the vast and crowded disk of the Milky Way. As a result, scientists have relied on looking for young, massive stars (2.5 to 4 Solar masses) in the old stellar population of the Galactic. Basically, their young age and high masses are indications that they might not have originated there.
Combined with measurements of their past speeds and paths, this method has confirmed the existence of hypervelocity stars in the past. However, only 20 hypervelocity stars have been spotted to date, and they have all been young and massive in nature. Scientists believe that many more stars of other ages and masses are also being accelerated through the Milky Way, but were previously unable to spot them.
To address this, the European team – led by from Tomasso Marchetti of Leiden University in the Netherlands – began considering how to use Gaia‘s vast dataset to optimize the search for more hypervelocity stars. After testing various methods, they adopted the artificial neural net approach – i.e. using a machine learning algorithm – to search through the star census data Gaia is in the process of gathering.
Beginning in the first half of 2016, the team began developing and training this program to be ready for the first release of Gaia data – which occurred a few months later on Sept. 14th, 2016. As Tommaso Marchetti, a PhD student at Leiden University, described the process:
“In the end, we chose to use an artificial neural network, which is software designed to mimic how our brain works. After proper ‘training’, it can learn how to recognize certain objects or patterns in a huge dataset. In our case, we taught it to spot hypervelocity stars in a stellar catalogue like the one compiled with Gaia.”
Artist’s impression of a hypervelocity star that was detected using the ESO’s Very Large Telescope. Credit: ESO
In addition to a map with the positions of over a billion stars, this first data release included a smaller catalogue with the distances and motions for two million stars. This catalog – which is known as the Tycho-Gaia Astrometric Solution (TGAS) – combined data from both the first year of the Gaia mission and with data from the Hipparcos mission, and is essentially a taste of what’s to come from Gaia.
On the day of the catalog’s release, Marchetti and his team ran their algorithm on the two million stars within the TGAS, which revealed some interesting finds. “In just one hour, the artificial brain had already reduced the dataset to some 20 000 potential high-speed stars, reducing its size to about 1%,” said Rossi. “A further selection including only measurements above a certain precision in distance and motion brought this down to 80 candidate stars.”
The team then examined these 80 stars in more detail, and compared the information about their motions to data from other catalogues. Paired with additional observations, they eventually found six stars which appeared to be moving faster than 360 km/s. One even appeared to be exceeding 500 km/s, which means that it is no longer bound by the gravity of our Milky Way and will eventually leave it altogether.
But perhaps the sot significant aspect of this find is the fact these stars are not particularly massive like the previous 20 that had been discovered, and were comparable in mass to our Sun. In addition, the 5 slower stars are likely to become a focal point of study, as scientists are eager to determine what slowed them down. One possible explanation is that interaction with the galaxy’s dark matter might have been responsible.
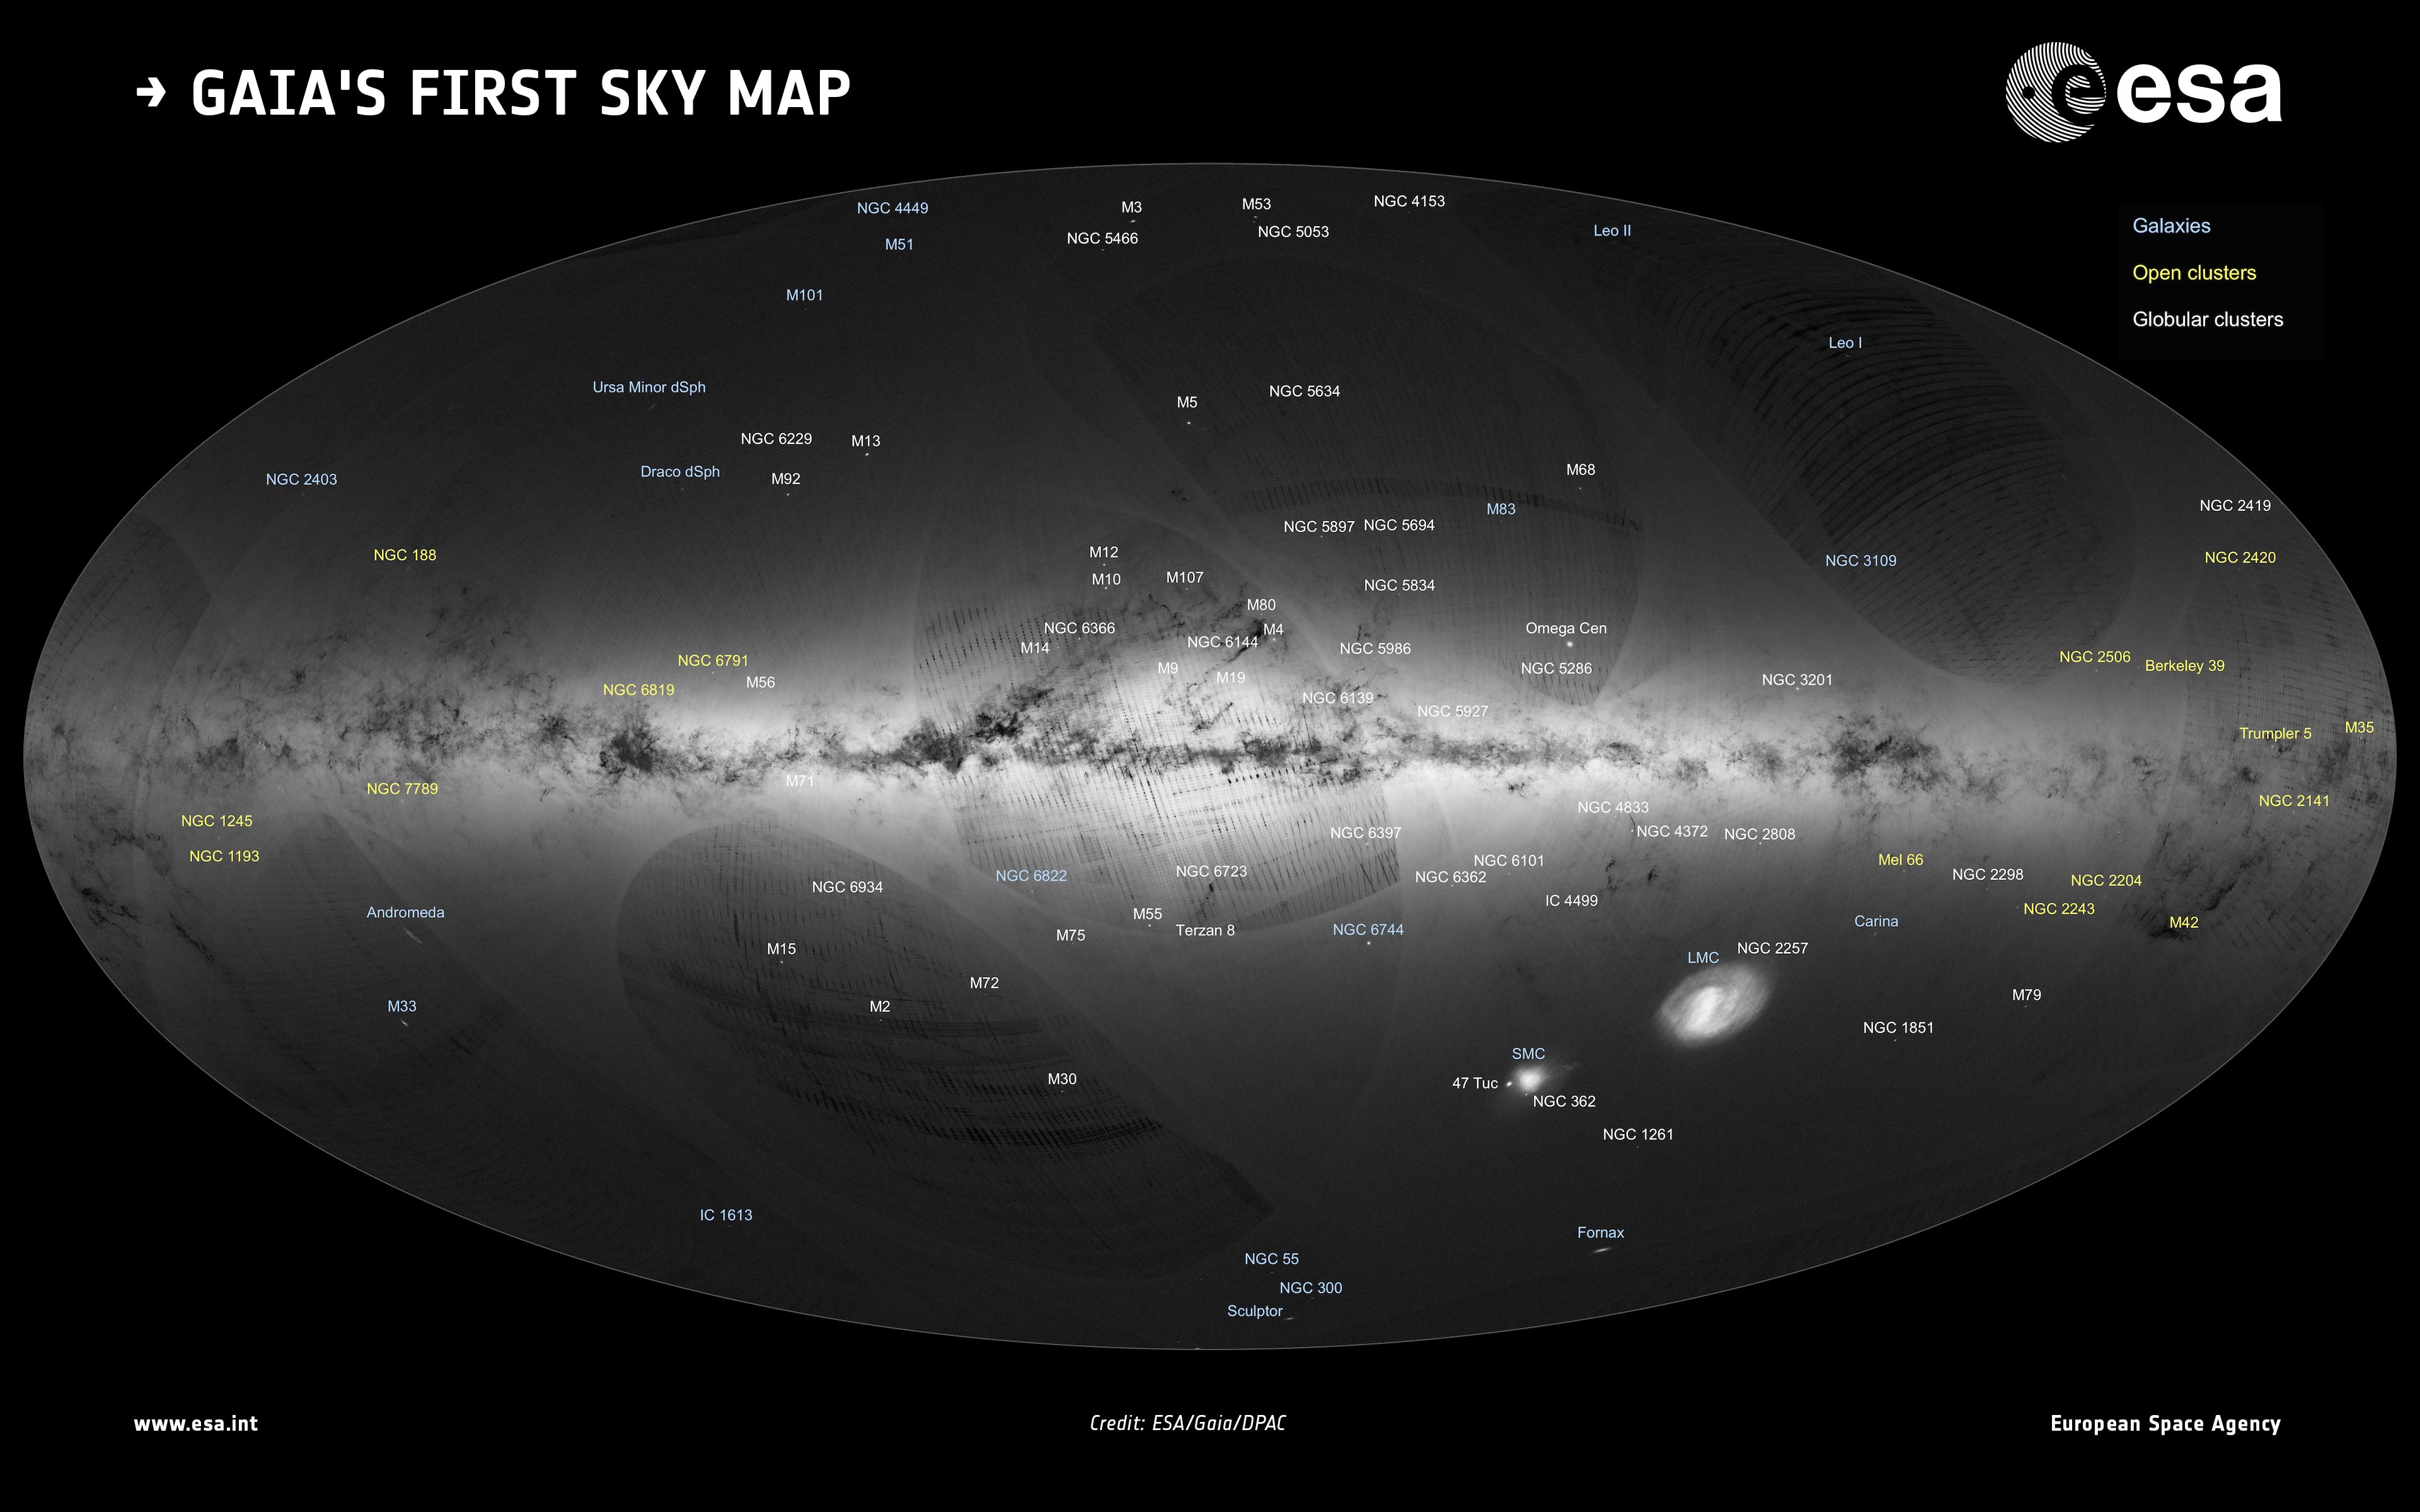
Gaia’s first sky map. Credit: ESA/Gaia/DPAC. Credit: A. Moitinho & M. Barros (CENTRA – University of Lisbon), on behalf of DPAC.
Much as the TGAS has been merely an early indication of the vast and valuable data Gaia will eventually provide, this study showcases the kinds of discoveries and research that this data will enable. By with not just 2 million, but a billion stars to study, astronomers are sure to reveal many new and exciting things about the dynamics of our Milky Way and the kinds of forces that have shaped it.
For this purpose, Marchetti and his team are upgrading their program to handle the much larger data set, which is scheduled to be released in April of 2018. This catalog will include distance and motions for over a billion stars, as well as velocities for a specific subset. From this, the team may find that fast-moving stars which are being booted out of the Milky Way are a lot more common than previously thought.
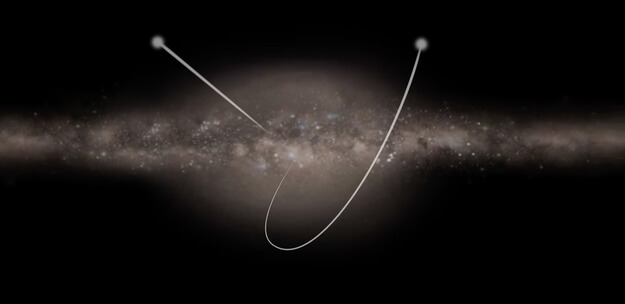
And be sure to enjoy this video that shows the paths of these six newly-discovered fast-moving stars, courtesy of the ESA: