New Study Reveals Little Ice Age Triggered By Volcanism

Gifford Miller collects vegetation samples on Baffin Island. (Photo courtesy University of Colorado Boulder.)

[/caption]

In a study led by the University of Colorado Boulder with co-authors at the National Center for Atmospheric Research (NCAR) and other organizations, researchers may have possibly found evidence the “Little Ice Age” may have had ties to an unusual era of volcanic activity… one that lasted for about 50 years. In just five decades, four massive tropical volcanic eruptions managed to take Earth’s entire environment and put it on ice. Somewhere near the years between 1275 and 1300 A.D., these eruptions caused some very cool summer weather in the northern hemisphere which triggered an expansion of sea ice that – in turn – weakened Atlantic currents. However, it didn’t weaken the already cool climate. It strengthened it.

The international study was done in layers – like a good cake – but instead of sweet frosting, it was a composite look at dead vegetation, ice and sediment core data. By engaging highly detailed computer climate modeling, scientists are now able to have a strong theory of what triggered the Little Ice Age.. a theory which begins with decreased summer solar radiation and progresses through erupting volcanoes. Here planet-wide cooling could have been started by sulfates and other aerosols being ejected into our atmosphere and reflecting sunlight back into space. Simulations have shown it could have even been a combination of both scenarios.

“This is the first time anyone has clearly identified the specific onset of the cold times marking the start of the Little Ice Age,” says lead author Gifford Miller of the University of Colorado Boulder. “We also have provided an understandable climate feedback system that explains how this cold period could be sustained for a long period of time. If the climate system is hit again and again by cold conditions over a relatively short period—in this case, from volcanic eruptions—there appears to be a cumulative cooling effect.”

“Our simulations showed that the volcanic eruptions may have had a profound cooling effect,” says NCAR scientist Bette Otto-Bliesner, a co-author of the study. “The eruptions could have triggered a chain reaction, affecting sea ice and ocean currents in a way that lowered temperatures for centuries.” The team’s research papers will be published this week in Geophysical Research Letters. Members of the group include co-authors from the University of Iceland, the University of California Irvine, and the University of Edinburgh in Scotland. The study was funded in part by the National Science Foundation, NCAR’s sponsor, and the Icelandic Science Foundation.

“Scientific estimates regarding the onset of the Little Ice Age range from the 13th century to the 16th century, but there is little consensus,” Miller says. It’s fairly clear these lower temperatures had an impact on more southerly regions such as South American and China, but the effect was far more clear in areas such as northern Europe. Glacial movement eradicated populated regions and historical images show people ice skating in places known to be too warm for such solid freezing activities before the Little Ice Age.

“The dominant way scientists have defined the Little Ice Age is by the expansion of big valley glaciers in the Alps and in Norway,” says Miller, a fellow at CU’s Institute of Arctic and Alpine Research. “But the time in which European glaciers advanced far enough to demolish villages would have been long after the onset of the cold period.”

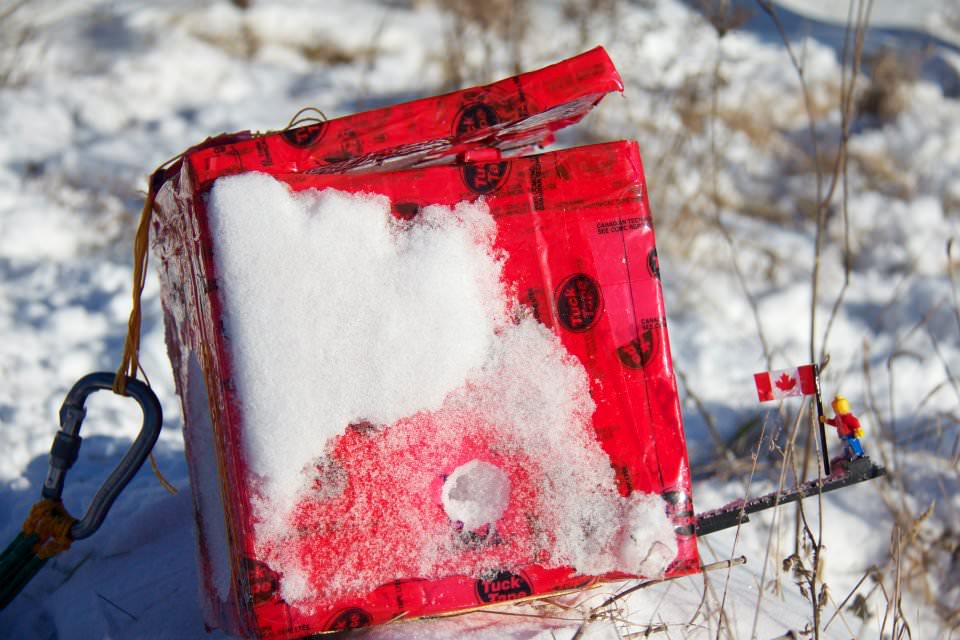
By employing the technique of radiocarbon dating, approximately 150 plant specimens, complete with roots, were gathered from the receding edges of ice caps located on Baffin Island in the Canadian Artic. In these samples they found evidence of a “kill date” which ranged between 1275 and 1300 A.D. This information led the team to surmise the plants were quickly frozen and then just as quickly encased in solid ice. A second documented kill date occurred about 1450 A.D. showing another major event. To further flesh out their findings, the research team took sediment sample cores from a glacial lake which is linked to the mile-high Langikull ice cap. These important samples from Iceland can be reliably dated back as far as 1,000 years and the results showed a sudden increase in ice during the late 13th century and again in the 15th. Thanks to these techniques which rely on the presence tephra deposits, we know these climate cooling events occurred as a result of volcanic eruptions.

“That showed us the signal we got from Baffin Island was not just a local signal, it was a North Atlantic signal,” Miller says. “This gave us a great deal more confidence that there was a major perturbation to the Northern Hemisphere climate near the end of the 13th century.”

What brought the team to their final conclusions? Through the use of the Community Climate System Model developed by scientists at NCAR and the Department of Energy with colleagues at other organizations, they were able to simulate the impact of volcanic cooling on the extent and mass of Artic sea ice. The model painted a portrait of what could have occurred from about 1150 to 1700 A.D. and showed that some large scale eruptions could have impacted the northern hemisphere if they happened within a close time frame. In this scenario, the long term cooling effect could have expanded the Artic Sea ice to the point where it eventually met – and melted – in the North Atlantic. During the modeling, the solar radiation was set at a constant to show ” the Little Ice Age likely would have occurred without decreased summer solar radiation at the time.” concluded Miller.

Original Story Source: Univsersity Corporation for Atmospheric Research.

The Van Allen Belts and the Great Electron Escape

Artist concept of the twin Radiation Belt Storm Probes spacecraft, scheduled for launch in August 2012. Credit: NASA

[/caption]

During the 1950s and just before the great “Space Race” began, scientists like Kristian Birkeland, Carl Stormer, and Nicholas Christofilos had been paying close attention to a theory – one that involved trapped, charged particles in a ring around the Earth. This plasma donut held in place by our planet’s magnetic field was later confirmed by the first three Explorer missions under the direction of Dr. James Van Allen. Fueled by perhaps solar winds, or cosmic rays, the knowledge of their existence was the stuff of nightmares for an uniformed public. While the “radiation” can affect objects passing through it, it doesn’t reach Earth, and this realization quickly caused fears to die. However, there are still many unanswered questions about the Van Allen Radiation Belts that mystify modern science.

Over the years we’ve learned these radiation zones are comprised of electrons and energetically charged particles. We’ve documented the fact they can both shrink and swell according to the amount of solar energy they receive, but what researchers haven’t been able to pinpoint is exactly what causes these responses. Particles come and particles go – but there isn’t a solid answer without evidence. A pertinent question has been to determine if particles escape into interplanetary space when the belts shrink – or do they fall to Earth? Up until now, it’s been an enigma, but a new study employing several spacecraft at the same time has been to trace the particles and follow the trail up.

“For a long time, it was thought particles would precipitate downward out of the belts,” says Drew Turner, a scientist at the University of California, Los Angeles, and first author on a paper on these results appearing online in Nature Physics on January 29, 2012. “But more recently, researchers theorized that maybe particles could sweep outward. Our results for this event are clear: we saw no increase in downward precipitation.”

From October to December 2003, the radiation belts swelled and shrank in response to geomagnetic storms as particles entered and escaped the belts. Credit: NASA/Goddard Scientific Visualization Studio

This isn’t just a simple answer to simple question, though. Understanding the movement of the particles can play a critical role in protecting our satellite systems as they pass through the Van Allen Belts – and its far reaching radiation extensions. As we know, the Sun produces copious amounts of charged particles in the stellar winds and – at times – can blast in our direction during coronal mass ejections (CMEs) or shock fronts caused by fast solar winds overtaking slower winds called co-rotating interaction regions -CIRs). When directed our way, they disrupt Earth’s magnetosphere in an event known as a geomagnetic storm. During a “storm” the radiation belt particles have been known to decrease and empty the belt within hours… a depletion which can last for days. While this is documented, we simply don’t know the cause, much less what causes the particles to leave!

In order to get a firmer grip on what’s happening requires multiple spacecraft measuring the changes at multiple points at the same time. This allows scientists to determine if an action that happens in one place affects another elsewhere. While we look forward to the Radiation Belt Storm Probes (RBSP) mission results, it isn’t scheduled to launch until August 2012. In the interim, researchers have combined data from two widely separated spacecraft to get an early determination of what happens during a loss event.

“We are entering an era where multi-spacecraft are key,” says Vassilis Angelopoulos, a space scientist at UCLA, and the principal investigator for THEMIS and a coauthor on the paper. “Being able to unite a fleet of available resources into one study is becoming more of a necessity to turn a corner in our understanding of Earth’s environment.”

So where did this early support information come from? Fortunately the team was able to observe a small geomagnetic storm which occurred on January 6, 2011. By engaging the the three NASA THEMIS (Time History of Events and Macroscale Interactions during Substorms) spacecraft, two GOES (Geostationary Operational Environment Satellite), operated by the National Oceanic and Atmospheric Administration (NOAA), and six POES (Polar Operational Environmental Satellite), run jointly by NOAA, and the European Organization for the Exploitation of Meteorological Satellites (EUMETSAT) spacecraft, they were able to catch electrons moving close to the speed of light as they dropped out of the belt for over six hours. Orbiting Earth’s equatorial zones, the THEMIS and GOES spacecraft are just part of the team. The POES spacecraft passes through the radiation belts several times a day as it cruises at a lower altitude and near the poles. By combining data, the scientists were able to take several observational vantage points and proved – without a doubt – that the particles left the belt by way of space and did not return to Earth.

“This was a very simple storm,” says Turner. “It’s not an extreme case, so we think it’s probably pretty typical of what happens in general and ongoing results from concurrent statistical studies support this.”

During this time, the spacecraft also observed a low-density area of the Van Allen belts which appeared along the periphery and traveled inward. This appeared to be an indication the particles were outward bound. If this was a normal occurrence, it stands to reason that a type of “wave” must assist the motion, allowing the particles to reach the outer escape boundary. Discovering just what exactly triggers this escape mechanism will be one of the jobs for RBSP, says David Sibeck at NASA’s Goddard Space Flight Center in Greenbelt, Md., who is NASA’s mission scientist for RBSP and project scientist for THEMIS.

“This kind of research is a key to understanding, and eventually predicting, hazardous events in the Earth’s radiation belts,” says Sibeck. “It’s a great comprehensive example of what we can expect to see throughout the forthcoming RBSP mission.”

Original Story Source: NASA THEMIS News Release.

Amazing Panorama of Western Europe at Night from Space Station

Western Europe at Night With hardware from the Earth-orbiting International Space Station appearing in the near foreground, a night time European panorama reveals city lights from Belgium and the Netherlands at bottom center. the British Isles partially obscured by solar array panels at left, the North Sea at left center, and Scandinavia at right center beneath the end effector of the Space Station Remote Manipulator System or Canadarm2. This image was taken by the station crew on Jan. 22, 2012. Credit: NASA

[/caption]

An amazing panorama revealing Western Europe’s ‘Cities at Night’ with hardware from the stations robotic ‘hand’ and solar arrays in the foreground was captured by the crew in a beautiful new image showing millions of Earth’s inhabitants from the Earth-orbiting International Space Station (ISS).

The sweeping panoramic vista shows several Western European countries starting with the British Isles partially obscured by twin solar arrays at left, the North Sea at left center, Belgium and the Netherlands (Holland) at bottom center, and the Scandinavian land mass at right center by the hand, or end effector, of the Canadian-built ISS robotic arm known as the Space Station Remote Manipulator System (SSRMS) or Canadarm2.

European Space Agency astronaut Andre Kuipers gazing at Earth from the Cupola dome of the ISS

Coincidentally European Space Agency astronaut Andre Kuipers from Holland (photo at left) is currently aboard the ISS, soaring some 400 kilometers (250 miles) overhead.

The panoramic image was taken by the ISS residents on January 22, 2012.

The Expedition 30 crew of six men currently serving aboard the ISS (photo below) hail from the US, Russia and Holland.

NASA astronaut Dan Burbank is the commander of Expedition 30 and recently snapped awesome photos of Comet Lovejoy.

“Cities at Night” – Here’s a portion of a relevant ISS Blog post from NASA astronaut Don Pettit on Jan. 27, 2012:

“Cities at night are different from their drab daytime counterparts. They present a most spectacular display that rivals a Broadway marquee. And cities around the world are different. Some show blue-green, while others show yellow-orange. Some have rectangular grids, while others look like a fractal-snapshot from Mandelbrot space.”

“Patterns in the countryside are different in Europe, North America, and South America. In space, you can see political boundaries that show up only at night. As if a beacon for humanity, Las Vegas is truly the brightest spot on Earth. Cities at night may very well be the most beautiful unintentional consequence of human activity,” writes NASA astronaut Don Pettit currently residing aboard the ISS.

Comet Lovejoy on 22 Dec. 2011 from the International Space Station. Comet Lovejoy is visible near Earth’s horizon in this nighttime image photographed by NASA astronaut Dan Burbank, Expedition 30 commander, onboard the International Space Station on Dec. 22, 2011. Credit: NASA/Dan Burbank
Expedition 30 Crew: Pictured on the front row are NASA astronaut Dan Burbank, commander; and Russian cosmonaut Oleg Kononenko, flight engineer. Pictured from the left (back row) are Russian cosmonauts Anton Shkaplerov and Anatoly Ivanishin; along with European Space Agency astronaut Andre Kuipers and NASA astronaut Don Pettit, all flight engineers. Photo credit: NASA and International Space Station partners

Earth’s “Missing Energy”

Clouds play a vital role in Earth's energy balance, cooling or warming Earth's surface depending on their type. This painting, "Cumulus Congestus," by JPL's Graeme Stephens, principal investigator of NASA's CloudSat mission, depicts cumulus clouds, which transport energy away from Earth's surface. Image credit: Graeme Stephens

[/caption]

Like many of us, Earth works on a budget – an energy budget. However, this energy isn’t the type that powers our automobiles or electric lights. It’s the energy that empowers our living planet. When it comes to input and output, the Earth is a huge throughput system. The most massive source of incoming energy is solar radiation, with geothermal and tidal energy completing the circle. All of these forms of energy are converted to heat and re-radiated into space. In 2010, scientists at the National Center for Atmospheric Research in Boulder, Colorado publicized a study taken from satellite observations which stated there were certain variances between Earth’s heat and ocean heating. What they found was “missing energy” in our planet’s system. Why did this energy seem to be disappearing? The research group began wondering if perhaps there was a problem with the method of recording energy as absorbed from the Sun and its emission back to space.

This was a question that needed an answer. Enter an international team of atmospheric scientists and oceanographers, led by Norman Loeb of NASA’s Langley Research Center in Hampton, Virginia, and including Graeme Stephens of NASA’s Jet Propulsion Laboratory in Pasadena, California. It was their mission to account for the missing energy. Armed with 10 years of data from NASA Langley’s orbiting Clouds and the Earth’s Radiant Energy System Experiment (CERES) instruments, the team set out to record the radiation balance located at the apex of Earth’s atmosphere and how it changed with time. Supplied with the CERES data, they then combined it with estimates of oceanic heat content as recorded by three separate sensors. Their findings showed that both satellite and physical measurements of the ocean’s energy agreed with one another once observational uncertainties were added to the equation. Their work was summarized in a NASA-led study published January 22 in the journal Nature Geosciences,

“One of the things we wanted to do was a more rigorous analysis of the uncertainties. When we did that, we found the conclusion of missing energy in the system isn’t really supported by the data.” said Loeb. “Our data shows that Earth has been accumulating heat in the ocean at a rate of half a watt per square meter (10.8 square feet), with no sign of a decline. This extra energy will eventually find its way back into the atmosphere and increase temperatures on Earth.”

For the most part, scientists concur that around 90% of extra heat created by the greenhouse gas effect is being stored in Earth’s oceans. If it follows the laws of thermodynamics and is released back into the atmosphere, “a half-watt per square meter accumulation of heat could increase global temperatures by 0.3 or more degrees centigrade or 0.54 degree Fahrenheit”. As Loeb explained, these observations show the need to employ several different measuring systems over time and the findings underline the imperative need to continually update how Earth’s energy flows are recorded.

The newly published work came from the science team at the National Center for Atmospheric Research and other authors of the paper are from the University of Hawaii, the Pacific Marine Environmental Laboratory in Seattle, the University of Reading United Kingdom and the University of Miami. Their study mapped inconsistencies between satellite information on Earth’s heat balance between the years of 2004 and 2009 and included information on the rate of oceanic heating taken from the upper 700 meters of the surface. They said the inconsistencies were evidence of “missing energy.”

Original Story Source: JPL News Release.

Toronto Teens Launch “Lego Man in Space”

Toronto Teens Launch Lego Main In Space to the Stratosphere - Jan 2012. Stunning space imagery was captured by Canadian teenagers Mathew Ho and Asad Muhammad when they lofted a tiny ‘Lego Man in Space’ astronaut to an altitude of 16 miles (25 kilometers) using on a helium filled weather balloon. Credit: Mathew Ho and Asad Muhammad. Watch the YouTube below

[/caption]
Updated:Jan. 30

Two teens from Toronto,Canada have launched “Lego Man in Space” using a helium filled weather balloon and captured stunning video of the miniature toy figure back dropped by the beautiful curvature of Earth and the desolate blackness of space that’s become a worldwide YouTube sensation – over 2 million hits !

17 year olds Mathew Ho and Asad Muhammad lofted the tiny 2 inch tall Lego figure from a local Toronto soccer field up to a height of about 85,000 feet, or 16 miles (25 kilometers), where the 22 foot (7 m) diameter helium balloon burst in what is technically known as the stratosphere. The homemade styrofoam capsule – equipped with two video cameras and two digital cameras (Canon) – then parachuted back to Earth.

“We launched the project on January 7,” Mathew Ho told Universe Today.

“Altogether, we used 4 cameras, two cameras taking stills, and two taking video – Canon, Sony, GoPro – in the 1 cubic foot capsule,” Ho explained.

“After endless hours of hard work, we managed to capture stunning views of our atmosphere and put a ‘Lego’ man into near space!” said the ambitious teens who are 12th graders at the Agincourt Collegiate Institute.

The pair posted a YouTube video (below) documenting the entire voyage and some camera snapshots on their website on January 25.

Lego Man even snapped cool Moon shots – look closely at the video and photo below.

“Lego Man in Space” – The Video

The duo recounted the details of their sensational space tale of science on a shoestring for Canadian TV and newspapers.

“Upon launch we were very relieved. But we had a lot of anxiety on launch day because there were high winds when we were going up after all the hard work,” said Ho in a studio interview on Canadian TV (CTV).

“We were also scared because now we would have to retrieve it back after it came down,” Asad chimed in.

“We had no idea it would capture photos like that and would be so good,” said Ho. “We were blown away when we saw them back home.”

The toy Lego astronaut is seen standing atop a thin runway protruding precariously from one end of the small, box shaped capsule as though he was walking the plank and about to plunge into the ocean of space. All the while, cameras were aimed directly out towards him recording the entire rollicking journey from liftoff to the stratosphere to landing, with a constantly changing Earth in the background.

Altogether they netted two videos and 1500 photos.

Lego Man in Space shoots the Moon !
Credit: Mathew Ho and Asad Muhammad

Coincidentally, several Lego toys are constantly flying even higher above the Earth at this very moment aboard the International Space Station as part of an educational outreach effort by NASA and Lego. And 3 more Lego figurines are speeding to Jupiter aboard NASA’s Juno orbiter.

Legoman’s spectacular journey lasted some 97 minutes. He’s beaming proudly throughout the video while holding the Canadian National flag – the Red Maple Leaf. The rollercoaster-like scenery may well challenge the stomachs of those with fear of heights.

The tumbling Lego Man in Space capsule upon the violent descent captured the moment before the parachute was activated. Credit: Mathew Ho and Asad Muhammad

Mathew and Asad worked over about four months one day a week on Saturdays to assemble the rig in Mathew’s kitchen and successfully accomplished the feat on a shoestring budget of merely 400 dollars. They used GPS trackers to locate “Lego Man in Space” and recover the intact capsule holding the imagery.

After the balloon burst at 85,000 feet, the parachute assisted descent back to Earth took about 32 minutes. Winds aloft caused the capsule to drift some 76 miles (122 kilometers) away from the launch site before landing at Rice Lake in one piece.

Lego Man in Space capsule after landing 76 miles (122 kilometers) away from the Toronto soccor field launch site. Credit: Mathew Ho and Asad Muhammad

“We were jumping for joy when we saw the capsule and the parachute. We were ecstatic when we found it,” said Ho.

“We have a long history of passionate building and working together,” Ho told CTV.

The project began after they saw that MIT students had sent a camera to the edge of space with a balloon and captured stunning views.

“We were inspired by videos and pictures we had seen online two years ago and we began working on this in the Fall of 2011. In total the project cost about $400 Canadian,” Ho told me.

“We hope to publish more pictures and video to our Facebook page and website soon,” Ho added.

And now we know another truth about Lego’s – Not only can they withstand the destructive forces of kids, but outer space too !

Cold Plasma Flourishes In Earth’s Upper Atmosphere

A rendering of the Cluster satellite, designed to measure electric fields, which Andre and Cully used to detect low-energy ions high above the Earth. (Credit: European Space Agency)

[/caption]

Thousands of miles above Earth, space weather rules. Here storms of high-energy particles mix the atmosphere, create auroras, challenge satellites and even cause disturbances with electric grids and electronic devices below. It’s a seemingly empty and lonely place – one where a mystery called “cold plasma” has been found in abundance and may well have implications with our connection to the Sun. While it has remained virtually hidden, Swedish researchers have created a new method to measure these cold, charged ions. With evidence of more there than once thought, these new findings may very well give us clues as to what’s happening around other planets and their natural satellites.

“The more you look for low-energy ions, the more you find,” said Mats Andre, a professor of space physics at the Swedish Institute of Space Physics in Uppsala, Sweden, and leader of the research team whose findings have been accepted for publication in Geophysical Research Letters, a journal of the American Geophysical Union. “We didn’t know how much was out there. It’s more than even I thought.”

Where does this enigma originate? The low-energy ions begin in the upper portion of our atmosphere called the ionosphere. Here solar energy can strip electrons from molecules, leaving atoms such as oxygen and hydrogen with a positive charge. However, physically finding these ions has been problematic. While researchers knew they existed at altitudes of about 100 kilometers (60 miles), Andre and colleague Chris Cully set their sites higher – at between 20,000 and 100,000 km (12,400 to 60,000 mi). At the edge, the amount of cold ions varies between 50 to 70%… making up most of the mass of space.

However, that’s not the only place cold plasma has been found. According to the research satellite data and calculations, certain high-altitude zones harbor low-energy ions continuously. As far fetched as it may sound, the team has also detected them at altitudes of 100,000 km! According to Andre, discovering so many relatively cool ions in these regions is surprising because there’s so much energy hitting the Earth’s high altitudes from the solar wind – a hot plasma about 1,000 times hotter than what Andre considers cold. Just how cold? “The low-energy ions have an energy that would correspond to about 500,000 degrees Celsius (about one million degrees Fahrenheit) at typical gas densities found on Earth. But because the density of the ions in space is so low, satellites and spacecraft can orbit without bursting into flames.”

A scientist examines one of the European Space Agency's four Cluster satellites, used in a recent Geophysical Research Letters study to measure low-energy ions. (Credit: European Space Agency)

Pinpointing these low-energy ions and measuring how much material is leaving our atmosphere has been an elusive task. Andre’s workshop is a satellite and one of the four European Space Agency CLUSTER spacecraft. It houses a detector created from a fine wire that measures the electronic field between them during satellite rotation. However, when the data was collected, the researchers found a pair of mysteries – strong electric fields in unexpected areas of space and electric fields that didn’t fluctuate evenly.

“To a scientist, it looked pretty ugly,” Andre said. “We tried to figure out what was wrong with the instrument. Then we realized there’s nothing wrong with the instrument.” What they found opened their eyes. Cold plasma was changing the arrangement of the electrical fields surrounding the satellite. This made them realize they could utilize their field measurements to validate the presence of cold plasma. “It’s a clever way of turning the limitations of a spacecraft-based detector into assets,” said Thomas Moore, senior project scientist for NASA’s Magnetospheric Multiscale mission at the Goddard Space Flight Center in Greenbelt, Maryland. He was not involved in the new research.

Through these new techniques, science can measure and map Earth’s cold plasma envelope – and learn more about how both hot and cold plasma change during extreme space weather conditions. This research points towards a better understanding of atmospheres other than our own, too. Currently the new measurements show about a kilogram (two pounds) of cold plasma escapes from Earth’s atmosphere every second, By having a solid figure as a basis for rate of loss, scientists may be able model what became of Mars’ atmosphere – or explain the atmosphere around other planets and moons. It can also aid in more accurate space weather forecasting – even if it doesn’t directly influence the environment itself. It is a key player, even if it doesn’t cause the damage itself. “You may want to know where the low-pressure area is, to predict a storm,” Andre noted.

Modernizing space weather forecasting to where it is similar to ordinary weather forecasting, was “not even remotely possible if you’re missing most of your plasma,” Moore, with NASA, said. Now, with a way to measure cold plasma, the goal of high-quality forecasts is one step closer. “It is stuff we couldn’t see and couldn’t detect, and then suddenly we could measure it,” Moore said of the low-energy ions. “Now you can actually study it and see if it agrees with the theories.”

Original Story Source: American Geophysical Union News Release. For Further Reading: Low-energy ions: A previously hidden solar system particle population.

Blue Marble 2012: Amazing High Definition Image of Earth

A 'Blue Marble' image of the Earth taken from the VIIRS instrument aboard NASA's most recently launched Earth-observing satellite - Suomi NPP. This composite image uses a number of swaths of the Earth's surface taken on January 4, 2012. Credit: NASA/NOAA/GSFC/Suomi NPP/VIIRS/Norman Kuring.

[/caption]

A new high-definition version of the ‘Blue Marble’ has been taken from the newest Earth observation satellite. The just-renamed Suomi NPP satellite took numerous images on January 4, 2012 and this composite image was created from several “swaths” of Earth. It is a stunningly beautiful look at our home planet, with the largest versions of the image showing about 1.6 km (1 mile) per pixel. This Sun-synchronous Earth-orbiting satellite is 824 kilometers (512 miles) above Earth, and it gets a complete view of our planet every day. It is the first of a new generation of satellites that will observe many facets of how our Earth may be changing.

Originally launched as the National Polar-orbiting Operational Environmental Satellite System Preparatory Project (NPP), it was just renamed ‘Suomi NPP’ on to honor a pioneer in the use of satellites, the late Verner E. Suomi.

See below for an image showing these “swaths” from global images taken on November 24, 2011.

The Suomi NPP satellite gets a complete view of our planet every day. This image uses 20 orbital ‘swaths’ from November 24, 2011, and is the first complete global image from the VIIRS instrument. Credit: NASA Earth Observatory.

These images were taken with the The Visible/Infrared Imager Radiometer Suite or VIIRS instrument aboard Suomi NPP.

VIIRS images the surface in long wedges measuring 3,000 kilometers (1,900 miles) across. The swaths from each successive orbit overlap one another, so that at the end of the day, the sensor has a complete view of the globe. The Arctic is missing because it is too dark to view in visible light during the winter.

The NPP satellite was placed in a Sun-synchronous orbit, so its path takes the satellite over the equator at the same local (ground) time in every orbit. This orbit allows the satellite to maintain the same angle between the Earth and the Sun so that all images have similar lighting. This consistent angle is important because it allows scientists to compare images from year to year without worrying about extreme changes in shadows and lighting.

Suomi NPP is carrying five instruments on board, and the biggest and most important instrument is VIIRS.

Unfortunately, an anomaly has been discovered in the instrument. During the checkout phase after it launched in October 2011, engineers detected a larger than expected decrease in sensor sensitivity in four of VIIRS’s near-infrared and visible channels.

An analysis revealed an anomalous material on the surface of the mirror, and further investigation on the ground discovered a non-standard process that occurred during the mirror coating as a potential source of tungsten oxide contamination on the VIIRS mirrors. Tungsten oxides could cause the surface of the mirror to darken.

This evidence suggests that the cause of the contamination is limited to the VIIRS instrument, and is not a concern for other NPP instruments. Officials from NPP said that while this problem is likely irreversible, the darkening of the VIIRS mirror caused by the contamination is expected to reach a plateau and remain at that level for the life of the mission. Although testing on this issue is continuing, NPP mission managers expect this plateau to still provide sufficient margins to allow VIIRS to meet its design requirements.

Still, the images have been spectacular so far from Suomi NPP and we look forward to more high definition views of our Blue Marble.

See the complete set of images from this spacecraft on their Flickr site.

More info on the Suomi NPP

Amazing Radar Image from Space Highlights Costa Concordia Catastrophe

Space Radar Image of Costa Concordia Cruise Ship Catastrophe, Giglio, Italy- January 17, 2012. Image mosaic shows side-by-side comparison of radar and photo imagery from space satellites showing the deadly wreckage of the Costa Concordia luxury cruise ship which ran aground off the shoreline of Giglio,Italy on Friday, January 13, 2012. Image Credit: COSMO-SkyMed (left, bottom right) & DIGITALGLOBE (top, middle right). Mosaic: Marco di Lorenzo/Ken Kremer More Images and Passenger Video below

[/caption]

An amazing new radar image from space (above and below) shows the wreckage of the deadly Costa Concordia catastrophe just hours after the luxury cruise liner struck gigantic rocks jutting up from the shoreline of the Island of Giglio [Isola del Giglio] off the coast of Tuscany, Italy on Friday the 13th of January 2012, sending thousands of terrified tourists screaming for their very lives.

The radar image was snapped by chance during a routine reconnaissance survey by an Italian COSMO-SkyMed satellite orbiting above the Earth, according to the Italian Space Agency (ASI) and clearly shows the Costa Concordia wreckage and entire island of Giglio.

Our composite mosaic above combines the COSMO-SkyMed space radar image with the DigitalGlobe WorldView satellite photo, to provide a side-by-side comparison of the wreckage from the two different satellite systems which have different resolutions. Read my prior story with the stunning DigitalGlobe image – here at Universe Today.

At least 11 people were killed in the still unfolding tragedy and another two dozen people are still missing today, January 19.

Look at this dramatic new YouTube video of passengers scrambling to stay alive

The COSMO-SkyMed satellite normally takes repeat radar images every 16 days. In the case of an oil spill, the satellite would enter automatically an “emergency mode” and start taking very-high resolution images of the affected region, according to ASI.

Severe weather is approaching and could break the ship apart according to news reports.

Space Radar Image of Costa Concordia Cruise Ship Wreckage, Giglio, Italy- January 13, 2012
COSMO-SkyMed space radar image taken just hours after Costa Concordia luxury cruise ship ran aground off the shoreline of Giglio, Italy on 13 Jan. 2012. Credit: COSMO-SkyMed

The Costa Concordia is loaded with several thousand gallons of diesel fuel oil and officials are concerned about the very real potential for a leak which could contaminate the beautiful surroundings and harm the local environment

Location Map of Costa Concordia Shipwreck
off the Tuscan coastline of Giglio, Italy

The deadly Jan. 13 collision tore a 70 meter long gash in the ship’s hull, causing the Costa Concordia cruise liner to begin listing. Ultimately the ship fell on its side as it was steered into shallow waters.

Rescue operations resumed today although the ship is still shifting and hazardous to the brave rescue teams.

Helicopters lowered emergency workers onto the top of the wreckage. Divers working below used explosives to blast open new holes in the hull to get to any survivors.

And still more Italian emergency personnel could be seen scaling up the sides – all in a desperate attempt to reach survivors from every possible angle.

But sadly, hopes are fading. A 5 year old Italian girl and her father are among the missing.

Costa Concordia Shipwreck occurred on January 13, 2012

COSMO-SkyMed is a constellation of four Italian satellites that are equipped with Synthetic Aperture Radar (SAR) sensors that provide global coverage of the planet that serves both military and civilian uses such as seismic hazard analysis, environmental disaster monitoring, and agricultural mapping.

The COSMO-SkyMed space radar system provides all weather imagery and is funded by the Italian government and managed by the Italian Space Agency (ASI).

Satellite Close-up of Wreckage of Costa Concordia Luxury Cruise Ship of the coast of Giglio, Italy.
Credit: DIGITALGLOBE

Deadly Costa Concordia Shipwreck Captured in Stunning Image from Space

Capsized Costa Concordia Cruise Ship, Giglio, Italy- January 17, 2012; The Costa Concordia luxury cruise ship ran aground in the Tuscan waters off of Giglio,Italy on Friday, January, 2012. Credit: DIGITALGLOBE See the Full Image below

[/caption]

The deadly Costa Concordia shipwreck has been captured in a stunning high resolution image from space that vividly shows the magnitude of the awful disaster with the huge luxury cruise ship precariously tipped on its side just off of the Tuscan coastline of the Italian Island of Giglio [Isola del Giglio]. See the full image and close-up below.

The newly released image was taken by a commercial owned by DigitalGlobe and flying some 300 miles overhead in low Earth orbit. The photo from a WorldView satellite was snapped on January 17, 2012 and shows exactly where the cruise ship ran aground five days ago on Friday, January 13, 2012 when it was steered way to close to the shoreline.

The photo is a surreal view of the massive ship on its side, submerged on the shoreline in the Mediterranean Sea snapped through scattered clouds. The sight is something really hard to believe – imagine the movie Titanic.

Location Map of Costa Concordia Shipwreck
off the Tuscan coastline of Giglio, Italy

The Costa Concordia cruise ship had just left port with over 3200 passengers and 1000 crew members aboard and was sailing extremely close to Giglio Island when it apparently struck underwater rocks that suddenly ripped a gigantic gash through the hull and capsized the ship, sending the terrified passengers scrambling for their lives.

The Mediterranean waters temperature was about 57 F.

Shocking infrared video shows people frantically crawling over the side of the listing ship – tilted completely on its side – frantically trying to get into the lifeboats using rope lines – at night.

Passengers said it was an “Out of body experience.” Strangers helping strangers

Amazing new video shows the rocks clearly embedded in the hull of the wrecked ship.

The ship soon began listing off the Italian coastline in darkness. At a moment’s notice objects started flying through the air and the frightened passengers boarded lifeboats as fast as they could, apparently with no practice training beforehand.

Full view of Capsized Costa Concordia Cruise Ship, Giglio, Italy- January 17, 2012
The Costa Concordia luxury cruise ship ran aground in the Tuscan waters off of Giglio,Italy on Friday, January, 2012. Giglio Island at left, the Mediterranean Sea at right. Credit: DIGITALGLOBE

11 people are confirmed dead so far and about two dozen people are still missing today as emergency rescue crews furiously search every nook and cranny on the cruise ship in a desperate bid to find anyone who may still be alive.

Giglio Island, Italy off the coastline of Tuscany - Location Costa Concordia Shipwreck
Click to enlarge

Rescues divers have used explosives to gain entry to portions of the ship searching for any survivors.

Rescue efforts were temporarily suspended today (Jan. 18) due to rough seas. The Costa Concordia is loaded with several thousand gallons of diesel fuel oil which could contaminate the surroundings.

Satellite Close-up of Wreckage of Costa Concordia Luxury Cruise Ship of the coast of Giglio, Italy. Credit: DIGITALGLOBE

According to the DigitalGlobe website, the Colorado based company owns and operates the most sophisticated constellation of high-resolution commercial earth imaging satellites – . QuickBird, WorldView-1 and WorldView-2 which are capable of collecting over 500 million km2 of quality imagery per year with high resolution cameras.

The DigitalGlobe satellites are used for defense and intelligence, civil agencies, mapping and analysis, environmental monitoring and oil and gas exploration.

Costa Concordia Shipwreck
Artist concept shows DigitalGlobe Quickbird satellite soaring over Italy and Sicily. Credit: DigitalGlobe

Now look in the opposite direction and see fabulous photos of the ISS crossing the Moon shot from a telescope in Houston, Texas
Dazzling Photos of the International Space Station Crossing the Moon!

ISS Soars Over Stormy Africa

Comet Lovejoy can be seen in the video rising just right of the Milky Way.


Here’s a quick but lovely little gem: a time-lapse video taken from the ISS as it passed above central Africa, Madagascar and the southern Indian Ocean on December 29, 2011. The nighttime flyover shows numerous lightning storms and the thin band of our atmosphere, with a layer of airglow above, set against a stunning backdrop of the Milky Way and a barely-visible Comet Lovejoy, just two weeks after its close encounter with the Sun.

This video was made from photos taken by Expedition 30 astronauts. The photos were compiled at Johnson Space Center and uploaded to The Gateway to Astronaut Photography of Earth, an excellent database of… well, of astronauts’ photos of Earth.

[/caption]

The site’s description of this particular video states:

This video was taken by the crew of Expedition 30 on board the International Space Station. The sequence of shots was taken December 29, 2011 from 20:55:05 to 21:14:09 GMT, on a pass from over central Africa, near southeast Niger, to the South Indian Ocean, southeast of Madagascar. The complete pass is over southern Africa to the ocean, focusing on the lightning flashes from local storms and the Milky Way rising over the horizon. The Milky Way can be spotted as a hazy band of white light at the beginning of the video. The pass continues southeast toward the Mozambique Channel and Madagascar. The Lovejoy Comet can be seen very faintly near the Milky Way. The pass ends as the sun is rising over the dark ocean.

There are lots more time-lapse videos on the Gateway as well, updated periodically. Check them out here.

Video courtesy of the Image Science & Analysis Laboratory, NASA Johnson Space Center.