July 4 Morning Fireworks from NASA!
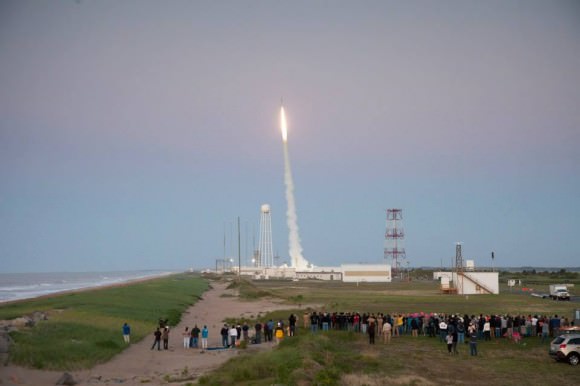
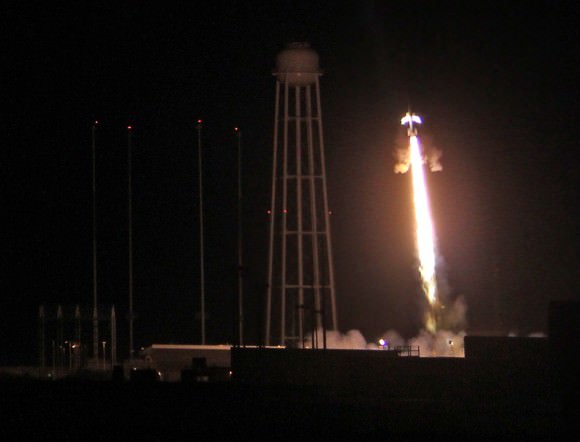
A NASA Black Brant V Sounding Rocket launches in support of the Daytime Dynamo Mission on July 4, 2013 from NASA Wallops Flight Facility, VA. Credit: NASA/J. Eggers[/caption]
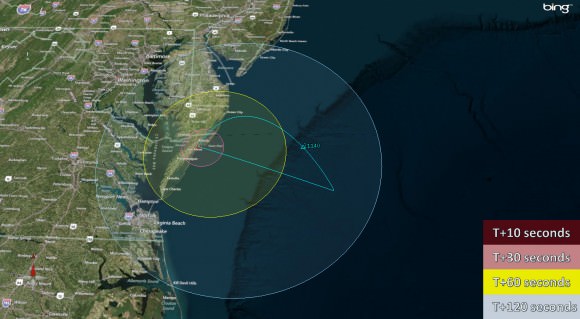
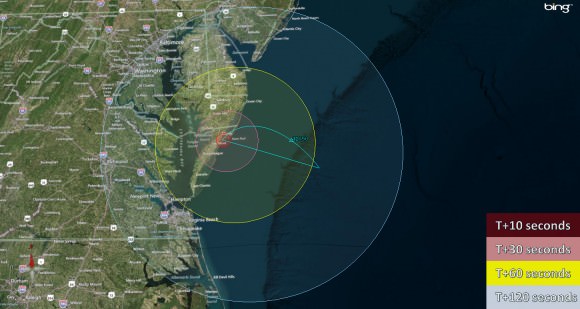
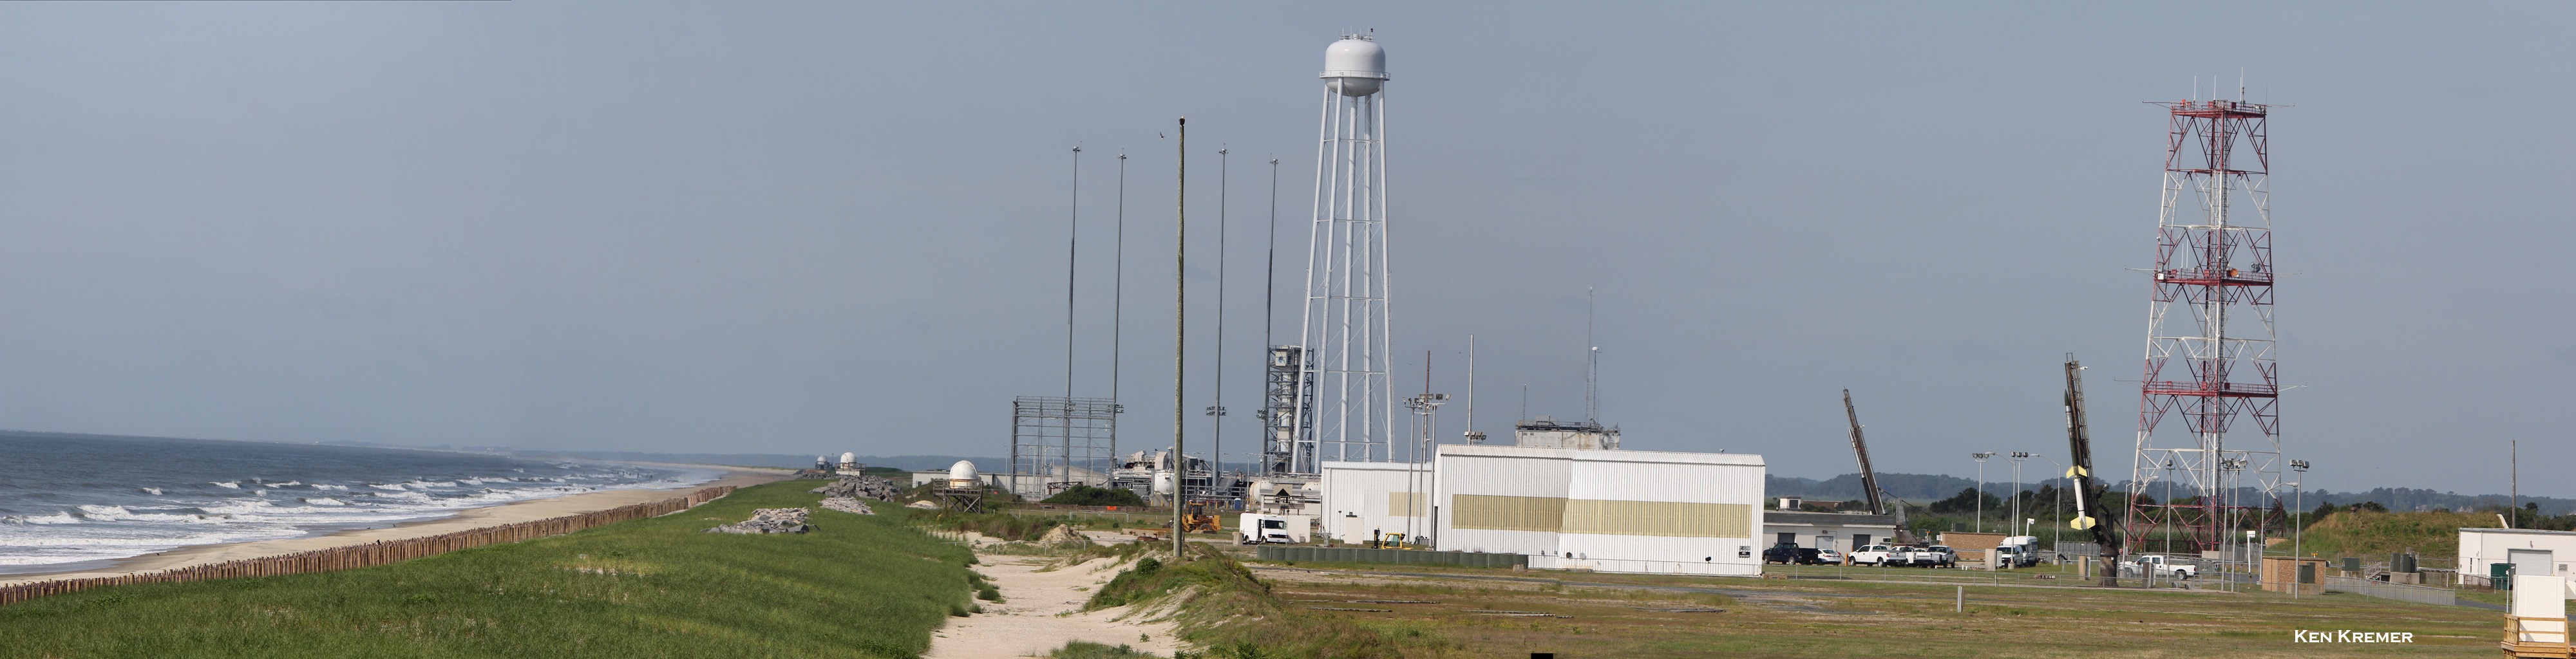
WALLOPS ISLAND, VA – Today, July 4, NASA celebrated America’s Independence Day with a spectacular fireworks display of a dynamic duo of sounding rockets – blasting off barely 15 seconds apart this morning from the agencies NASA Wallops Island facility on the Eastern Shore of Virginia on a science experiment to study the ionosphere.
The goal of the two rocket salvo was an in depth investigation of the electrical currents in Earth’s ionosphere – called the Daytime Dynamo.
The Dynamo electrical current sweeps through the ionosphere, a layer of charged particles that extends from about 30 to 600 miles above Earth.
Disruptions in the ionosphere can scramble radio wave signals for critical communications and navigations transmissions that can impact our every day lives.
The launches suffered multiple delays over the past 2 weeks due to weather, winds, errant boats and unacceptable science conditions in the upper atmosphere.
At last, the Fourth of July was the irresistible charm.
The liftoff times were 10:31:25 a.m. for the Black Brant V and 10:31:40 a.m. (EDT) for the Terrier-Improved Orion.
The experiment involved launching two suborbital rockets and also dispatching a NASA King Air airplane to collect a stream of airborne science measurements.
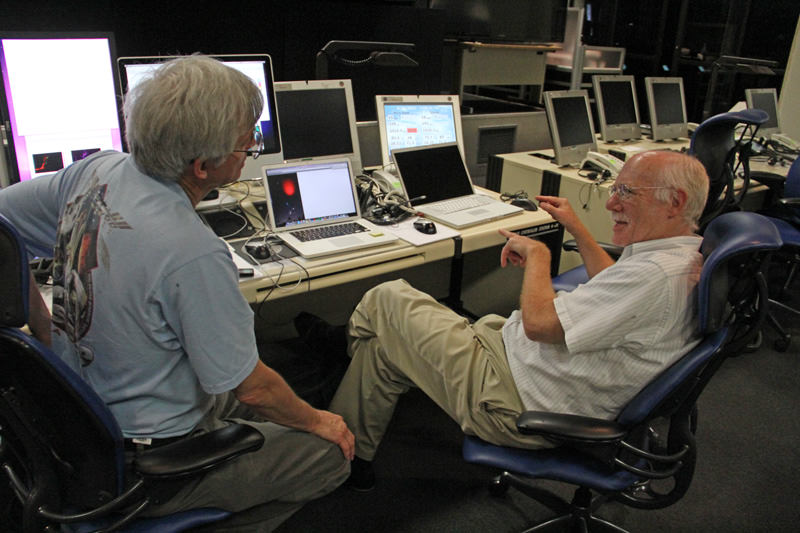
Daytime Dynamo is a joint project between NASA and the Japanese Space Agency, or Japan Aerospace Exploration Agency, or JAXA, said Robert Pfaff to Universe Today in an exclusive interview inside Mission Control at Wallops. Pfaff is the principle investigator for the Dynamo sounding rocket at NASA’s Goddard Space Flight Center in Greenbelt, Md.
“The dynamo changes during the day and varies with the season,” Pfaff told me.
But they only have one chance to launch. So the science team has to pick the best time to meet the science objectives.
“We would launch every month if we could and had the funding, in order to even more fully characterize the Dynamo.”
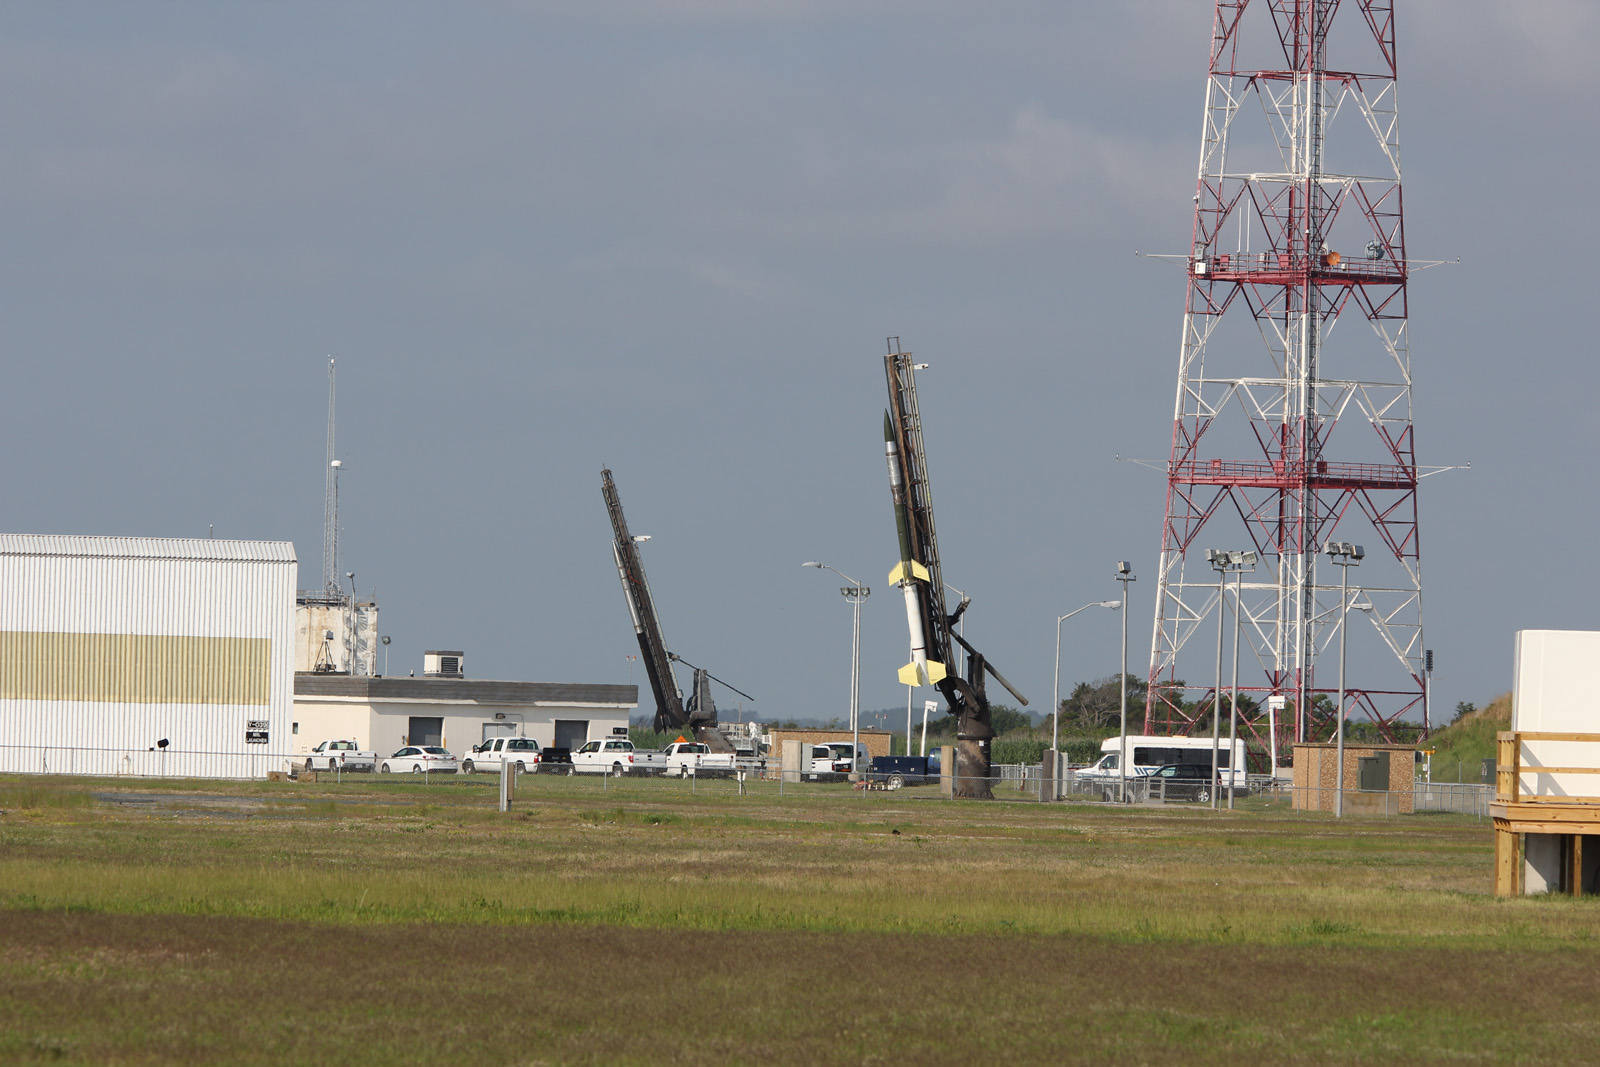
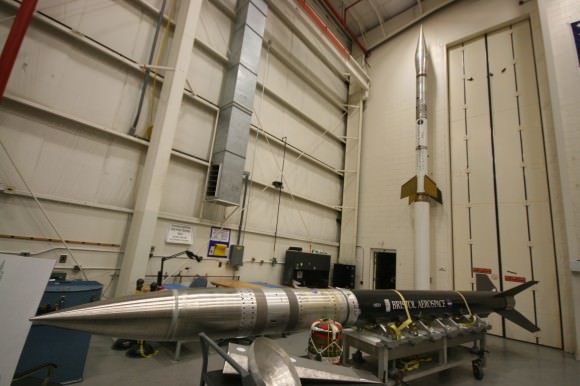
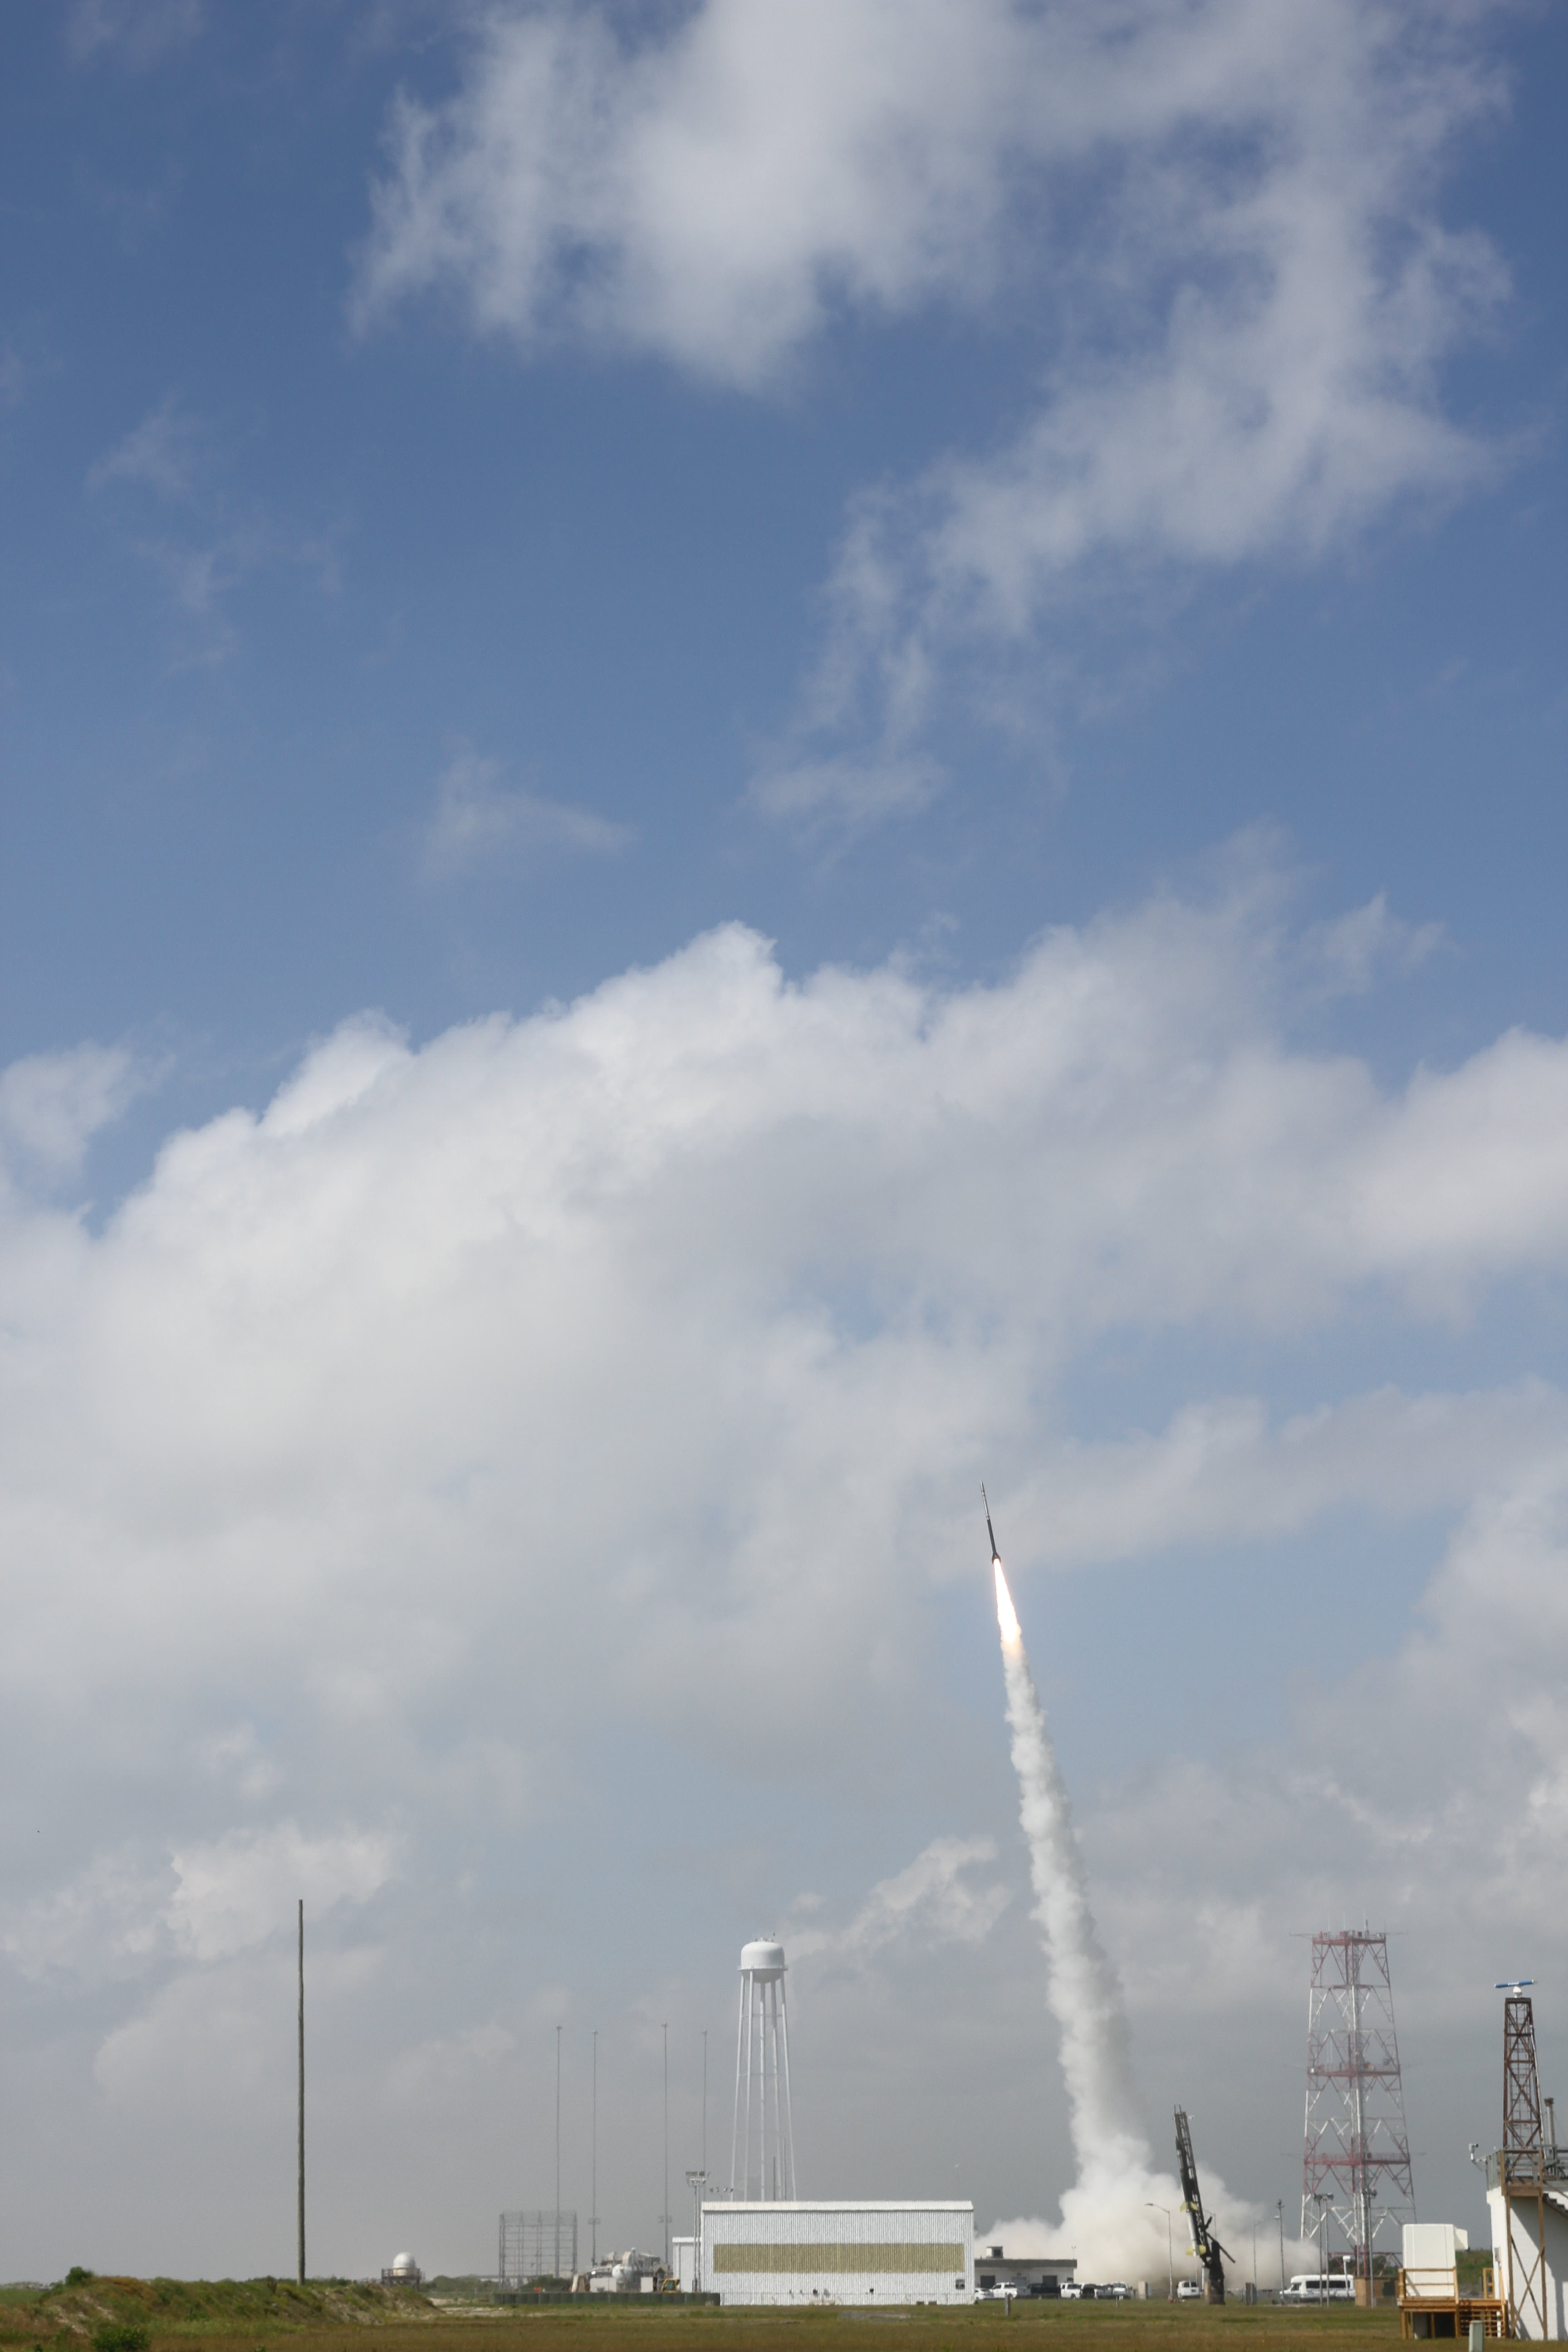
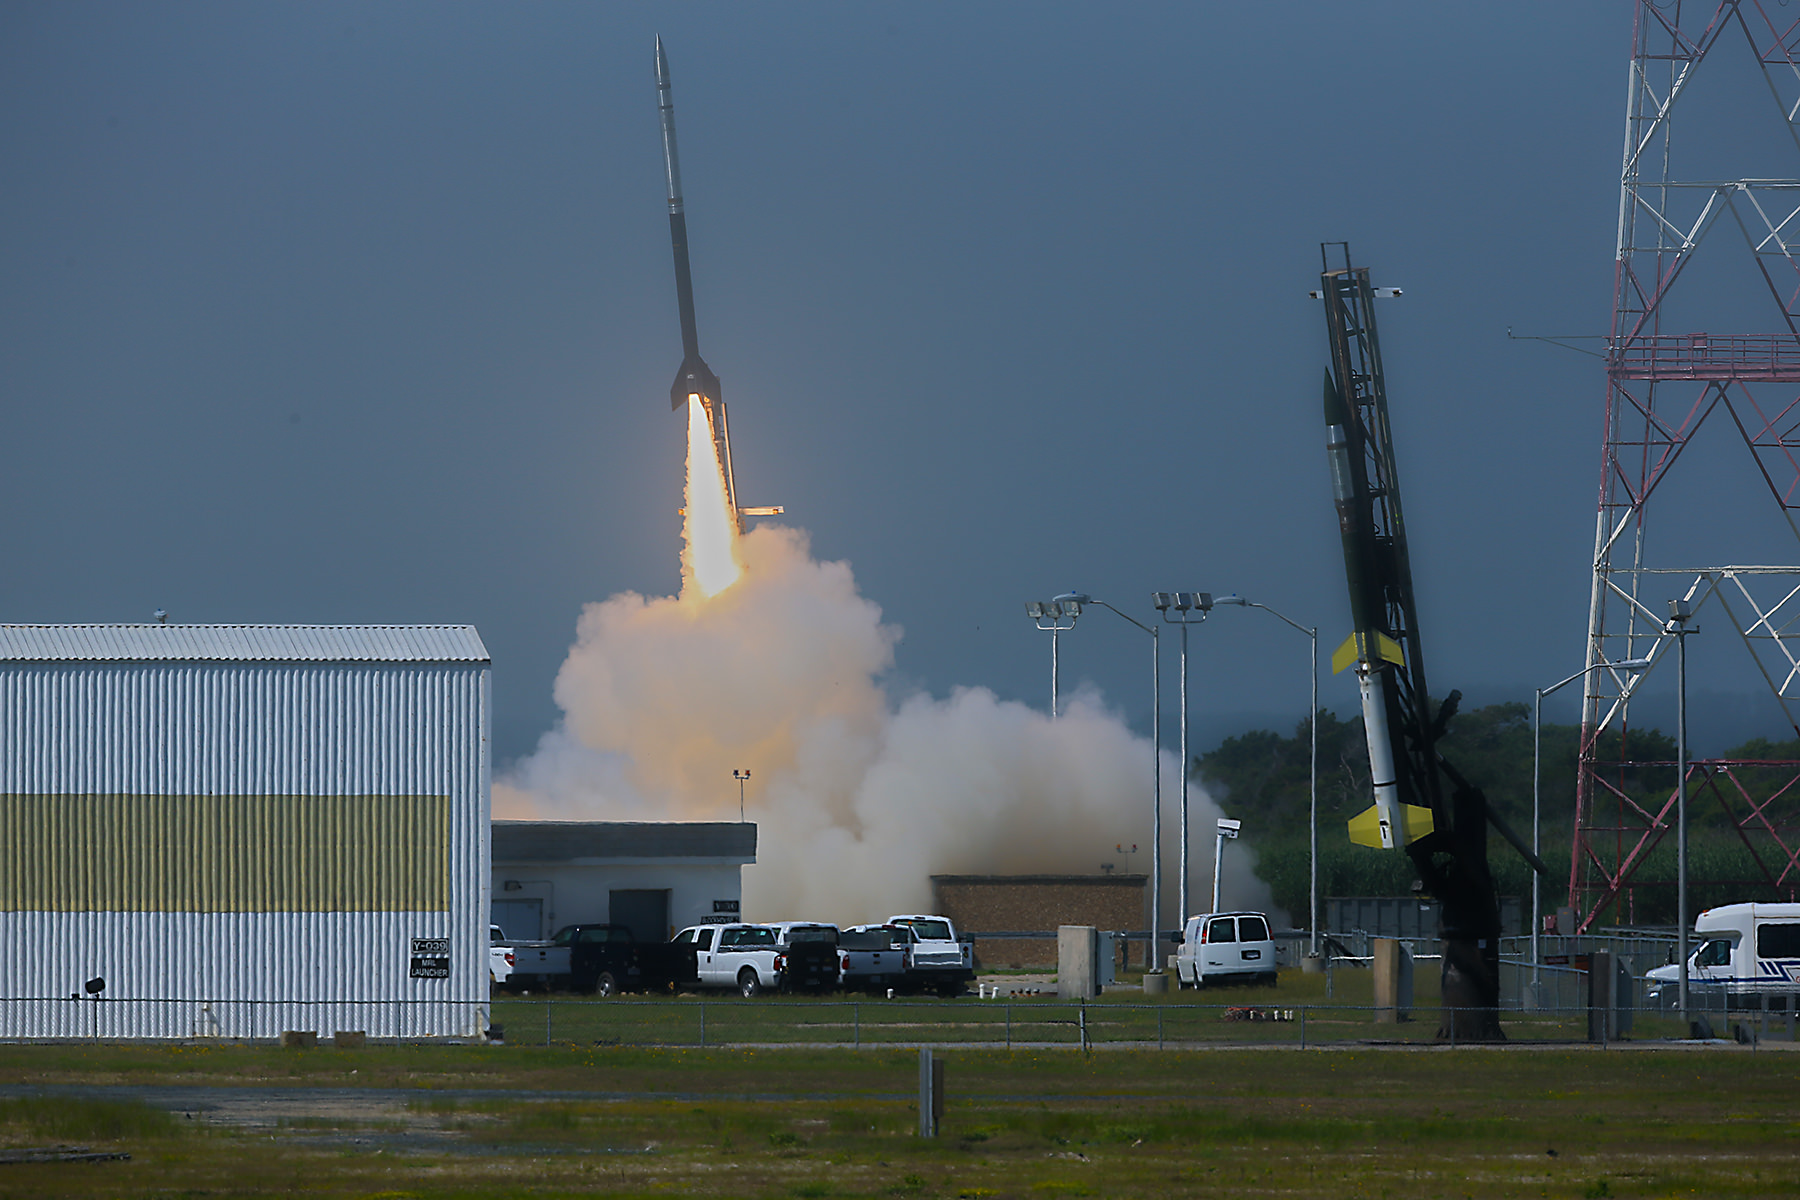
The 35 foot tall single-stage Black Brant V launched first. It carried a 600 pound payload to collect the baseline data to characterize the neutral and charged ionospheric particles as it blasted skyward.
The 33 foot tall two-stage Terrier-Improved Orion took off just 15 seconds later in the wake of the exhaust of the Black Brant V.

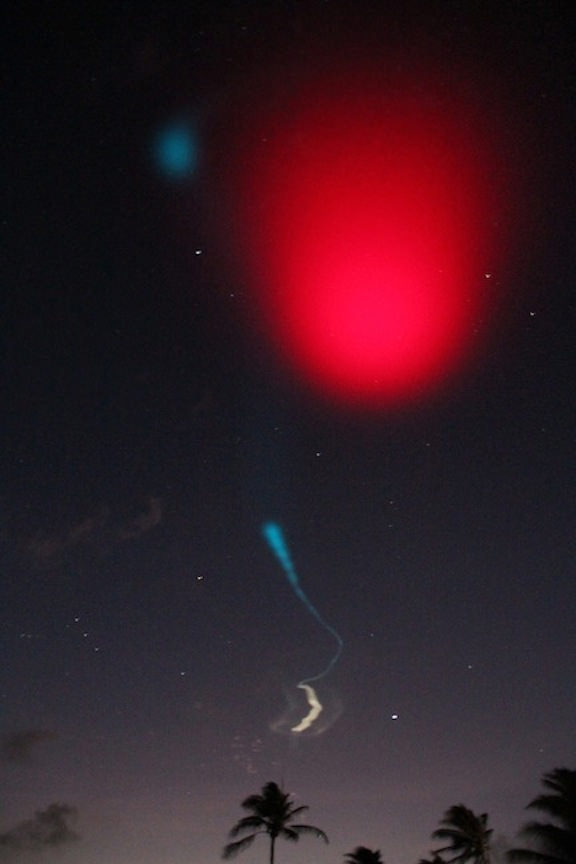
The Terrier-Improved Orion successfully deployed a lengthy trail of lithium gas from a pressurized canister that created a chemical tracer to track how the upper atmospheric winds vary with altitude. These winds are believed to be the drivers of the dynamo currents.
Both rockets fly for about five minutes to an altitude of some 100 miles up in the ionosphere. They both splashed down in the ocean after about 15 minutes.
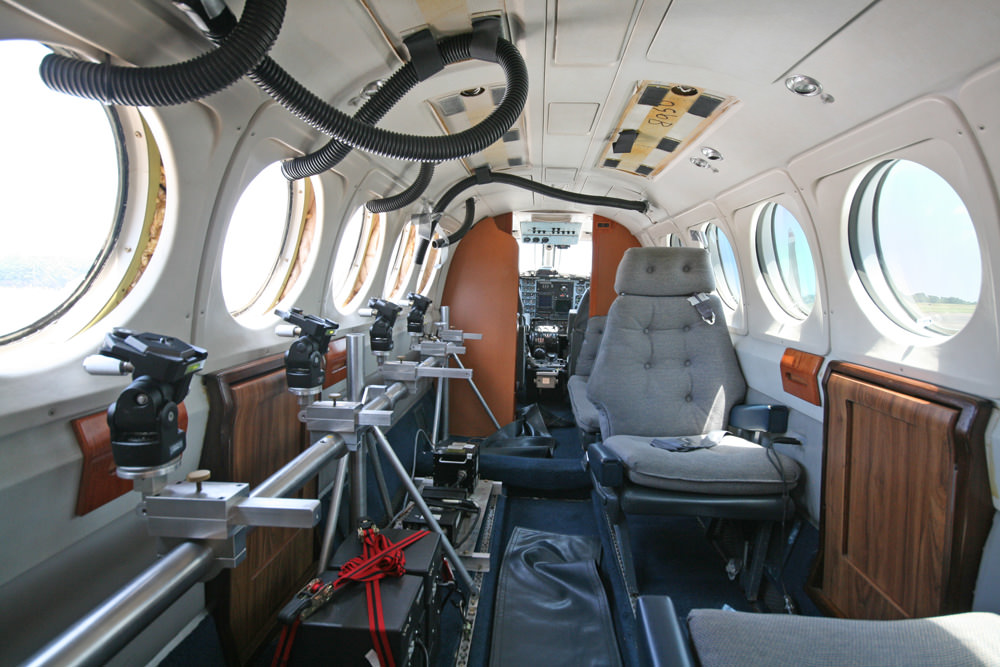
NASA’s King Air aircraft was essential to the mission. I toured the airplane on the Wallops runway for an up-close look inside. It is outfitted with a bank of precisely aimed analytical instruments peering through the aircraft windows to capture the critical science data – see my photos herein.
“The King Air launches about an hour before the scheduled liftoff time,” Pfaff told me.
“It uses special cameras and filters to collect visible and infrared spectroscopic data from the lithium tracer to characterize the daytime dynamo.”
The science instruments are newly developed technology to make the daytime measurements of the lithium tracer and were jointly created by NASA, JAXA and scientists at Clemson University.
“Everything worked as planned,” Pfaff announced from Wallops Mission Control soon after the magnificent Fourth of July fireworks show this morning.