Human Damage to World Oceans Mapped, 40% “Strongly Impacted”

oceanmap_article.thumbnail.jpg

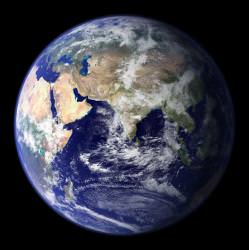
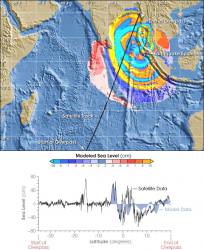
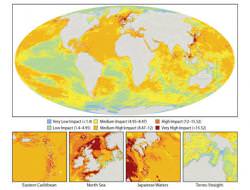
If we needed any more proof that we as a race are damaging the worlds oceans, for the first time, our impact has been mapped by new study to be published in Science. It makes for uncomfortable viewing. Taking 17 known types of human impact on marine ecosystems, this new research suggests that only 4% of the oceans are relatively untouched, whilst 40% are strongly impacted by human activity. The most impacted marine ecosystems include the North Sea, the South and East China Seas, the Caribbean, the Mediterranean, the Red Sea, the Gulf, the Bering Sea, the East coast of North America and in much of the western Pacific.

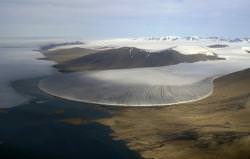
The new, high-resolution map of predominantly yellow regions and red dots could be mistaken for a global temperature map. However, this map is the first of its kind, mapping damaging human activity in the worlds oceans. At first glance it is obvious that most of the oceans have been affected in some way by the continued onslaught of human activity, with only the Polar Regions holding some of the most pristine and untouched seas. These are about the only portions of the map where the reach of human activity cannot grasp, but as global warming increases, the protective ice-sheets are likely to reveal more sea for humankind to exploit.

This new research was released today at the AAAS Annual Meeting and will be published in the February 15th issue of Science. The scientists behind this study are attending a special three day seminar on “Managing Threats to Marine Ecosystems”. Although this work highlights the concerns about damage to our oceans, it may also aid future efforts to preserve areas of low human impact and will help us identify the worst affected regions.

Whether one is interested in protecting ocean wilderness, assessing which human activities have the greatest impact, or prioritizing which ecosystem types need management intervention, our results provide a strong framework for doing so.” – Kimberly Selkoe of the National Center for Ecological Analysis and Synthesis (NCEAS) in Santa Barbara, CA and the University of Hawaii.

The map was created by dividing the Earths oceans into a grid of 1km×1km squares. The 17 contributing human factors were identified (including fishing, coastal development, fertiliser runoff and pollution from shipping traffic) and the extent at which each grid-point was influenced by each contributing factor was calculated. An “impact score” was then allocated at each location to rate how 20 different types of ecosystem are affected by each factor. It was found that an astonishingly high 41% of the oceans had medium-high to high impact ratings. 0.5% had very high impact ratings, representing 2.2 million square km (850,000 square miles).

Although these results may seem grim, it is the first chance scientists have had to evaluate the worst affected oceans, and many appear upbeat about managing the oceans better, preserving what is left of our pristine seas.

Our results show that when these and other individual impacts are summed up, the big picture looks much worse than I imagine most people expected. It was certainly a surprise to me. […] With targeted efforts to protect the chunks of the ocean that remain relatively pristine, we have a good chance of preserving these areas in good condition.” – Ben Halpern, assistant research scientist at the University of California, Santa Barbara, research leader. “

Source: AAAS, Guardian Online

Could Nitrogen Pollution Give Tropical Flora a Much Needed Boost?

greenplants.thumbnail.jpg

Global warming and subsequent climate change is directly linked with human activity on our planet. The greenhouse effect is amplified by our need for energy, burning fossil fuels and pumping vast quantities of CO2 into our atmosphere. To make things worse, the plants that form the Earth’s “lungs” in the tropics are being destroyed on a massive scale, so less carbon dioxide can be scrubbed from the air. However, it’s not all bad news. Industry and agriculture also generate large amounts of excess nitrogen pollution and scientists now believe that this nitrogen (a main ingredient for fertilizer) may help to increase tropical plant growth by up to 20%…

From our high school classes, we all know that green plants, through photosynthesis, absorb atmospheric carbon dioxide. It is essential for plants to flourish. By far the largest absorbers of carbon dioxide are the tropical rainforests in the Amazon basin, central Africa and southern Asia. They are often referred to as the “lungs” of Earth, as they absorb much of the atmospheric CO2 and provide balance to the carbon budget of our climate. If this resource is removed through wholesale deforestation, more CO2 collects in the atmosphere and global warming is amplified by the increase of this greenhouse gas.

However, help may be at hand. Taking the results from over 100 previously published studies, David LeBauer and Kathleen Treseder from the University of California Irvine, believe they have found a trend that suggests a strong link between nitrogen pollution and increased plant growth in tropical regions. Increased plant growth is a welcomed consequence of human activity, as faster plant growth means more plants to absorb more CO2. Although deforestation is a global catastrophe (much of the ancient forests will never recover and a vast proportion of plant and animal species are now extinct), the new research published in Ecology may influence future climate change models.

We hope our results will improve global change forecasts.” – David LeBauer, UCI graduate student researcher of Earth system science and lead author of the study.

Nitrogen pollution comes in many forms, the most obvious being from agricultural activity (fertilizer) polluting water supplies and industrial burning emitting nitrogen into the air. What’s more, nitrogen pollution is on the increase, especially in developing countries.

Nitrogen pollution has often been ignored as a possible growth agent in the tropics, as other fertilizing elements are in short supply (typically, if one element is low, no matter how high the other element is, it will have little or no effect on plant growth). Phosphorus for example, is low in tropical regions, but according to the new research, this doesn’t seem to factor and plant growth is increased by 20% regardless.

LeBauer adds: “What is clear is that we need to consider how nitrogen pollution interacts with carbon dioxide pollution. Our study is a step toward understanding the far-reaching effects of nitrogen pollution and how it may change our climate…” It may only be a step, but at least it’s a positive one.

Source: Physorg.com

Earth’s climate will slip past “tipping point” within 100 years

glacier_greenland_or.thumbnail.jpg

Nine key geographical factors have been highlighted as Earth’s critical climate controllers most at risk of slipping past their “tipping points”. This means that once damage reaches a certain point, there can be no recovery; the damage will continue in a downward spiral, amplifying global warming and environmental damage on historic scales. And as if climate news couldn’t get any worse, one such tipping point is only a year away… 

You can’t move these days for articles about climate change, global warming and environmental disasters. All this talk about impending doom and gloom can often lull you into a detached reverie thinking “what the hell can I do about it anyway?” Although sometimes the outlook seems hopeless, scientists are stepping up a gear to understand what is happening and why humans are having such an impact on our world. In the quest to understand the effects we are having on the planet, new research has drawn up a list of nine key factors and processes likely to change the Earth’s climate most dramatically. It is hoped that once we understand how these processes work, and how long we have until the point of no return, action could be taken to allow the climate to heal.

Prof. Tim Lenton from the University of East Anglia, UK, has identified when the tipping points are likely to occur for the nine key geological factors, and the next one is most likely going to be the collapse of the Indian summer monsoon, which is variable at best. The list is as follows (plus predicted time to tipping point):

  • Arctic sea-ice melt (approx 10 years)
  • Greenland ice sheet decay (more than 300 years)
  • West Antarctic ice sheet decay (more than 300 years)
  • Atlantic thermohaline circulation collapse (approx 100 years)
  • El Nino Southern Oscillation increase (approx 100 years)
  • Indian summer monsoon collapse (approx 1 year)
  • Sahara/Sahel greening and West African monsoon disruption (approx 10 years)
  • Amazon rainforest dieback (approx 50 years)
  • Boreal Forest dieback (approx 50 years)

Many of the factors seem obvious. The melting of the Arctic ice for instance will cause a global rise in sea levels and a loss of ice cover causing Earth’s albedo to decrease (reflectivity decreases), amplifying the greenhouse effect. Also, El Nino in the South Pacific will occur more often, causing rapid and extreme changes in the large-scale weather structure; hurricanes, flooding, droughts and unseasonal shifts in the jet stream will become more and more common.

Some of the factors are perhaps less obvious. For instance, the collapse of the Atlantic thermohaline circulation would have a counter-intuitive effect on the north Atlantic, actually cooling the waters around Europe, North America and the Arctic. The thermohaline drives the circulation of the oceans, so should the Atlantic thermohaline collapse, water from the equator will stop drifting north, providing the warmth at such high latitudes. This effect is unlikely to slow the melting of the Arctic ice-sheets, but it will have devastating effects on biodiversity in the region.

Society must not be lulled into a false sense of security by smooth projections of global change […] Our findings suggest that a variety of tipping elements could reach their critical point within this century under human-induced climate change. The greatest threats are tipping of the Arctic sea-ice and the Greenland ice sheet, and at least five other elements could surprise us by exhibiting a nearby tipping point.” – Prof Lenton

Although worrying, many of the tipping point projections could be averted should strong action be taken by the international community and individuals alike – after all, we can all contribute in some way.

Source: Telegraph.co.uk

Poland “agrees” to host controversial US missile defence system

interceptor-missile-714820.thumbnail.jpg

In a controversial move likely to enflame tensions between Russia, Europe and the US, Poland has agreed (in principal) to host bases for the “Star Wars” US missile shield intended to protect against any future missile attack from rogue nations. Russia totally opposes plans, stating that a European missile system, so close to the Russian border, is akin to the Cuban missile crisis in the 1960s where the US and Soviet Union went to the brink of nuclear war…

Any space missile system intended to neutralize the threat of a nuclear attack from rogue states was bound to cause controversy and anger. As predicted, the future development of a European US missile shield has caused very loud opposition from Russian President Vladimir Putin, directly highlighting that such a move would cause another arms race and could create a nuclear standoff between Russia, US and Europe in between.

The Czech Republic is currently drawing up plans for involvement in the US project and now Poland, a country that directly borders Russia, has agreed to more discussions about installing ten interceptor missiles. The missile shield plans are in a direct response to the ongoing threat from “rogue states”, principally Iran and North Korea, from their nuclear arms development programs the US believes they are still pursuing, but understandably, Russia is suspicious that the US is attempting to gain strategic strength in Eastern Europe. Mr Putin has hinted strongly that although Russia is not planning to begin wholesale targeting of Europe, any “new targets” in the future would be connected to the “strategic nuclear potential of the United States… in Europe” (see BBC article “New era of discord for Russia and West” for full information on the new political unrest). Scary.

We understand that there is a desire for defence modernisation in Poland and particularly for air defence modernisation in Poland. This is something that we support because it will make our ally, Poland, more capable,” – US Secretary of State Condoleezza Rice, supporting the missile defence plan in Poland.

The US missile shield concept depends on European fast response missiles to be launched as soon as the threat of imminent attack is detected from aggressors in the Middle East and beyond. By detecting possible nuclear missiles clearing cloud cover and entering space, radar bases within the EU can track and then guide conventional missiles from the shield network to intercept. Tests of such a system have so far had a mix of success and failure, but with improvement of the “Star Wars” technology (a name first coined in 1983 after announcement by US President Ronald Reagan for the commencement of the “Strategic Defence Initiative”) and rocket engineering, rates of successful interception are bound to increase.

Source: BBC

Are We Living in a New Geologic Epoch?

globe_east_540.thumbnail.jpg

Have humans changed our planet Earth so much in the past 200 years that we are now living in a new geological age? A group of geologists believes this is the case. They have formally proposed designating a new geologic epoch, the Anthropocene, which would encompass the past 200 years or so of geologic history. The action is appropriate, they say, because during the past 2 centuries, human activity has caused most of the major changes in Earth’s topography and climate.

Like rings in a tree, each layer in Earth’s geologic record reflects the conditions of the time it was deposited and offers a glimpse into Earth’s past. In this geologic history that is written in the rocks and soil of our planet, researchers have differentiated the layers into classifications of time called eons, eras, periods, epochs, and ages that reflect characteristic conditions. For example, the Carboniferous period, which lasted from 360 million to 300 million years ago, is known for the vast deposits of coal that formed from jungles and swamps. Even some of the longer stretches have been named based on biology, such as the Paleozoic (“old life”) and the Cenozoic (“recent life”).

Earth has been has always been subject to the same kinds of physical forces–wind, waves, sunlight–throughout the planet’s existence. But the life that has arisen on the planet has had a much more varied impact such as the rise of plants that has shaped the planet in dramatic ways. But in the past 200 years, ever since the human population has reached 1 billion, our influences have affected the composition of Earth’s strata, altering the physical and chemical nature of ocean sediments, ice cores and surface deposits. Some of these influences are the use of fossil fuels and the growth of large cities.

British Geologist Jan Zalasiewicz and several colleagues argue that the International Commission on Stratigraphy should officially mark the end of the current epoch. That would be the Holocene (“entirely recent”), which started after the end of the last ice age, about 10,000 years ago. The new epoch would be the Anthropocene.

The evidence the geologists cite include the dramatic increase in lead concentration in the soil and water since about 1800 and the increase of carbon dioxide in the atmosphere. They claim that human processes now vastly outpace the equivalent natural forces. “A reasonable case can be made for the Anthropocene as a valid formal unit,” Zalasiewicz says.

The argument has merit, says American geologist Richard Alley. “In land, water, air, ice, and ecosystems, the human impact is clear, large, and growing,” he says. “A geologist from the far distant future almost surely would draw a new line, and begin using a new name, where and when our impacts show up.”

Original News Source: AAAS ScienceNow

US Spy Satellite Could Crash To Earth In February

mir_reentry.thumbnail.jpg

After all the excitement surrounding the possibility of asteroid 2007 WD5 hitting Mars and the concern of Near Earth Asteroid 2007 TU24 dropping to Earth, we now have something new (and manmade) to worry about. A US spy satellite has lost power and its orbit has begun to degrade. Officials are sketchy about the details, but the large satellite could survive the burn of re-entry and crash into the surface… but we don’t know where. The satellite might contain dangerous materials… but we can’t be sure. Either way, the dead spy satellite is expected to drop to Earth late February or early March.

This event could prove embarrassing for the US government, as there is little idea where the site of impact will be, sensitive US secrets could be exposed about the technology behind the orbital capabilities of the superpower nation. Officials have declined to comment whether the satellite could be shot down by missile, but this will surely remain an option.

Numerous satellites over the years have come out of orbit and fallen harmlessly. We are looking at potential options to mitigate any possible damage this satellite may cause.” – Spokesman for the National Security Council, Gordon Johndroe

The problem doesn’t stop with the possibility of fatal damage should the satellite fall in the wrong place. An anonymous official has added there may be the possibility the satellite could be carrying hazardous materials. During atmospheric burn-up, this unknown material could be spread over thousands of miles of atmosphere.

This usually isn’t a concern when satellites and other debris are brought to Earth in controlled re-entries. Large defunct satellites can usually have their orbital trajectories finely tuned so they fall safely though the atmosphere and crash into “satellite graveyards” in deep ocean trenches (i.e. the Mir space station was guided out of orbit in 2001 and sunk in the Pacific 6000 km off the Australian coast).

Hopefully a solution to this tricky problem can be found quickly, but it is hoped that most of the satellite will disintegrate during re-entry and any leftovers drop into the ocean… but it would be nice to know if there is a risk of impact anywhere other than the oceans. 

Source: MSNBC.com

Using GPS Could Better Tsunami Warning System

tsunami_jas_2004361.thumbnail.jpg

When there is a tsunami coming towards your home, you want to know about it as far in advance as possible. An early warning about such a disaster could save countless lives, and using Global Positioning System information may just be the way to speed up our reaction time in the future.

The traditional tsunami warning system relies on measuring the magnitude of the earthquake that causes the tsunami. This method is not always reliable, though, as calculating accurately the power of the resulting ocean waves takes hours or days.

For example, 2005 Nias quake near Indonesia was estimated to cause about the same size of tsunami as the powerful 2004 Indian Ocean quake, which destroyed cities in portions of Indonesia, India and Thailand and killed more than 225,000 people. The 2005 tsunami did not nearly meet the same proportions as the earlier quake. There have been five false tsunami alarms between 2005 and 2007, which can reduce the effectiveness of the warnings in the eye of the public.

In a study published in the December Geophysical Research Letters, researcher Y. Tony Song of NASA’s Jet Propulsion Laboratory in Pasadena, California, showed that using GPS from coastal areas near the epicenter of the quake could help more accurately and quickly determine the scale of a tsunami.

Here’s how it would potentially work: data from seismometers near the earthquake’s epicenter is first registered, as in the traditional system. After that, GPS data of the seafloor displacement is factored in, which gives a more complete picture of the extent and power of the earthquake. The size of the predicted tsunami is then quickly calculated and given a number between 1 and 10 – 1 being the lowest – much like the Richter scale. This information could then be passed through the tsunami warning system to evacuate people to safety.

GPS data helps create a 3-dimensional model of the tsunami by giving details about the horizontal and vertical displacement of the seafloor, and this data can be sent and analyzed in minutes from coastal GPS stations. Song’s methods have accurately modeled three previous tsunamis: one in Alaska in 1964, the Indian Ocean tsunami in 2004, and the 2005 Nias tsunami.

Source: JPL Press Release

Regulating Traffic in the Final Frontier

debris.thumbnail.jpg

October of last year was the 50th anniversary of Sputnik, the first spacecraft to be launched into orbit. Since then, we’ve come a long, long way. Think of all the stuff that’s floating around our planet right now: GPS, television, and military satellites, the International Space Station and the Hubble telescope, and a host of debris. With more satellites and projects launching into space, the issue of regulating all of this space traffic is starting to become an issue.

Current regulations of space come from a series of treaties and agreements between nations and organizations, starting with the Outer Space Treaty created 40 years ago. But with private companies like Virgin Galactic merging into space traffic, as well as nations like Japan, India, and China, launching satellites and scientific spacecraft, the need for a defined set of regulations is in order.

“While the current state can be regarded as a “piecemeal engineering”, space traffic management would provide a regulatory “big bang”. Space traffic management would not tackle single issues, but regard the regulation of space activities as a comprehensive concept. This concept is based on functionality, aiming at the provision of a complete set of rules of the road for the current and future way,” wrote Kai-Uwe Schrogl of the European Space Policy Institute in a paper titled “Space traffic management: The new comprehensive approach for regulating the use of outer space – Results from the 2006 IAA cosmic study,” published in the most recent issue of Acta Astronautica.

Space law would be concerned with four areas: keeping tabs on the current space traffic, a system of notification between nations or companies planning launches and missions to space, comprehensive rules for traffic to follow and a way to enforce these rules.

Tracking and notifying are both important to help keep spacecraft from crashing into each other, and would improve the performance of those satellites able to make avoidance maneuvers of space debris. The ISS and Hubble both do this on a regular basis, but other satellites lack the ability to change their orbit on a, so minimizing and tracking the amount of space debris – at least in certain high-traffic areas in Earth’s orbit – is instrumental.

The organizations and means of implementing these rules are still being debated. Possibilities include the creation of World Space Organization, or placing the responsibilities on the shoulders of the existing International Civil Aviation Organization, which currently regulates the skies closer to Earth.

Schrogl writes that a comprehensive space law is a ways off, but the debate about what rules are needed – and how to go about keeping the increasing number of parties launching into space in check – is currently picking up speed. This means that you shouldn’t expect to see any space police pulling over NASA’s Atlantis Shuttle for littering anytime soon.

Source: Acta Astronautica

Study Shows More Antarctic Ice Loss

antarctica.thumbnail.jpg

Increasing amounts of ice mass have been lost from West Antarctica and the Antarctic peninsula over the past ten years, according to a 10-year study from the University of Bristol, England. But at the same time, however, the ice mass in East Antarctica has been roughly stable, with neither loss nor accumulation over the past decade.

Professor Jonathan Bamber at the University of Bristol and colleagues estimated a loss of 132 billion tons of ice in 2006 from West Antarctica “up from about 83 billion tons in 1996” and a loss of about 60 billion tons in 2006 from the Antarctic Peninsula.

“To put these figures into perspective,” Bamber said, “four billion tons of ice is enough to provide drinking water for the whole of the UK population for one year.”

The data comes from satellite imagery that cover 85% of Antarctica’s coastline, which the researchers compared with simulations of snow accumulation over the same period, using a regional climate model.

“Over the 10 year time period of the survey, the ice sheet as a whole was certainly losing mass,” said Bamber, “and the mass loss increased by 75% during this time. Most of the mass loss is from the Amundsen Sea sector of West Antarctica and the northern tip of the Peninsula where it is driven by ongoing, pronounced glacier acceleration.”

In East Antarctica, the mass balance, which accounts for addition to the ice sheet due to snowfall and the subtraction of ice due to changes in the glacier, is near zero. But the thinning of its potentially vulnerable marine sectors suggests this may change in the near future.

As to the differences in the West and East Antarctic ice sheets, Bamber said, “The West Antarctic Ice Sheet is a “marine based” ice sheet resting on bedrock below sea level with bed slopes inclined downward inland. It has been suggested that this makes the WAIS more susceptible to change caused by the ocean than the East Antarctic Ice Sheet.”

The study conclude that the Antarctic ice sheet mass budget is more complex than indicated by the evolution of its surface mass balance or climate-driven predictions.

Changes in glacier dynamics are significant and may in fact dominate the ice sheet mass budget. This conclusion is contrary to model simulations of the response of the ice sheet to future climate change, which conclude that it will grow due to increased snowfall.

Satellite data was obtained from ERS-1, ERS-2, RADARSAT and ALOS.

Original News Source: University of Bristol Press Release

Radioactive Hot Spots on Earth’s Beaches May Have Sparked Life

beach_splash_ioneill.thumbnail.jpg

We’ve heard about life being created in a puddle of primordial chemical soup, sparked by lightning strikes, or organic molecules falling to Earth from comets or planets, such as Mars. But now, there is an alternative. Early Earth was radioactive; the Moon also had a lower orbit, generating strong tidal forces. Due to the close proximity to abundant water, radioactive beaches may have possessed all the essential ingredients for organic compounds, and eventually life, to thrive.

Research by the University of Washington, Seattle, suggests that perhaps the highly radioactive environment of Earth some 4 billion years ago may have been the ideal time for life to form. The orbit of the Moon also had a part to play in this offbeat theory.

Through strong tidal forces by a Moon that orbited far closer to the Earth than it does today, radioactive elements accumulated on the beaches could be gravitationally sorted. The chemical energy in these beach hot spots was probably high enough to allow self-sustaining fission processes (which occurs in natural concentrations of uranium). The main product from fission is heat, therefore powering chemical processes and the generation of organic, life-giving compounds.

“Amino acids, sugars and [soluble] phosphate can all be produced simultaneously in a radioactive beach environment.” – Zachary Adam, an astrobiologist at the University of Washington Seattle.

This is a hard theory to understand, it is well known that radioactivity breaks down organic molecules and causes a whole host of problems for us carbon-based creatures. But in the early Earth, devoid of plants and animals, radioactive processes may have provided energy for life to begin in the first place.

This theory also partially explains why life may be a very rare occurrence in the universe: there must be the correct concentration of radioactive elements, on the surface of a water-dominated developing planet, with tidal forces supplied by a closely orbiting stellar body. The Earth may, after all, be unique.

Source: Telegraph.co.uk