Fears of Tornado Catastrophes Due to Global Warming Unfounded

Tornadoes in the Midwest US, March 2, 2012 Tornadoes swept the Midwest US on March 2, 2012. In this image, clouds are rendered using thermal infrared (heat) and visible imagery from the Geostationary Operational Environmental Satellite-East (GOES-East). Background land information is from the Moderate Resolution Imaging Spectroradiometer (MODIS). Image credit: NOAA-NASA GOES Project/NASA Earth Observatory.

[/caption]

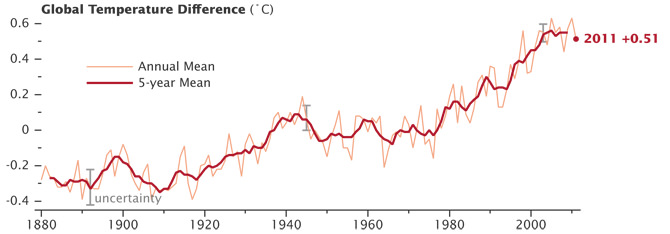
The 2012 tornado season got off to a rousing start. Between February 28th and March 3rd, two deadly storm systems developed in the southern United States. The storms spawned numerous tornadoes that together killed at least 52 people. This kind of extreme tornado activity, so early in the year, has fueled fears that global warming will increase the severity and duration of the tornado season. But, scientific studies show that this is not necessarily to be expected.

Early tornadoes are not unheard of. For example, on February 29 in 1952, two tornadoes caused severe damage in the south-eastern US. But this year, the number of early tornadoes has been much higher. The National Oceanic and Atmospheric Administration reported that in January of 2012, the tornado total was 95, much higher than the 1991–2010 average of 35. And the five-day total for February 28 to March 3 could rank as the highest ever since record-keeping began in 1950, according to meteorologist Dr. Jeff Masters, co-founder of the Weather Underground. With such a record-breaking start, it is not surprising people worry that a more severe 2012 storm season is ahead, and that global warming is to blame.

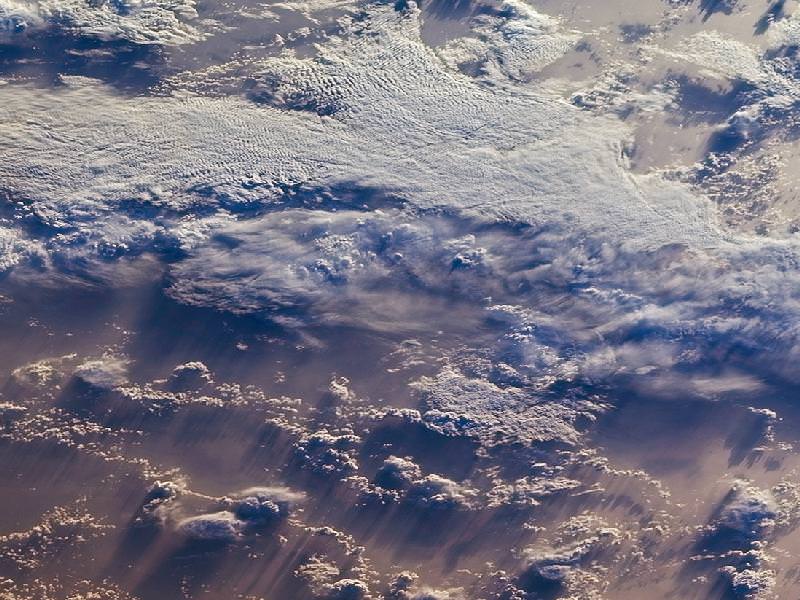
Tornadoes form when warm and moist air from the Gulf of Mexico meets with very cold and dry air above, which was brought south from the arctic. The collision of these air masses, which have different densities, as well as speeds and directions of motion, forces them to want to switch places very rapidly. This creates updrafts of warm and wet air, which produce thunderstorms. And, as the updrafts climb through the atmosphere, they encounter fast- moving jet stream winds, which change speed and direction with altitude. These changes give the updraft a strong twisting motion that spawns tornadoes.

The severity of tornadoes is rated on the Fujita Scale, which examines how much damage is left after a tornado has passed: F0-F1 tornadoes produce minor damage and so are considered weak, F2-F3 tornadoes produce significant damage and are considered strong, and F4-F5 tornadoes produce severe damage and are considered violent. The problem with this ranking is that it is related to a human-based assessment of damage; you need something (buildings, vegetation, etc.) to be destroyed and someone to see the damage. So, a severe tornado that occurs somewhere where there is nothing to be destroyed would be classed as weak, and one that occurs where there is no-one to see the damage wouldn’t even be counted.

National Oceanic and Atmospheric Administration's VORTEX-99 team observed several tornadoes on May 3, 1999, in central Oklahoma. The tube-like funnel is attached at the top to a rotating cloud base and surrounded by a translucent dust cloud near the ground. Image credit: NOAA.

Still, tornado awareness and volunteer reporting programs, along with good record-keeping, have significantly improved our understanding of tornadoes and their frequency. Surprisingly, the Storm Prediction Center’s tornado database, which goes back to 1950, does not show an increasing trend in recent tornadoes. This finding is confirmed by Dr. Stanley Changnon from the University of Illinois at Urbana-Champaign, whose study of insurance industry records was published last year. Dr. Changnon’s work shows that tornado catastrophes and their losses peaked in the years between 1966 and 1973, but have shown no upward trend since that time. In fact, the number of the most damaging storms, those rated as F2 to F5 has actually decreased over the past 5 decades. So, it does not appear that global warming is increasing the number of tornadoes that occur.

This is actually not as surprising as it seems. While a local increase in temperature and humidity, whether caused by global warming or not, would be expected to create more thunderstorms, it is not clear that these thunderstorms would spawn tornadoes. The reason is that global warming does not increase temperatures the same everywhere. Warming at the poles is expected to exceed warming at more southern latitudes. This means that cold polar air will be much less colder than before and warm Gulf of Mexico air will only be slightly warmer. When these two air masses meet above the southern US, the temperature difference between them will not be so great and their drive to swap places will be much less intense. The result will be a significantly slower moving updraft of warm air that is not expected to produce as many extreme thunderstorms or spawn as many tornadoes.

So, global warming is not expected to increase the total frequency of tornado activity. However, warming global temperatures will mean an earlier spring and the potential for earlier tornadoes. In fact, the early tornado numbers we’ve seen so far this year may be a sign of a global warming-induced shift in the tornado season, according to Dr. Masters. If this is the case, the tornado season may start earlier, but it will also end earlier. As meteorologist Harold Brooks from the National Severe Storms Laboratory in Norman, Oklahoma, points out, this record start to the 2012 tornado season does not necessarily mean the rest of the season will be severe.

Sources:
Recap of deadly U.S. tornado outbreak February 28-March 3, 2012, M. Daniel, EarthSky Mar 5, 2012.
NASA Earth Observatory, March 5, 2012.
Temporal distribution of weather catastrophes in the USA, S.A. Changnon, Climatic Change 106 (2), 129-140, 2011, doi: 10.1007/s10584-010-9927-1.
Does Global Warming Influence Tornado Activity? Diffenbaugh et al., EOS 89 (53), 553-554, 2008.

The Sky Is Falling, Scientists Report

Clouds over the southern Indian Ocean, July 23, 2007. (NASA/JPL-Caltech)

[/caption]

Ok, maybe not the sky itself… but the clouds. According to recent research by climate scientists in New Zealand, global cloud heights have dropped.

Researchers at The University of Auckland have reported a decreasing trend in average global cloud heights from 2000 to 2010, based on data gathered by the Multi-angle Imaging SpectroRadiometer (MISR) on NASA’s Terra satellite. The change over the ten-year span was 30 to 40 meters (about 100 to 130 feet), and was mostly due to fewer clouds at higher altitudes.

It’s suspected that this may be indicative of some sort of atmospheric cooling mechanism in play that could help counteract global warming.

“This is the first time we have been able to accurately measure changes in global cloud height and, while the record is too short to be definitive, it provides just a hint that something quite important might be going on,” said lead researcher Professor Roger Davies.

A steady reduction in cloud heights could help the planet radiate heat into space, thus serving as a negative feedback in the global warming process. The exact cause of the drop in cloud altitude is not yet known, but it could reasonably be resulting from a change in circulation patterns that otherwise form high-altitude clouds.

Rendering of the Terra spacecraft. (NASA)

Cloud heights are just one of the many factors that affect climate, and until now have not been able to be measured globally over a long span of  time.

“Clouds are one of the biggest uncertainties in our ability to predict future climate,” said Davies. “Cloud height is extremely difficult to model and therefore hasn’t been considered in models of future climate. For the first time we have been able to accurately measure the height of clouds on a global basis, and the challenge now will be to incorporate that information into climate models. It will provide a check on how well the models are doing, and may ultimately lead to better ones.”

While Terra data showed yearly variations in global cloud heights, the most extreme caused by El Niño and La Niña events in the Pacific, the overall trend for the years measured was a decrease.

Continuing research will be needed to determine future trends and how they may impact warming.

“If cloud heights come back up in the next ten years we would conclude that they are not slowing climate change,” Davies said. “But if they keep coming down it will be very significant.”

The team’s study was recently published in the journal Geophysical Research Letters.

Terra is a multi-national, multi-disciplinary mission involving partnerships with the aerospace agencies of Canada and Japan. An important part of NASA’s Science Mission, Terra is helping scientists around the world better understand and protect our home planet.

Read more on the NASA/JPL news release here.

Ancient Antarctic Ice Sampled In Lake Vostok Drill

Panoramic photo of Vostok Station showing the layout of the camp. Credit: Todd Sowers LDEO, Columbia University, Palisades, New York (Image from physorg.com)

[/caption]

Sealed off for millions of years beneath an almost impenetrable layer of ice, Lake Vostok has kept a vast archive of ancient history waiting for just the right moment to reveal itself. Here is a unique closed ecosystem captured in time below four kilometers of ice. Saved from environmental contamination, its water has been isolated from Earth’s atmosphere, and the outside world, long before man existed. Only one burning question remains… Could this pristine pocket of Lake Vostok show signs of early life?

“According to our research, the quantity of oxygen there exceeds that on other parts of our planet by 10 to 20 times. Any life forms that we find are likely to be unique on Earth,” says Sergey Bulat, the Chief Scientist of Russia’s Antarctic Expedition to Russian Reporter magazine.

So why be so excited over finding a few organisms? The reason is clear as the hidden waters. If a life form could exist here, it could also exist on a similar world…. Jupiter’s satellite, Europa.

“The discovery of microorganisms in Lake Vostok may mean that, perhaps, the first meeting with extra-terrestrial life could happen on Europa,” said Dr Vladimir Kotlyakov, Director of the Geography Institute at the Russian Academy of Sciences to Vzglyad newspaper.

Image from earth.columbia.edu
However, drilling through over 3,700 meters of pure ice hasn’t been an easy process – especially when you’re working in temperatures as low as minus 80 centigrade. The chill thrill drill began in 1970, but it was over 25 years later before Russian specialists discovered the hidden lake beneath the ice sheet. Along with British support, they then began sonar and satellite imagining to reveal one of the world’s largest undisclosed fresh water reservoirs. Now, speculation began in earnest. What might these waters contain? Could it be tiny microbes? Or perhaps even a dangerous organism… There was only one way to find out. Drill and sample.

“Everything but the samples themselves will be carefully decontaminated using radiation. There is no need to worry,” Valeriy Lukin, Head of the Antarctic Expedition told Russian Reporter Magazine. According to researchers at the Russian Arctic and Antarctic Research Institute, they surmise the findings as “the only giant super-clean water system on the planet.” and pristine water will be “twice cleaner than double-distilled water.”

Over the last few decades, there had been a lot of discord over anti-freeze drilling methods – each with its pros and cons. From kerosene to Freon – even hot water – the end result needed to be the same. No chance of contamination… either to the samples or the native environment. As it ended up, the Russian method of using the former turned out to be fine when 40 liters of frozen, pure water came to light on February 4. Just a day later, 1,500 liters of kerosene and Freon poured into special containers with no problems and the sample proved to be immaculate. The clear waters are now safely tucked away in sterile containers and are heading back home.

“I can say that everyone at Bellingshausen on the Antarctic Peninsula could probably tell you down to the meter what the daily progress of the drilling was at the Vostok Station in the center of the continent.” says reporter, Sean Thomas. ” After all, the work at Lake Vostok was a Russian project, at a Russian base with Russian scientists, so there is a lot of pride in the work that is being done there.”

Original Story Source: RT News.

Getting to the Core of Earth’s Falling Snow

Visualization of the GPM Core Observatory and Partner Satellites. Credit: NASA

[/caption]

An international plan is unfolding that will launch satellites into orbit to study global snowfall precipitation with unprecedented detail. With the upcoming Global Precipitation Measurement (GPM) satellites, for the first time we will know when, where and how much snow falls on Earth, allowing greater understanding of energy cycles and how best to predict extreme weather.

Snow is more than just a pretty winter decoration… it’s also a very important contributor to fresh water supply in many regions around the world, especially those areas that rely on spring runoff from mountains.

The snowmelt from the Sierra Nevadas, for example, accounts for a third of the water supply for California.

But changing climate and recent drought conditions have affected how much snow the mountains receive in winter… and thus how much water is released in the spring. Unfortunately, as of now there’s no reliable way to comprehensively detect and measure falling snow from space… whether in the Sierras or the Andes or the Alps.

Engineers are building and testing the GPM Core Observatory at Goddard Space Flight Center. (NASA/GSFC)

The GPM Core satellite, slated to launch in 2014, will change that.

“The GPM Core, with its ability to detect falling snows, it’s one of the very first times that we’ve put sensors in space to specifically look at falling snow,” said GPM Deputy Project Scientist Gail Skofronick-Jackson in an online video. “We’re at that edge where rain was fifty years ago. We’re still figuring out how to measure snow.”

And why is snow such a difficult subject to study?

“Rain tends to be spherical like drops,” says Skofronick-Jackson. “But if you’ve ever been out in a snowfall and you’ve looked at your shirt, you see the snow comes in all different forms.”

Once GPM scientists calculate all the various types of snowflake shapes, the satellite will be able to detect them from orbit.

“The GPM Core, with its additional frequencies and information on the sensors, is going to be able to provide us for the first time a lot more information about falling snow than we’ve ever done before.”

Knowing where and how much snow and rain falls globally is vital to understanding how weather and climate impact both our environment and Earth’s energy cycles, including effects on agriculture, fresh water availability, and responses to natural disasters.

Snowfall is a missing part of the puzzle, and GPM will fill those pieces in.

Find out more about the GPM program at pmm.nasa.gov/GPM.

GPM Core is currently being assembled at NASA’s Goddard Space Flight Center and scheduled to launch in 2014 on a Japanese H-IIA rocket.  Initiated by NASA and the Japanese Aerospace Exploration Agency (JAXA), GPM consists of a consortium of international agencies, including the Centre National d’Études Spatiales (CNES), the Indian Space Research Organization (ISRO), the National Oceanic and Atmospheric Administration (NOAA), the European Organization for the Exploitation of Meteorological Satellites (EUMETSAT), and others. 

Hansen on Climate: “We need to make clear to the public what’s really going on”

Line plot of global mean land-ocean temperature index, 1880 to present, with the base period 1951-1980. The dotted black line is the annual mean and the solid red line is the five-year mean. The green bars show uncertainty estimates. Credit: Hansen et al. (2006).

[/caption]

Editor’s note: This interview is from DailyClimate.org and Climate Query is a semi-weekly feature offered by Daily Climate, presenting short Q&A’s with players large and small in the climate arena. Read other articles in the series more at Climate Query.

NASA’s chief climate scientist James E. Hansen built his career studying Earth’s atmosphere and modeling humans’ potential impacts on climate. Then he realized that laboratory work wasn’t enough. Hansen never thought his decision to study atmospheric models would lead to his arrest. But there he was in handcuffs this summer, protesting at the White House against a pipeline that would carry crude oil from Alberta’s oil sands to the Gulf of Mexico.

It wasn’t the first arrest, either. Hansen, who has directed NASA’s Goddard Institute for Space Studies for 31 years, earned the sobriquet “father of global warming” after testifying before Congress in 1988 on the dangers of global warming. He appeared again in 1989. Then he quietly returned to his work, turning aside television and media requests for the next 15 years because, as he said, “you have no time to do the science if you’re talking to the media.”

That approach changed in 2004, when he realized government climate policies worldwide failed to reflect the dangerous story his science was telling. Emerging from his lab, Hansen attacked Bush Administration officials for censuring and watering down climate findings. In 2008 he testified in British court on behalf of the “Kingsnorth Six,” a group of Greenpeace activists who successfully claimed their effort to shut down a power plant was justified under British law because it prevented the greater harm of climate change. In 2009 and 2010, Hansen was arrested protesting mountaintop-removal coal mining.

Dr. James Hansen, arrested for his participation in a protest calling for abolition of mountaintop mining. Photo: Rich Clemen, Rainforest Action Network Flickr streamt

DailyClimate.org editor Douglas Fischer caught up with Hansen in December at the American Geophysical Union meeting in San Francisco, where the scientist previewed findings about impacts the world courts with its unslacked appetite for carbon-based fuels.

Question: Do you fear you have lost some of your scientific credibility by protesting at the coal plants or by becoming more of a voice in the climate debate?

Hansen: If I was not publishing papers in the peer reviewed literature, then that would be a valid criticism. But I am still publishing. I’m trying to make that science clear to the public. It’s not easy: The scientific evidence has really become very clear, and we’re not doing a very good job of communicating that.

Q: Climate policy has become less a scientific question and more a cultural marker. How can science influence those values and attitudes?

Hansen: We need to make clear to the public what’s really going on. If they just listen to politicians, they don’t understand the story because nothing is being done.

Q: Do reporters ever say, “Look, I can’t touch you as a source because you’re involved in 350.org or the coal plants or these protests”?

Hansen: The fossil fuel industry and those who prefer business as usual – they will use that. But look at my coauthors. I’ve got some of the best scientists in the world.

Q: Let’s flip the question: Do scientists ever say, “Jim, I wish I could get out there the way you are, but I’m afraid, I don’t have the support”?

Hansen: There are consequences of becoming a target. Look at the people who have been the principal targets: Phil Jones, Michael Mann, Ben Santer. Their science has been confirmed. And yet (the attacks) took a toll on them. Of course that’s going to cause other scientists not to step out.

Q: Failure to develop a climate policy isn’t a fault of just one party or one person.

Hansen: That’s right, and that’s not understood. If you say, “Democrats are the ones who favor doing something,” look at the records of the last several administrations: Emissions increased fastest during the Clinton/Gore administration. And (Democrats) proposed a policy that is not going to do anything significant. It’s designed by big banks and it favors big oil and big coal and big utilities.

Q: You’ve never liked a “cap-and-trade” approach.

Hansen: The only way you can solve the problem is with a simple, honest price on carbon. There’s no reason to bring banks into this.

Q: Where’s the clear climate message?

Hansen: Obama could’ve done it if he had started out when he had 70 percent approval and if he followed a policy like Franklin Roosevelt and had fireside chats. It’s not that difficult. It can be explained.

Q: How long can emissions increase before we risk serious impacts?

Hansen: We really should be aiming to keep CO2 no higher than about 350 parts per million and possibly somewhat less than that if we want to maintain stable ice sheets and stable shore lines and avoid many other issues. That would require starting today. We’d have to reduce CO2 emissions at six percent a year if we began next year. If we began five years ago, it would’ve been three percent. If we wait until 2020, it becomes 15 percent.

So if we’re hoping to maintain a planet that looks like the one that humanity has known, we’re out of time right now.

Interview conducted and condensed by Douglas Fischer, DailyClimate.org

NASA Finds 2011 is Ninth-Warmest Year on Record

While average global temperature will still fluctuate from year to year, scientists focus on the decadal trend. Nine of the 10 warmest years since 1880 have occurred since the year 2000, as the Earth has experienced sustained higher temperatures than in any decade during the 20th century. As greenhouse gas emissions and atmospheric carbon dioxide levels continue to rise, scientists expect the long-term temperature increase to continue as well. (Data source: NASA Goddard Institute for Space Studies. Image credit: NASA Earth Observatory, Robert Simmon)

[/caption]

From a NASA press release:

The global average surface temperature in 2011 was the ninth warmest since 1880, according to NASA scientists. The finding continues a trend in which nine of the 10 warmest years in the modern meteorological record have occurred since the year 2000.

NASA’s Goddard Institute for Space Studies (GISS) in New York, which monitors global surface temperatures on an ongoing basis, released an updated analysis that shows temperatures around the globe in 2011 compared to the average global temperature from the mid-20th century. The comparison shows how Earth continues to experience warmer temperatures than several decades ago. The average temperature around the globe in 2011 was 0.92 degrees F (0.51 C) warmer than the mid-20th century baseline.

“We know the planet is absorbing more energy than it is emitting,” said GISS Director James E. Hansen. “So we are continuing to see a trend toward higher temperatures. Even with the cooling effects of a strong La Niña influence and low solar activity for the past several years, 2011 was one of the 10 warmest years on record.”

The difference between 2011 and the warmest year in the GISS record (2010) is 0.22 degrees F (0.12 C). This underscores the emphasis scientists put on the long-term trend of global temperature rise. Because of the large natural variability of climate, scientists do not expect temperatures to rise consistently year after year. However, they do expect a continuing temperature rise over decades.

The first 11 years of the 21st century experienced notably higher temperatures compared to the middle and late 20th century, Hansen said. The only year from the 20th century in the top 10 warmest years on record is 1998.

Global temperatures have warmed significantly since 1880, the beginning of what scientists call the “modern record.” At this time, the coverage provided by weather stations allowed for essentially global temperature data. As greenhouse gas emissions from energy production, industry and vehicles have increased, temperatures have climbed, most notably since the late 1970s. In this animation of temperature data from 1880-2011, reds indicate temperatures higher than the average during a baseline period of 1951-1980, while blues indicate lower temperatures than the baseline average. (Data source: NASA Goddard Institute for Space Studies. Visualization credit: NASA Goddard Space Flight Center Scientific Visualization Studio)

Higher temperatures today are largely sustained by increased atmospheric concentrations of greenhouse gases, especially carbon dioxide. These gases absorb infrared radiation emitted by Earth and release that energy into the atmosphere rather than allowing it to escape to space. As their atmospheric concentration has increased, the amount of energy “trapped” by these gases has led to higher temperatures.

The carbon dioxide level in the atmosphere was about 285 parts per million in 1880, when the GISS global temperature record begins. By 1960, the average concentration had risen to about 315 parts per million. Today it exceeds 390 parts per million and continues to rise at an accelerating pace.

The temperature analysis produced at GISS is compiled from weather data from more than 1,000 meteorological stations around the world, satellite observations of sea surface temperature and Antarctic research station measurements. A publicly available computer program is used to calculate the difference between surface temperature in a given month and the average temperature for the same place during 1951 to 1980. This three-decade period functions as a baseline for the analysis.

The resulting temperature record is very close to analyses by the Met Office Hadley Centre in the United Kingdom and the National Oceanic and Atmospheric Administration’s National Climatic Data Center in Asheville, N.C.

Hansen said he expects record-breaking global average temperature in the next two to three years because solar activity is on the upswing and the next El Niño will increase tropical Pacific temperatures. The warmest years on record were 2005 and 2010, in a virtual tie.

“It’s always dangerous to make predictions about El Niño, but it’s safe to say we’ll see one in the next three years,” Hansen said. “It won’t take a very strong El Niño to push temperatures above 2010.”

For more information:

More information on the GISS temperature analysis
2010: Despite Subtle Differences, Global Temperature Records in Close Agreement (01.13.11)

Desperately Seeking a Snow Day: Why So Little Snow in 2012?

Ah, for the days of Snowmageddon and Snowpocalypse back in 2010 and 2011. So far, 2012 is turning out to be a dud as far as getting a snow day or two off from work or school. Even though the Pacific Northwest in the US just got a major snowstorm, on the whole the US isn’t seeing much snowfall this winter. Why such a difference in just one year? In this ScienceCast, JPL climatologist Bill Patzert explains what’s going on.

A Balanced Budget on Titan

Titan and Dione seen on December 10, 2011 by the Cassini spacecraft. (NASA/JPL/SSI/J. Major)

[/caption]

It’s been said many times that the most Earthlike world in our solar system is not a planet at all, but rather Saturn’s moon Titan. At first it may not seem obvious why; being only a bit larger than the planet Mercury and coated in a thick opaque atmosphere containing methane and hydrocarbons, Titan sure doesn’t look like our home planet. But once it’s realized that this is the only moon known to even have a substantial atmosphere, and that atmosphere creates a hydrologic cycle on its surface that mimics Earth’s – complete with weather, rain, and gully-carving streams that feed liquid methane into enormous lakes – the similarities become more evident. Which, of course, is precisely why Titan continues to hold such fascination for scientists.

Now, researchers have identified yet another similarity between Saturn’s hazy moon and our own planet: Titan’s energy budget is in equilibrium, making it much more like Earth than the gas giant it orbits.

A team of researchers led by Liming Li of the Department of Earth and Atmospheric Sciences at the University of Houston in Texas has completed the first-ever investigation of the energy balance of Titan, using data acquired by telescopes and the Cassini spacecraft from 2004 to 2010.

Energy balance (or “budget”) refers to the radiation a planet or moon receives from the Sun versus what it puts out. Saturn, Jupiter and Neptune emit more energy than they receive, which indicates an internal energy source. Earth radiates about the same amount as it receives, so it is said to be in equilibrium… similar to what is now shown to be the case for Titan.

Blue hazes hover high above thicker orange clouds over Titan's south pole (NASA/JPL/SSI)

The energy absorption and reflection rates of a planet’s – or moon’s! – atmosphere are important clues to the state of its climate and weather. Different balances of energy or changes in those balances can indicate climate change – global cooling or global warming, for instance.

Of course, this doesn’t mean Titan is a balmy world. At nearly 300 degrees below zero (F) it has an environment that even the most extreme Earth-based life would find inhospitable. Although Titan’s atmosphere is ten times thicker than Earth’s its composition is very different, permitting easy passage of infrared radiation (a.k.a. “heat”) and thus exhibits an “anti-greenhouse” effect, unlike Earth or, on the opposite end of the scale, Venus.

Still, some stable process is in place on Saturn’s moon that allows for distribution of solar energy across its surface, within its atmosphere and back out into space. With results due in from Cassini from a flyby on Jan. 2, perhaps there will soon be even more clues as to what that may be.

Read more about Earth’s changing energy budget here.

The team’s report was published in the AGU’s Geophysical Research Letters on December 15, 2011. Li, L., et al. (2011), The global energy balance of Titan, Geophys. Res. Lett., 38, L23201, doi:10.1029/2011GL050053.

Michael Mann on Climate: “There’s Still Time to Make the Right Choices”

Climate scientist Michael Mann from Penn State recently spoke at a TED event, and what he says in this video is nearly the same as in the article I wrote a year ago after hearing Mann speak — but now you can hear it from Mann himself.

The real shame here is that he needs to keep telling these same stories despite the overwhelming scientific evidence for anthropogenic climate change.

Earth’s Magnetic Pole Reversal – Don’t “Flip Out”!

Schematic illustration of Earth's magnetic field. Credit/Copyright: Peter Reid

[/caption]

Have you heard or read stories about how Earth will some day reverse its magnetic poles? If you have, then chances are very good you’ve also heard this perfectly normal function of our planet could spell disaster. Before you buy into another “end of the world as we know it” scenario, let’s take a look at the facts.

For the record, we know that Earth’s magnetic field has changed its polarity more than once in its lifetime. For example, if you could step back in time some 800,000 years ago with a compass in your hand, you’d see the needle pointed to south – instead of north. Why? Because a compass works on magnetic fields, its needle directs you to the magnetic pole, measured as either positive or negative. The markings on the modern compass dial would be incorrect if the polarity of Earth’s magnetic fields were reversed! Like a witch hunt, many would-be prophets say natural occurrences like this might signal doom… But could their theories be correct? Unfortunately for hyperbole, the geologic and fossil records from past reversals show the answer is “No.” We’ll still be around.

Just like the Sun reversing its magnetic poles, Earthly switches are just a part of our planet’s schedule. During about the last 20 million years of our formation, Earth has settled into a pattern of switching magnetic poles about every 200,000 to 300,000 years… with a period of twice that long since our last reversal. And, it’s not a thing that happens rapidly. Magnetic pole reversal takes up to several hundred thousands of years to complete. The fields blend together and magnetic poles pop up at odd latitudes as it happens. It’s not that scary! Scientists say that Earth has reversed its magnetic field hundreds of times over the last three billion years and have sped up slightly with time.

How do we know about the impacts of magnetic pole reversal? We take a look at the deep evidence – sediment cores taken from the ocean floor. These samples are perfect fossil records which show us what direction the magnetic field was pointed in as the underwater lava emerged. These ancient flows were magnetized in the field’s direction at the time of their creation and exist on either side of the Mid-Atlantic Rift where the North American and European continental plates are moving away from each other.

“The last time that Earth’s poles flipped in a major reversal was about 780,000 years ago, in what scientists call the Brunhes-Matuyama reversal. The fossil record shows no drastic changes in plant or animal life.” says NASA’s Patrick Lynch. ” Deep ocean sediment cores from this period also indicate no changes in glacial activity, based on the amount of oxygen isotopes in the cores. This is also proof that a polarity reversal would not affect the rotation axis of Earth, as the planet’s rotation axis tilt has a significant effect on climate and glaciation and any change would be evident in the glacial record.”

A schematic diagram of Earth's interior and the movement of magnetic north from 1900 to 1996. The outer core is the source of the geomagnetic field. Graphic Credit: Dixon Rohr
Unlike a hard-wired magnet, Earth’s polarity isn’t constant – it moves around a bit. The reason we have a magnetic field is our solid iron core surrounding by hot, fluid metal. According to computer modeling, this flow creates electric currents which spawn the magnetic fields. While it’s not possible at this point in time to measure the outer core of our planet directly, we can guess at its movement by the changes in the magnetic field. One such change has occurred for almost 200 years now… Our northern pole has been shifting even more northward. Since it was first located, the pole has shifted its place by more than 600 miles (1,100 km)! What’s more, it’s speeding up. It would seem that it’s moving almost 40 miles per year now, instead of the 10 miles per year as recorded in the early 20th century.

Don’t be fooled by those saying a magnetic pole reversal would leave us temporarily without a magnetic field, either. This is simply isn’t going to happen and we’re not going to be exposed to harmful solar activity. While our magnetic field goes through weaker and stronger phases, there is simply no evidence to be found anywhere that it has ever disappeared completely. Even if it were weakened, our atmosphere would protect us against incoming particles and we’d have more auroral displays at lower latitudes!

So, go ahead… Sleep at night. Earthly magnetic pole reversal is a normal function of our planet and when it does happen its effects will be spread out over hundreds of thousands of years – not flipped like a pancake.

Original Story Source: NASA Earth News. For Further Reading: Earth’s Inconstant Magnetic Field..