The Zooniverse is Expanding: The Milky Way Project Begins Today

The Milky Way Project allows anyone to help catalog bubbles and other interesting features in images taken from a robotic infrared survey. Image Credit: Spitzer/The Milky Way Project

[/caption]

From the folks that brought you the addictive citizen science projects Galaxy Zoo and Moon Zoo (among others), comes yet another way to explore our Universe and help out scientists at the same time. The Milky Way Project invites members of the public to look at images from infrared surveys of our Milky Way and flag features such as gas bubbles, knots of gas and dust and star clusters.

As with the other Zooniverse projects, the participation of the public is a core feature. Accompanying the Milky Way Project is a way for Zooniverse members – lovingly called “zooites” – to discuss the images they’ve cataloged. Called Milky Way Talk, users can submit images they find curious or just plain beautiful to the talk forum for discussion.

The Milky Way Project uses data from the Galactic Legacy Infrared Mid-Plane Survey Extraordinaire (GLIMPSE) and the Multiband Imaging Photometer for Spitzer Galactic Plane Survey (MIPSGAL). These two surveys have imaged the Milky Way in infrared light at different frequencies. GLIMPSE at 3.6, 4.5, 5.8, and 8 microns, and MIPSGAL at 24 and 70 microns. In the infrared, things that don’t emit much visible light – such as large gas clouds excited by stellar radiation – are apparent in images.

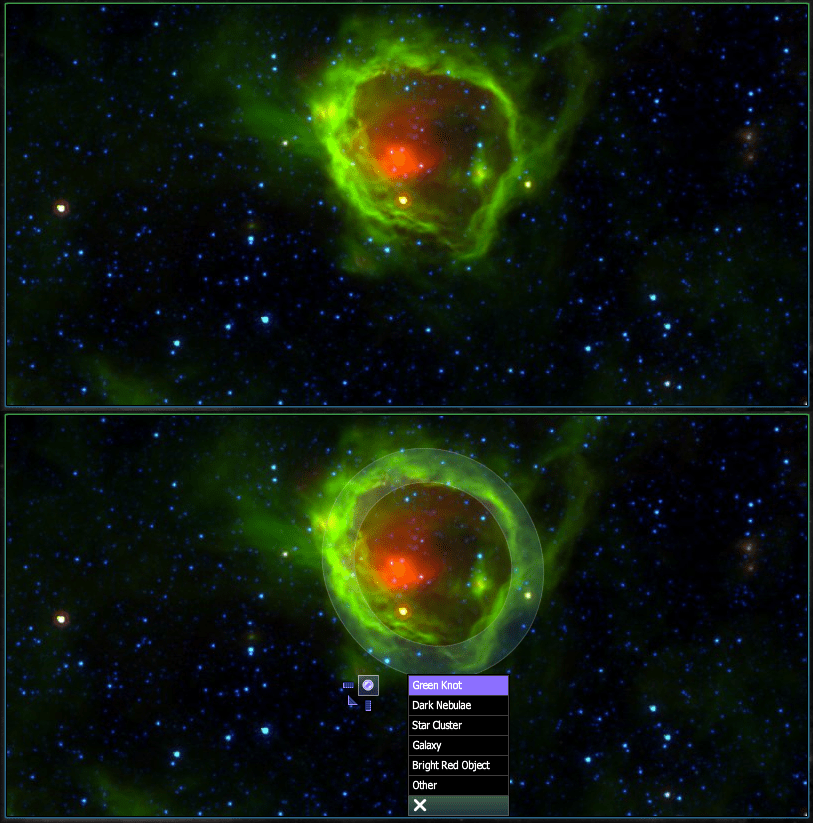
The new project aims at cataloging bubbles, star clusters, knots of gas and dark nebulae. All of these objects are interesting in their own ways.

Bubbles – large structures of gas in the galactic plane – belie areas where young stars are altering the interstellar medium that surrounds them. They heat up the dust and/or ionize the gas that surrounds them, and the flow of particles from the star pushes the diffuse material surrounding out into bubble shapes.

The green knots are where the gas and dust are more dense, and might be regions that contain stellar nurseries. Similarly, dark nebulae – nebulae that appear darker than the surrounding gas – are of interest to astronomers because they may also point to stellar formation of high-mass stars.

Star clusters and galaxies outside of the Milky Way may also be visible in some of the images. Though the cataloging of these objects isn’t the main focus of the project, zooites can flag them in the images for later discussion. Just like in the other Zooniverse projects, which use data from robotic surveys, there is always the chance that you will be the first person ever to look at something in one of the images. You could even be like Galaxy Zoo member Hanny and discover something that astronomers will spend telescope time looking at!

This image is full of objects that are interesting to astronomers for study. You can help them pick out which things to study. Image Credit: Spitzer/The Milky Way Project

The GLIMPSE-MIPSGAL surveys were performed by the Spitzer Space Telescope. Over 440,000 images – all taken in the infrared – are in the catalog and need to be sifted through. This is a serious undertaking, one that cannot be accomplished by graduate students in astronomy alone.

In cataloging these bubbles for subsequent analysis, Milky Way Project members can help astronomers understand both the interstellar medium and the stars themselves imaged by the survey. It will also help them to make a map of the Milky Way’s stellar formation regions.

As with the other Zooniverse projects, this newest addition relies on the human brain’s ability to pick out patterns. Diffuse or oddly-shaped bubbles – such as those that appear “popped” or are elliptical – are difficult for a computer to analyze. So, it’s up to willing members of the public to help out the astronomy community. The Zooniverse community boasts over 350,000 members participating in their various projects.

A little cataloging and research of these gas bubbles has already been done by researchers. The Milky Way Project site references work by Churchwell, et. al, who cataloged over 600 of the bubbles and discovered that 75% of the bubbles they looked at were created by type B4-B9 stars, while 0-B3 stars make up the remainder (for more on what these stellar types mean, click here).

A zoomable map that uses images from the surveys – and has labeled a lot of the bubbles that have been already cataloged by the researchers- is available at Alien Earths.

For an extensive treatment of just how important these bubbles are to understanding stars and their formation, the paper “IR Dust Bubbles: Probing the Detailed Structure and Young Massive Stellar Populations of Galactic HII Regions” by Watson, et. al is available here.

If you want to get cracking on drawing bubbles and cataloging interesting features of our Milky Way, take the tutorial and sign up today.

Sources: The Milky Way Project, Arxiv, GLIMPSE

Galaxy Zoo Searches for Supernovae

Aside from categorizing galaxies, another component of the Galaxy Zoo project has been asking participants to identify potential supernovae (SNe). The first results are out and have identified “nearly 14,000 supernova candidates from [Palomar Transient Factory, (PTF)] were classified by more than 2,500 individuals within a few hours of data collection.”

Although the Galaxy Zoo project is the first to employ citizens as supernova spotters, the background programs have long been in place but were generating vast amounts of data to be processed. “The Supernova Legacy Survey used the MegaCam instrument on the 3.6m Canada-France-Hawaii Telescope to survey 4 deg2” every few days, in which “each square degree would typically generate ~200 candidates for each night of observation.” Additionallly, “[t]he Sloan Digital Sky Survey-II Supernova Survey used the SDSS 2.5m telescope to survey a larger area of 300 deg2” and “human scanners viewed 3000-5000 objects each night spread over six scanners”.

To ease this burden, the highly successful Galaxy Zoo implemented a Supernova Search in which users would be directed through a decision tree to help them determine what computer algorithms were proposing as transient events. Each image would be viewed and decided on by several participants increasing the likelihood of a correct appraisal. Also, “with a large number of people scanning candidates, more candidates can be examined in a shorter amount of time – and with the global Zooniverse (the parent project of Galaxy Zoo) user base this can be done around the clock, regardless of the local time zone the science team happens to be based in” allowing for “interesting candidates to be followed up on the same night as that of the SNe discovery, of particular interest to quickly evolving SNe or transient sources.”

To identify candidates for viewing, images are taken using the 48 inch Samuel Oschin telescope at the
Palomar Observatory. Images are then calibrated to correct instrumental noise and compared automatically to reference images. Those in which an object appears with a change greater than five standard deviations from the general noise are flagged for inspection. While it may seem that this high threshold would eliminate other events, the Supernova Legacy Survey, starting with 200 candidates per night, would only end up identifying ~20 strong candidates. As such, nearly 90% of these computer generated identifications were spurious, likely generated by cosmic rays striking the detector, objects within our own solar system, or other such nuisances and demonstrating the need for human analysis.

Still, the PTF identifies between 300 and 500 candidates each night of operation. When exported to the Galaxy Zoo interface, users are presented with three images: The first is the old, reference image. The second is the recent image, and the third is the difference between the two, with brightness values subtracted pixel for pixel. Stars which didn’t change brightness would be subtracted to nothing, but those with a large change (such as a supernova), would register as a still noticeable star.

Of course, this method is not flawless, which also contributes to the false positives from the computer system that the decision tree helps weed out. The first question (Is there a candidate centered in the crosshairs of the right-hand [subtracted] image?) eliminates misprocessing by the algorithm due to misalignment. The second question (Has the candidate itself subtracted correctly?) serves to drop stars that were so bright, they saturated the CCD, causing odd errors often resulting in a “bullseye” pattern. Third (Is the candidate star-like and approximately circular?), users eliminate cosmic ray strikes which generally only fill one or two pixels or leave long trails (depending on the angle at which they strike the CCD). Lastly, users are asked if “the candidate centered in a circular host galaxy?” This sets aside identifications of variable stars within our own galaxy that are not events in other galaxies as well as supernovae that appear in the outskirts of their host galaxies.

Each of these questions is assigned a number of positive or negative “points” to give an overall score for the identification. The higher the score, the more likely it is to be a true supernova. With the way the structure is set up, “candidates can only end up with a score of -1, 1 or 3 from each classification, with the most promising SN candidates scored 3.” If enough users rank an event with the appropriate score, the event is added to a daily subscription sent out to interested parties.

To confirm the reliability of identifications, the top 20 candidates were followed up spectroscopically with the 4.2m William Herschel Telescope. Of them, 15 were confirmed as SNe, with 1 cataclysmic variable, and 4 remain unknown. When compared to followup observations from the PTF team, the Galaxy Zoo correctly identified 93% of supernova that were confirmed spectroscopically from them. Thus, the identification is strong and this large volume of known events will certainly help astronomers learn more about these events in the future.

If you’d like to join, head over to their website and register. Presently, all supernovae candidates have been processed, but the next observing run is coming up soon!

PSA: Bars Kill Galaxies

Barred Spiral Galaxy NGC 6217

[/caption]

Many spiral galaxies are known to harbor bars. Not the sort in which liquor is served as a social lubricant, but rather, the kind in which gas is served to the central regions of a galaxy. But just as recent studies have identified alcohol as one of the most risky drugs, a new study using results from the Galaxy Zoo 2 project have indicated galactic bars may be associated with dead galaxies as well.

The Galaxy Zoo 2 project is the continuation of the original Galaxy Zoo. Whereas the original project asked participants to categorize galaxies into Hubble Classifications, the continuation adds the additional layer of prompting users to provide further classification including whether or not the nearly quarter of a million galaxies showed the presence of a bar. While relying on only quickly trained volunteers may seem like a risky venture, the percentage of galaxies reported to have bars (about 30%) was in good agreement with previous studies using more rigorous methods.

The new study, led by Karen Masters of the Institute of Cosmology and Gravitation at the University of Portsmouth, analyzed the presence or lack of bars in relation to other variables, such as “colour, luminosity, and estimates of the bulge size, or prominence.” When looking to see if the percent of galaxies with bars evolved over the redshifts observed, the team found no evidence that this had changed in the sample (the GZ2 project contains galaxies to a lookback time of ~6 billion years).

When comparing the fraction with bars to the overall color of the galaxy, the team saw strong trends. In blue galaxies (which have more ongoing star formation) only about 20% of galaxies contained bars. Meanwhile, red galaxies (which contain more older stars) had as many as 50% of their members hosting bars. Even more striking, when the sample was further broken down into grouping by overall galaxy brightness, the team found that dimmer red galaxies were even more likely to harbor bars, peaking at ~70%!

Before considering the possible implications, the team stopped to consider whether or not there was some inherent biasing in the selection based on color. Perhaps bars just stood out more in red galaxies and the ongoing star formation in blue galaxies managed to hide their presence? The team referenced previous studies that determined visual identification for the presence of bars was not hindered in the wavelengths presented and only dipped in the ultraviolet regime which was not presented. Thus, the conclusion was deemed safe.

While the findings don’t establish a causal relationship, the connection is still apparent: If a galaxy has a bar, it is more likely to lack ongoing star formation. This discovery could help astronomers understand how bars form in the first place. Given both structure, such as bars and spiral arms, and star formation are associated with galactic interactions, the expectation would be that we should observe more bars in galaxies in which interactions have caused them to form as well as triggering star formation. As such, this study helps to constrain modes of bar formation. Another possible connection is the ability of bars to assist in movement of gas, potentially shuttling and shielding it from being accessible for formation. As Masters states, “It’s not yet clear whether the bars are some side effect of an external process that turns spiral galaxies red, or if they alone can cause this transformation. We should get closer to answering that question with more work on the Galaxy Zoo dataset.”

What Hanny’s Voorwerp Reveals About Quasar Deaths

The green "blob" is Hanny's Voorwerp. Credit: Dan Herbert, Peter Smith, Matt Jarvis, Galaxy Zoo Team, Isaac Newton Telescope

[/caption]

Hanny’s Voorwerp is a popular topic of conversation due to its novel discovery by Hanny Van Arkel perusing images from the Galaxy Zoo project. The tale has become so well known, it was made into a comic book (view here as .pdf, 35MB). But another aspect of the story is how enigmatic the object is. Objects that are so green are rare and it lacked a direct power source to energize it. It was eventually realized a quasar in the neighboring galaxy, IC 2497 could supply the necessary energy. Yet images of the galaxy couldn’t confirm a sufficiently energetic quasar. A new paper discusses what may have happened to the source.


The evidence that a quasar must be involved comes from the green color of the voorwerp itself. Spectra of the object has shown that this coloration is due to a strong level of ionized oxygen, specifically the λ5007 line of O III. While other scenarios could account for this feature alone, the spectra also contained He II emission as well as Ne V and the lines were especially narrow. Should star formation or shockwaves energize the gas, the motions would cause Doppler broadening. An quasar powered Active Galactic Nucleus (AGN) was the best fit.

But when telescopes searched for this quasar in the galaxy, it proved elusive. Optical images from WIYN Observatory were unable to resolve the expected point source. Radio observations discovered an object emitting in this range, but far below the amount of energy necessary to power the luminous Voorwerp. Two solutions have been proposed:

“1) the quasar in IC 2497 features a novel geometry of obscuring material and is obscured at an unprecedented level only along our line of sight, while being virtually unobscured towards the Voorwerp; or 2) the quasar in IC 2497 has shut down within the last 70,000 years, while the Voorwerp remains lit up due to the light travel time from the nucleus.”

Recent observations from Suzaku have ruled out the first of these possibilities due to the lack of potassium absorption that would be expected if light from the galaxy were being absorbed in a significant amount. Thus, the conclusion is that the AGN has dropped in total output by at least two orders of magnitude, but more likely by four. In many ways, this is not entirely unexpected since quasars are plentiful in the distant universe where raw material on which to feed was more plentiful. In the present universe, quasars rarely have such material available and can’t maintain it indefinitely.

Analogs exist within our own galaxy. X-Ray Binaries (XRBs) are stellar mass black holes which form similar accretion disks and can shut down and excite on short timescales (~1 year). The authors of the new paper attempted to scale up a model XRB system to determine if the timescales would fit with the ~70,000 year upper limit imposed by the travel time. While they found a good agreement with the output from direct accretion itself (10,000–100,000 years) the team found a discrepancy in the disk. In XRBs, the material around the black hole is heated as well, and takes some time to cool down. In this case, the core of the galaxy should still retain a hot disc of material which isn’t present.

This oddity demonstrates that there is still a large amount of knowledge to be gained on the physics surrounding these objects. Fortunately, the relatively close proximity of IC 2497 allows for the potential for detailed followup studies.

Virtual Observatory Discovers New Cataclysmic Variable

Simulation of Intermediate Polar CV star
Simulation of Intermediate Polar CV star (Dr Andy Beardmore, Keele University)

[/caption]

In my article two weeks ago, I discussed how data mining large surveys through online observatories would lead to new discoveries. Sure enough, a pair of astronomers, Ivan Zolotukhin and Igor Chilingarian using data from the Virtual Observatory, has announced the discovery of a cataclysmic variable (CV).


Cataclysmic variables are often called “novae”. However, they’re not a single star. These stars are actually binary systems in which their interactions cause large increases in brightness as matter is accreted from a secondary (usually post main-sequence) star, onto a white dwarf. The accretion of matter piles up on the surface until the it reaches a critical density and undergoes a brief but intense phase of fusion increasing the brightness of the star considerably. Unlike type Ia supernovae, this explosion doesn’t meet the critical density required to cause a core collapse.

The team began by considering a list of 107 objects from the Galactic Plane Survey conducted by the Advanced Satellite for Cosmology and Astrophysics (ASCA, a Japanese satellite operating in the x-ray regime). These objects were exceptional x-ray emitters that had not yet been classified. While other astronomers have done targeted investigations of individual objects requiring new telescope time, this team attempted to determine whether any of the odd objects were CVs using readily available data from the Virtual Observatory.

Since the objects were all strong x-ray sources, they all met at least one criteria of being a CV. Another was that CV stars often are strong emitters for Hα since the eruptions often eject hot hydrogen gas. To analyze whether or not any of the objects were emitters in this regime, the astronomers cross referenced the list of objects with data from the Isaac Newton Telescope Photometric Hα Survey of the northern Galactic plane (IPHAS) using a color-color diagram. In the field of view of the IPHAS survey that overlapped with the region from the ASCA image for one of the objects, the team found an object that emitted strongly in the Hα. But in such a dense field and with such different wavelength regimes, it was difficult to identify the objects as the same one.

To assist in determining if the two interesting objects were indeed the same, or whether they just happened to lie nearby, the pair turned to data from Chandra. Since Chandra has much smaller uncertainty in the positioning (0.6 arcsecs), the pair was able to identify the object and determine that the interesting object from IPHAS was indeed the same one from the ASCA survey.

Thus, the object passed the two tests the team had devised for finding cataclysmic variables. At this point, followup observation was warranted. The astronomers used the 3.5-m Calar Alto telescope to conduct spectroscopic observations and confirmed that the star was indeed a CV. In particular, it looked to be a subclass in which the primary white dwarf star had a strong enough magnetic field to disrupt the accretion disk and the point of contact is actually over the poles of the star (this is known as a intermediate polar CV).

This discovery is an example of how discoveries are just waiting to happen with data that’s already available and sitting in archives, waiting to be explored. Much of this data is even available to the public and can be mined by anyone with the proper computer programs and know-how. Undoubtedly, as organization of these storehouses of data becomes organized in more user friendly manners, additional discoveries will be made in such a manner.

New Galaxy Zoo Project Crowd-sources Old Climate Data

The newest citizen science project from the Galaxy Zoo team lets the public travel back in time and join the crews of over 280 different World War I royal navy warships. While an engaging historical journey, the project will help scientists better understand the climate of the past. There are gaps in weather and climate data records, particularly before 1920, prior to when weather station observations were accurately recorded. But old naval ships routinely recorded the weather they encountered – marking down temperatures and conditions even while in battle. The information in many of these weather logbooks has not been utilized – until now, as the “Old Weather” project has made its debut as the newest way for the public to contribute in scientific research.

The project is designed to provide a detailed map of the world’s climate around 100 years ago, which will help tell us more about the climate today. Anyone can take part, read the logs, follow events aboard the vessels and contribute to this fun and historical project, which could tell us more about our climate’s future.

“These naval logbooks contain an amazing treasure trove of information but because the entries are handwritten they are incredibly difficult for a computer to read,’ said Dr. Chris Lintott of Oxford University, a Galaxy Zoo founder and developer of the OldWeather.org project. “By getting an army of online human volunteers to retrace these voyages and transcribe the information recorded by British sailors we can relive both the climate of the past and key moments in naval history.”

By transcribing information about weather, and any interesting events, from images of each ship’s logbook web volunteers will help scientists to build a more accurate picture of how our climate has changed over the last century, as well as adding to our knowledge of this important period of British history.

HMS Acacia, one of the ships in the Old Weather project.

“Historical weather data is vital because it allows us to test our models of the Earth’s climate,”said Dr. Peter Stott, Head of Climate Monitoring and Attribution at the British meteorology, or Met Office. “If we can correctly account for what the weather was doing in the past, then we can have more confidence in our predictions of the future. Unfortunately, the historical record is full of gaps, particularly from before 1920 and at sea, so this project is invaluable.”

Weather observations by Royal Navy sailors were made every four hours without fail, said Dr. Robert Simpson of Oxford University, who added that this project is almost like “launching a weather satellite into the skies at a time when manpowered flight was still in its infancy.”

What is Old Weather from National Maritime Museum on Vimeo.

If you are not yet familiar yet with the Zooniverse, which includes citizen science projects like Galaxy Zoo and Moon Zoo, you are really missing out on a fun and engaging way to do actual, meaningful science. In those projects, 320,000 people have made over 150 million classifications and published several scientific papers – which shown that ordinary web users can make observations that are as accurate as those made by experts.

Old Weather is unique among the eight scientific projects encompassed by the Zooniverse because of how old the data is, and participating really is a trip back in time. The ‘virtual sailors’ visiting OldWeather.org are rewarded for their efforts by a rise through the ratings from cadet to captain of a particular ship according to the number of pages they transcribe. Historians are also hoping that a look into these old records will provide a fresh insight into naval history and encourage people to find out more about the past.

Here’s a tutorial on how to participate in Old Weather:

Old Weather – Getting Started from The Zooniverse on Vimeo.

To find out more, and participate visit OldWeather.org. There’s also an Old Weather blog at http://blogs.zooniverse.org/oldweather

You can also follow the project on Twitter (@OldWeather) and Facebook.

Astronomy: The Next Generation

Future Tense
Future Tense

In some respects, the field of astronomy has been a rapidly changing one. New advances in technology have allowed for exploration of new spectral regimes, new methods of image acquisition, new methods of simulation, and more. But in other respects, we’re still doing the same thing we were 100 years ago. We take images, look to see how they’ve changed. We break light into its different colors, looking for emission and absorption. The fact that we can do it faster and to further distances has revolutionized our understanding, but not the basal methodology.

But recently, the field has begun to change. The days of the lone astronomer at the eyepiece are already gone. Data is being taken faster than it can be processed, stored in easily accessible ways, and massive international teams of astronomers work together. At the recent International Astronomers Meeting in Rio de Janeiro, astronomer Ray Norris of Australia’s Commonwealth Scientific and Industrial Research Organization (CSIRO) discussed these changes, how far they can go, what we might learn, and what we might lose.

Observatories
One of the ways astronomers have long changed the field is by collecting more light, allowing them to peer deeper into space. This has required telescopes with greater light gathering power and subsequently, larger diameters. These larger telescopes also offer the benefit of improved resolution so the benefits are clear. As such, telescopes in the planning stages have names indicative of immense sizes. The ESO’s “Over Whelmingly Large Telescope” (OWL), the “Extremely Large Array” (ELA), and “Square Kilometer Array” (SKA) are all massive telescopes costing billions of dollars and involving resources from numerous nations.

But as sizes soar, so too does the cost. Already, observatories are straining budgets, especially in the wake of a global recession. Norris states, “To build even bigger telescopes in twenty years time will cost a significant fraction of a nation’s wealth, and it is unlikely that any nation, or group of nations, will set a sufficiently high priority on astronomy to fund such an instrument. So astronomy may be reaching the maximum size of telescope that can reasonably be built.”

Thus, instead of the fixation on light gathering power and resolution, Norris suggests that astronomers will need to explore new areas of potential discovery. Historically, major discoveries have been made in this manner. The discovery of Gamma-Ray Bursts occurred when our observational regime was expanded into the high energy range. However, the spectral range is pretty well covered currently, but other domains still have a large potential for exploration. For instance, as CCDs were developed, the exposure time for images were shortened and new classes of variable stars were discovered. Even shorter duration exposures have created the field of asteroseismology. With advances in detector technology, this lower boundary could be pushed even further. On the other end, the stockpiling of images over long times can allow astronomers to explore the history of single objects in greater detail than ever before.

Data Access
In recent years, many of these changes have been pushed forward by large survey programs like the 2 Micron All Sky Survey (2MASS) and the All Sky Automated Survey (ASAS) (just to name two of the numerous large scale surveys). With these large stores of pre-collected data, astronomers are able to access astronomical data in a new way. Instead of proposing telescope time and then hoping their project is approved, astronomers are having increased and unfettered access to data. Norris proposes that, should this trend continue, the next generation of astronomers may do vast amounts of work without even directly visiting an observatory or planning an observing run. Instead, data will be culled from sources like the Virtual Observatory.

Of course, there will still be a need for deeper and more specialized data. In this respect, physical observatories will still see use. Already, much of the data taken from even targeted observing runs is making it into the astronomical public domain. While the teams that design projects still get first pass on data, many observatories release the data for free use after an allotted time. In many cases, this has led to another team picking up the data and discovering something the original team had missed. As Norris puts it, “much astronomical discovery occurs after the data are released to other groups, who are able to add value to the data by combining it with data, models, or ideas which may not have been accessible to the instrument designers.”

As such, Nelson recommends encouraging astronomers to contribute data to this way. Often a research career is built on numbers of publications. However, this runs the risk of punishing those that spend large amounts of time on a single project which only produces a small amount of publication. Instead, Nelson suggests a system by which astronomers would also earn recognition by the amount of data they’ve helped release into the community as this also increases the collective knowledge.

Data Processing
Since there is a clear trend towards automated data taking, it is quite natural that much of the initial data processing can be as well. Before images are suitable for astronomical research, the images must be cleaned for noise and calibrated. Many techniques require further processing that is often tedious. I myself have experienced this as much of a ten week summer internship I attended, involved the repetitive task of fitting profiles to the point-spread function of stars for dozens of images, and then manually rejecting stars that were flawed in some way (such as being too near the edge of the frame and partially chopped off).

While this is often a valuable experience that teaches budding astronomers the reasoning behind processes, it can certainly be expedited by automated routines. Indeed, many techniques astronomers use for these tasks are ones they learned early in their careers and may well be out of date. As such, automated processing routines could be programmed to employ the current best practices to allow for the best possible data.

But this method is not without its own perils. In such an instance, new discoveries may be passed up. Significantly unusual results may be interpreted by an algorithm as a flaw in the instrumentation or a gamma ray strike and rejected instead of identified as a novel event that warrants further consideration. Additionally, image processing techniques can still contain artifacts from the techniques themselves. Should astronomers not be at least somewhat familiar with the techniques and their pitfalls, they may interpret artificial results as a discovery.

Data Mining
With the vast increase in data being generated, astronomers will need new tools to explore it. Already, there has been efforts to tag data with appropriate identifiers with programs like Galaxy Zoo. Once such data is processed and sorted, astronomers will quickly be able to compare objects of interest at their computers whereas previously observing runs would be planned. As Norris explains, “The expertise that now goes into planning an observation will instead be devoted to planning a foray into the databases.” During my undergraduate coursework (ending 2008, so still recent), astronomy majors were only required to take a single course in computer programming. If Norris’ predictions are correct, the courses students like me took in observational techniques (which still contained some work involving film photography), will likely be replaced with more programming as well as database administration.

Once organized, astronomers will be able to quickly compare populations of objects on scales never before seen. Additionally, by easily accessing observations from multiple wavelength regimes they will be able to get a more comprehensive understanding of objects. Currently, astronomers tend to concentrate in one or two ranges of spectra. But with access to so much more data, this will force astronomers to diversify further or work collaboratively.

Conclusions
With all the potential for advancement, Norris concludes that we may be entering a new Golden Age of astronomy. Discoveries will come faster than ever since data is so readily available. He speculates that PhD candidates will be doing cutting edge research shortly after beginning their programs. I question why advanced undergraduates and informed laymen wouldn’t as well.

Yet for all the possibilities, the easy access to data will attract the crackpots too. Already, incompetent frauds swarm journals looking for quotes to mine. How much worse will it be when they can point to the source material and their bizarre analysis to justify their nonsense? To combat this, astronomers (as all scientists) will need to improve their public outreach programs and prepare the public for the discoveries to come.

The Moon in Stunning Wide Angle

Marius Hills region on the Moon, from LRO's Wide Angle Camera.

[/caption]

Here’s a look at the Moon in a way we’ve never quite seen it before: a close up, but wide angle view. The Lunar Reconnaissance Orbiter camera actually consists of three cameras: there are two narrow-angle cameras which make high-resolution, black-and-white images of the surface, with resolutions down to 1 meter (about 3.3 feet). A third, a wide-angle camera (WAC), takes color and ultraviolet images over the complete lunar surface at 100-meter (almost 330-foot) resolution. However, the raw wide-angle images are somewhat distorted by the camera, but Maurice Collins, a Moon enthusiast from New Zealand, found that putting several images together in a mosaic removes a lot of the distortions and produces a much clearer image. The results are nothing short of stunning; here are a few example of Maurice’s handiwork, including this jaw-dropping image of the Marius Hills region of the Moon. Click on any of these images for a larger version on Maurice’s website, Moon Science

Copernicus Crater on the Moon, captured by LROC's wide angle camera. Image processing by Maurice Collins

Maurice told me that he has been studying the Moon for about ten years now, and he does telescopic imaging of the Moon from his backyard Palmerston North, New Zealand as well as study the various spacecraft data. “I found out how to process the WAC images from Rick Evans (his website is here ) for the Octave processing method, and I also use a tool developed by Jim Mosher for another quicker technique,” Maurice said. Several of Maurice’s images have been featured on the Lunar Photo of the Day website.

Aristarchus Crater, as seen by LROC's wide angle camera. Image processing by Maurice Collins

Other areas of lunar imaging work he has done is using the Lunar Terminator Visualization Tool (LTVT) to study the lunar topography from the Lunar Orbiter Laser Altimeter (LOLA) digital elevation model laser altimeter data.

“Using a previous DEM from the Kaguya spacecraft I discovered a new large (630km long) mountain ridge radial to the Imbrium basin which I have nicknamed “Shannen Ridge” after my 9 year old daughter,” he said. See the image of Shannen Ridge here.

Maurice said he is usually out every clear night imaging or observing the Moon with his telescope. Thanks to Maurice for his wonderful work, and for allowing us at Universe Today to post some of the images. Check out his complete cache of WAC mosaics at his website.

hat tip: Stu Atkinson!

Follow-up Studies on June 3rd Jupiter Impact

Color image of impact on Jupiter on June 3, 2010. Credit: Anthony Wesley

[/caption]

Poor Jupiter just can’t seem to catch a break. Ever since 1994, when our largest planet was hit by Comet Shoemaker-Levy, detections of impacts on Jupiter have occurred with increasing regularity. Most recently, an impact was witnessed on August 20. On June 3rd of 2010, (coincidentally the same day pictures from Hubble were released from a 2009 impact) Jupiter was hit yet again. Shortly after the June 3rd impact, several other telescopes joined the observing.

A paper to appear in the October issue of The Astrophysical Journal Letters discusses the science that has been gained from these observations.

The June 3rd impact was novel in several respects. It was the first unexpected impact that was reported from two independent locations simultaneously. Both discoverers were observing Jupiter with aims of engaging in a bit of astrophotography. Their cameras were both set to take a series of quick images, each lasting a fifth to a tenth of a second. This short time duration is the first time astronomers have had the ability to recreate the light curve for the meteor. Additionally, both observers were using different filters (one red and one blue) allowing for exploration of the color distribution.

Analysis of the light curve revealed that the flash lasted nearly two seconds and was not symmetric; The decay in brightness occurred faster than the increase at onset. Additionally, the curve showed several distinct “bumps” which indicated a flickering that is commonly seen on meteors on Earth.

The light released in the burning up of the object was used to estimate the total energy-released and in turn the mass of the object.  The total energy released was estimated to be between roughly (1.0–4.0) × 1015 Joules (or 250–1000 kilotons).

Follow-up observations from Hubble three days later revealed no scars from the impact. In the July 2009 impact, a hole punched in the clouds remained for several days. This indicated the object in the June 3 impact was considerably smaller and burned up before it was able to reach the visible cloud decks.

Observations intended to find debris came up empty. Infrared observations showed that no thermal signature was left even as little as 18 hours following the discovery.

Assuming that the object was an asteroid with a relative speed of ~60 km/sec and a density of ~2 g/cm3, the team estimated the size of the object to be between 8 and 13 meters, similar to the size of the two asteroids that recently passed Earth. This represents the smallest meteor yet observed on Jupiter. An object of similar size was estimated to be responsible for the impact on Earth in 1994 near the Marshall Islands. Estimates “predict objects of this size to collide with our planet every 6–15 years” with significantly higher rates on Jupiter ranging from one to one hundred such events annually.

Clearly, amateur observations led to some fantastic science. Modest telescopes, “in the range 15–20 cm in diameter equipped with webcams and video recorders” can easily allow for excellent coverage of Jupiter and continued observation could help in determining the impact rate and lead to a better understanding of the population of such small bodies in the outer solar system.

Dragon Drop Tests and Heat1X-Tycho Brahe Set to Launch – SpacePod 2010.08.24

Home made rockets launched from home made submarines next to dragon wings floating in the ocean on your SpacePod for August 24th, 2010

Before we begin I just wanted to give a shout out to our new viewers on both Space.com and Universe Today. Hopefully you like what you’ll see and you’ll stick around for a while, check out some of our other videos and join us for our live weekly show all about space. For today though, lets start over the Pacific Ocean where SpaceX tested the Dragon’s parachute deployment system on August 12th, 2010.
Continue reading “Dragon Drop Tests and Heat1X-Tycho Brahe Set to Launch – SpacePod 2010.08.24”