How Fast is the Speed of Light?

You may think that a lot of things are fast, like speeding bullets and Superman and the passage of time when you are having fun. But all of these things are nothing compared to the speed of light, which is the fastest that something can travel through the Universe. The speed of light is sometimes referred to as the “cosmic speed limit”. Light travels in a vacuum at 186,282.4 miles per second or 299,792,458 meters/second. For simplicity, it is often said that these numbers are 186,000 miles per second, and 3.00 x 10^8 meters per second.

How fast is this in normal terms? Well, the record for the fastest aircraft is held by the Boeing x-43 scramjet. Scramjets are single-use unmanned aircraft designed to go at hypersonic speeds. The x-43 traveled at  12,144 km/h (7,546 mph), or Mach 9.8, on November 16th, 2004. That is .000405% of the speed of light. And this is a jet that can travel from New York to Los Angeles in 20 minutes. While it takes photons about 8 minutes to travel the distance from the Sun to the Earth – at its furthest, 152 million km (94.4 million miles) – this scramjet traveling at its maximum speed would take about 522 days!

The speed of light is really fast, and at this speed some bizarre things start to happen. First off, photons can only travel this speed because they have zero rest mass, meaning that if you were to somehow trap a photon and put it on a scale, it would have no mass. It’s virtually impossible for something with mass to travel this speed, because as you get faster and faster, it takes more and more energy to get you to the speed of light, which makes you heavier, which requires more energy, etc. Time also changes when you get to these speeds. If you left the Earth going the speed of light, then came back around and landed, you would perceive time as moving normally, but when you returned it would seem as if time sped up for everybody on the Earth, and all of your friends and family would be much, much older.

The speed of light is not constant in all materials, though, and can be slowed down. Here’s an excellent article on how researchers can slow down the speed of light by passing it through different materials, with the slowest speed being 38 miles per hour!

To learn more about the speed of light – and there is a lot, lot more to learn, check out the Astronomy Cast questions shows from October 26, 2008June 4, 2009 and September 26, 2008, or the Physics section in the Guide to Space.

Sources:
Wikipedia
NASA

What is a Subduction Zone?

Transform Plate Boundary
Tectonic Plate Boundaries. Credit:

IF you don’t know anything about plate tectonics you might be wondering about what is a subduction zone. A subduction zone is a region of the Earth’s crust where tectonic plates meet. Tectonic plates are massive pieces of the Earth’s crust that interact with each other. The places where these plates meet are called plate boundaries. Plate boundaries occur where plates separate, slide alongside each other or collide into each other. Subduction zones happen where plates collide.

When two tectonic plates meet it is like the immovable object meeting the unstoppable force. However tectonic plates decide it by mass. The more massive plate, normally a continental will force the other plate, an oceanic plate down beneath it. This is the subduction zone. When the other plate is forced down the process is called subduction. The plate enters into the magma and eventually it is completely melted. That is how the surface of the earth makes way for the crust created over time at other plate boundaries.

Subduction zones have key characteristics that help geologist and seismologist identify them. The first is mountain formation. Subduction zones always have mountain ranges caused by plate subduction. The next is volcanic activity as a plate is subducted the pressure and heat turns it into magma. These pockets of magma find paths to the surface and create volcanoes. A good example is the subduction zone near Chile. The final sign is deep marine trenches. These are the best evidence of a subduction zone as they are visible evidence of the crease formed by subduction of a plate. The most famous is the Mariana Trench.

There are some interesting theories about why Subduction occurs in the Earth’s crust. One common theory is that subduction was initiated by major impacts by asteroids or comets early in Earth’s history. This makes a lot of sense due to the geologic evidence of large impacts scattered around the world.

Understanding how subduction zones work is important because it helps scientist to identify areas of high volcanic and seismic activity. Monitoring these areas can help them warn people who live near them of imminent events and also people who could be affected by the side effects of such events such as ash clouds or tsunamis.

Subduction continues to be one of the most powerful and dynamic processes on planet Earth and as technology improves we can come to understand more about this amazing process.

We have written many articles about the subduction zone for Universe Today. For example, here is one on the Ring of Fire and plate boundaries.

You should also check out plate tectonics and subduction.

If you’d like more info on the subduction zone, check out the U.S. Geological Survey Website. And here’s a link to NASA’s Earth Observatory.

We’ve also recorded related episodes of Astronomy Cast about Plate Tectonics. Listen here, Episode 142: Plate Tectonics.

Sources:
http://en.wikipedia.org/wiki/Subduction
http://myweb.cwpost.liu.edu/vdivener/notes/subd_zone.htm

Subduction is a process in geology where one tectonic plates slides underneath another one and merges into the Earth’s mantle. The denser plate is the one that slips under the less dense plate; the younger plate is the less dense one. The process is not a smooth one. The tectonic plates grate against each other, which often causes earthquakes. The plate that slips under does not stay that way. Due to the heat caused by it rubbing against the other plate as well as the natural heat of the mantle, the plate melts and turns into magma. The area where subduction occurs is known as the subduction zone.

When one plate begins to slip underneath another one a trench is formed. The earthquakes that result due to the plates grinding against each other often cause magma to spill out through the trench in submarine volcanoes. Various formations such as mountain ranges, islands, and trenches are caused by subduction and the volcanoes and earthquakes it triggers. In addition to causing earthquakes, subduction can also trigger tsunamis.

When the older plate is holding a continent however, it does not sink, which is reassuring. Instead, the less dense material slips into a trench behind the denser oceanic crust where it gets stuck. The pressure continues to build until the trench flips over and the less dense plate slips underneath the one with the continent.

It is possible for a whole tectonic plate to disappear. This happens when the plate goes through subduction faster than new material can be added to the plate through seafloor spreading. The spreading pushes the plate slowly toward the subduction zone until the whole thing disappears. When this happens, the other tectonic plates rearrange to cover the area.

Subduction zones are mainly located in the Pacific Ocean. This is because seafloor spreading – the process by which new oceanic crust is created – occurs mostly in the Pacific. Thus the new material pushes the older plates outward and then they need to undergo subduction. This also explains why so many earthquakes originate in the Pacific Ocean near the Ring of Fire. That is where the subduction zones are concentrated.

Continental plates also converge, but this is not considered subduction because these plates do not have different densities and thicknesses to subduct. Landforms such as the Himalayas are formed from these convergences though.

 

Geomagnetic Reversal

Magnetic Field
Earth's magnetic field protects us from the solar wind. Image credit: NASA

[/caption]

Geomagnetic reversal is when the orientation of the Earth’s magnetic field becomes reversed. Thus, magnetic north and south switch places. The process is a gradual one though that can take thousands of years. The possibility that the magnetic field could reverse was first brought up in the early 1900’s. However, at this time scientists did not understand the Earth’s magnetic field very well so they were not interested in the concept of geomagnetic reversal. It was not until the 1950’s that scientists began a more in-depth study of geomagnetic reversal.

Scientists have not reached a consensus on what causes pole reversal. Some believe that it is simply an effect of the nature of the planet’s magnetic field. They base this hypothesis on the magnetic field lines’ tendency to move around and think that it becomes agitated enough to flip. Other scientists propose that external influences cause the shift. For example, a tectonic plate that undergoes subduction and goes into the Earth’s mantle may disturb the magnetic field enough to make it turn off. When the field restarts, it randomly chooses orientation, so it could shift.

 In order to better understand the process, scientists study past geomagnetic reversals. This is possible because the reversals have been recorded in minerals found in sedimentary deposits or hardened magma. Scientists have discovered that the magnetic field has actually reversed thousands of times. Scientists also discovered a record of reversals on the ocean floor.

The time between geomagnetic eruptions is not constant. One time, five reversals occurred over a period of a million years. Sometimes however, none happen for a very long time. These periods are known as superchrons. The last time a geomagnetic reversal occurred was 780,000 years ago and is referred to as the Brunhes-Matumaya reversal.

Geomagnetic reversal has also been linked to 2012. Some people believe that in 2012 when the Mayan calendar runs out we will experience some cataclysmic event that will destroy our world or life as we know it. There are various theories for exactly what this event is. One theory says that geomagnetic reversal will occur during 2012. Since the magnetic field is weaker at first when it switches, some claim that the Earth will be ravaged by solar rays. Scientists still have not determined what effects a geomagnetic reversal will have on humans; however, humans did survive the last reversal 780,000 years ago. One hypothesis is that the solar winds actually create a magnetic field sufficient enough to protect us while Earth’s magnetic field restarts.

Universe Today has articles on no geomagnetic reversal in 2012 and field reversal may take 7000 years.

For more information, you should check out geomagnetic flip may not be random and magnetic storm.

Astronomy Cast has an episode on magnetism everywhere.

Reference:
NASA: Earth’s Inconstant Magnetic Field

Angular Motion

You watch something (some distance from you) move … its direction changes … that’s angular motion. In other words, as measured from a fixed point (or axis), the angular motion of an object is the change in direction of the line (of sight) to the object; the angle swept by the line. Notice that if the distance to the object changes but the direction doesn’t, then there is no angular motion (though there is radial motion).

Standing on the surface of the Earth (and not moving, relative to the hills, valleys, etc), you see the Sun rise, move across the sky, and set. Ditto the Moon … and the stars, and the planets, and satellites like the ISS, and … “moving across the sky” simply means the direction of the Sun (the line from you to the Sun) changes, so that motion is angular motion.

Because it involves changes in angle, angular motion is measured in terms of degrees per second (or hour) … or radians per minute, or arcseconds per year, or … i.e. an angle per a unit of time.

Well, that’s one particular kind of angular motion, angular velocity (strictly we need to add a direction, to make it a velocity; in which way is the angle changing, due East perhaps?). There’s also angular acceleration, which is just like linear acceleration except that what the “per second per second” (or, perhaps, “per year per year”) refers to is an angle, not a length (or distance).

As the Earth turns on its axis once a day, and as a circle has 2π radians, the angular motion of the stars and the Sun is 2π rads/day, right? Well, close, but no cigar … the Earth also revolves around the Sun, so from one day to the next it has moved approximately 1/365-th of a complete circle, and as the Earth’s rotation is in the same direction as its orbit, the angular motion of the stars is a little bit less than 2π rads/day (it’s actually 2π radians per sidereal day!).

Many kinds of angular motion, in astronomy, have special names; for example, the angular motion of stars with respect to distant quasars (actually the fixed celestial coordinate system) is proper motion; the tiny ellipses (relatively) nearby stars seem to complete every year is parallax; and there’s precession, nutation, … and even the anomalous advance of the perihelion (of Mercury)! This last one is actually one component of a precession, but it played an important role in the history of physics (the first test the then new theory of general relativity passed); by the way, it’s only about 43″ (” = arcseconds) per century.

Wellesley College’s Phyllis Fleming has a 100-level concise intro to angular motion.

Some of the many Universe Today stories which involve angular motion are Globular Clusters Sort their Stars, and Does a Boomerang Work in Space?

Robots in Space

When it comes to exploring the hostile environment of space, robots have done a lot (if not most) of the exploring. The only other planet besides Earth that humans have set foot on is the Moon. Robotic explorers, however, have set down on the Moon, Mars, Venus, Titan and Jupiter, as well as a few comets and asteroids. Robotic missions can travel further and faster, and can return more scientific data than missions that include humans. There is much debate on whether the future of space exploration should rely solely on robots, or whether humans should have a role.

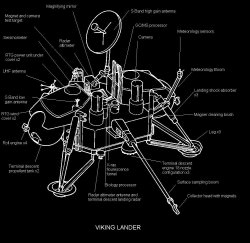
As contentious as this issue is, there is no doubt that robots have and will continue to contribute to our understanding of the Universe. Here’s a short list of past, current, and future robotic missions that have done or will do much in the way of exploration of our cosmos.Schematic of the Viking 1 Lander. Image Credit: The Mars Society

  • The most famous robots in space have to be the series of orbiters, rovers and landers that have been sent to Mars. The first orbiter was Mariner 4, which flew past Mars on July 14, 1965 and took the first close up photos of another planet. The first landers were the Viking landers. Viking 1 landed July 20, 1976, and Viking 2 on September 3, 1976. Both landers were accompanied by orbiters that took photos and scientific data from above the planet. The landers included instruments to detect for life on the surface of Mars, but the data they returned is somewhat ambiguous, and the question of whether there is life on Mars still requires an answer. Currently, Spirit and Opportunity are roving away on the Martian surface, well past their expected mission lifetime, and the Phoenix lander returned a wealth of information about our neighbor. For more about the entire series of Mars missions, go to NASA’s Mars Exploration Program website. Of course, NASA isn’t the only space organization represented at Mars – the European Space Agency currently has Mars Express orbiting the planet, and has the first webcam of another planet available!
  • Mars isn’t the only place to go in the Solar System, though. Both the U.S. and the Russians sent numerous missions to Mariner 1 and 2 made their way to Venus. Mariner 2 was the first successful Venus Flyby. Image Credit: JPLVenus, with a lot of successes and failures. For a complete list of the many missions to Venus visit the Planetary Society. The most notable firsts are: Mariner 2 was the first successful Venus flyby on December 14, 1962, and the Russian lander Venera 7 was the first human-made vehicle to successfully land on another planet and transmit data back to Earth on December 14, 1962.
  • Sputnik 1, of course, was  the first robot in space, and was launched October 4th, 1957 by the USSR.
  • The Voyager missions are notable for the milestone of having a robot leave the Solar System. Voyager 1 and 2 were launched in 1977 are still making their way out of the Solar System, and have entered the heliopause, where the solar wind starts to drop off, and the interstellar wind picks up. To keep up with their status, visit the weekly status page.
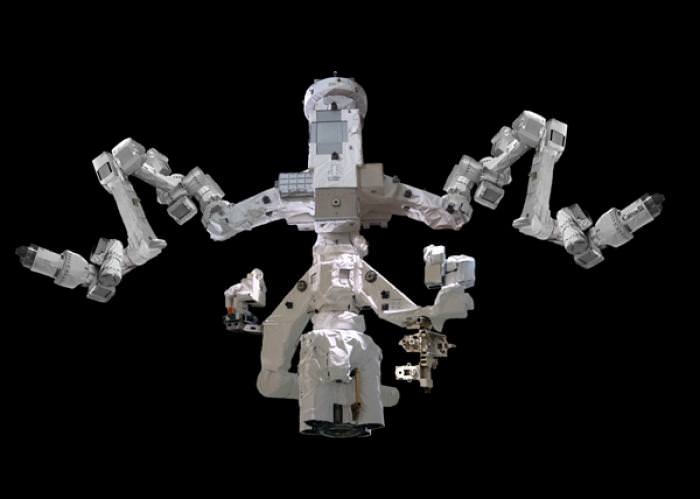
  • Dextre, a robotic arm developed by the Canadian Space Association, is a very cool robot aboard the International Space Station. Dexter allows for delicate manipulation of objects outside the station, reducing the number of space walks and increasing the ability of the ISS crew to maintain and upgrade the station.
  • There are many, many future robotic missions in the works and still in the “dreaming” stage. For example, submarines may one day explore Europa, landers may crawl on the Moon, and spacecraft will orbit comets.

This is by no means an exhaustive list of the enormous number of robotic space missions. To learn a lot, lot more check out the Astronomy Cast episode on Robots in Space, the ESA robotics page, NASA missions page, and the Planetary Society missions page.

Telescopes Open Up the Jewel Box

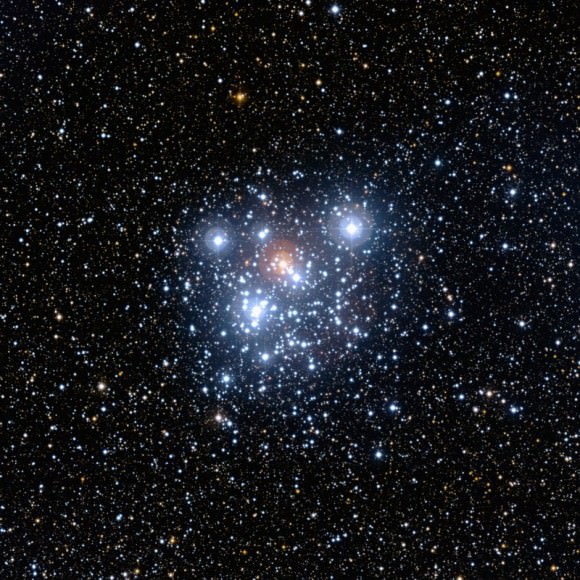
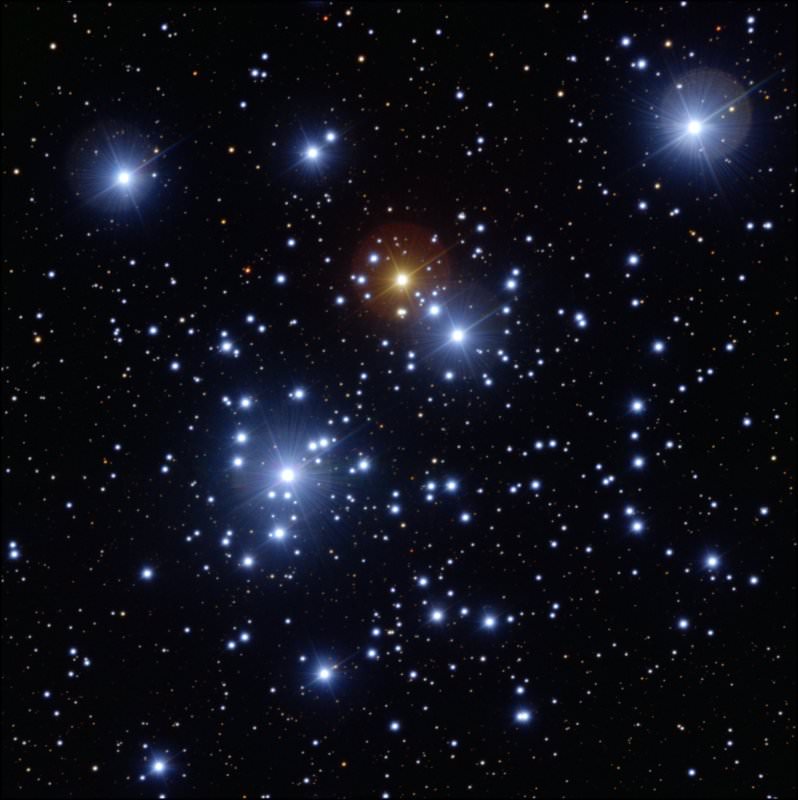
A Snapshot of the Jewel Box cluster with the ESO VLT

[/caption]
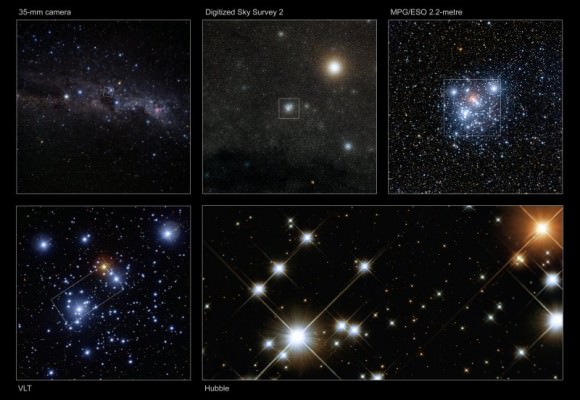
Nothing in my jewelry box compares to the Kappa Crucis Cluster, also known as NGC 4755 or simply the “Jewel Box.” This object is just bright enough to be seen with the unaided eye, but a combination of images taken by three exceptional telescopes, the Very Large Telescope, the 2.2-meter telescope at the La Silla observatory and the Hubble Space Telescope, has allowed the stunning Jewel Box star cluster to be seen in a whole new light. Above is the image from ESO’ Very Large Telescope, which zooms in for a close look at the cluster itself. This new image is one of the best ever taken of this cluster from the ground, taken with an exposure time of just 5 seconds.

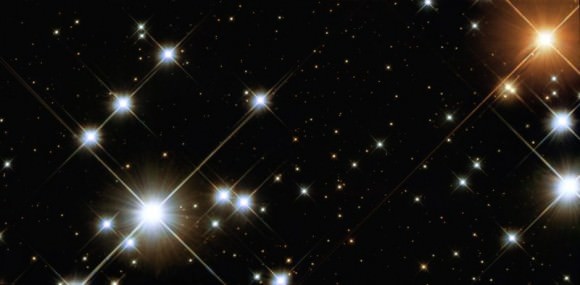
A Hubble gem: the Jewel Box.  Credit: NASA/ESO
A Hubble gem: the Jewel Box. Credit: NASA/ESO

The Hubble Space Telescope can capture light of shorter wavelengths than ground-based telescopes can, and this new HST image of the core of the cluster represents the first comprehensive far ultraviolet to near-infrared image of an open galactic cluster. It was created from images taken through seven filters, allowing viewers to see details never seen before. It was taken near the end of the long life of the Wide Field Planetary Camera 2, Hubble’s workhorse camera up until the recent Servicing Mission, when it was removed and brought back to Earth, and replaced with an new and improved version. Several very bright, pale blue supergiant stars, a solitary ruby-red supergiant and a variety of other brilliantly colored stars are visible in the Hubble image, as well as many much fainter ones. The intriguing colors of many of the stars result from their differing intensities at different ultraviolet wavelengths.

Wide Field Image  of the Jewel Box.  Credit:  ESO
Wide Field Image of the Jewel Box. Credit: ESO

A new image taken with the Wide Field Imager (WFI) on the MPG/ESO 2.2-metre telescope at ESO’s La Silla Observatory in Chile shows the cluster and its rich surroundings in all their multicolored glory. The large field of view of the WFI shows a vast number of stars. Many are located behind the dusty clouds of the Milky Way and therefore appear red.

Composite image of the Jewel Box. Credit: ESO

Star clusters are among the most fascinating objects in the sky. Open clusters such as NGC 4755 typically contain anything from a few to thousands of stars that are loosely bound together by gravity. Because the stars all formed together from the same cloud of gas and dust their ages and chemical makeup are similar, which makes them ideal laboratories for studying how stars evolve.

Source: ESO

Supernova 2009js… Another One Bites The Dust!

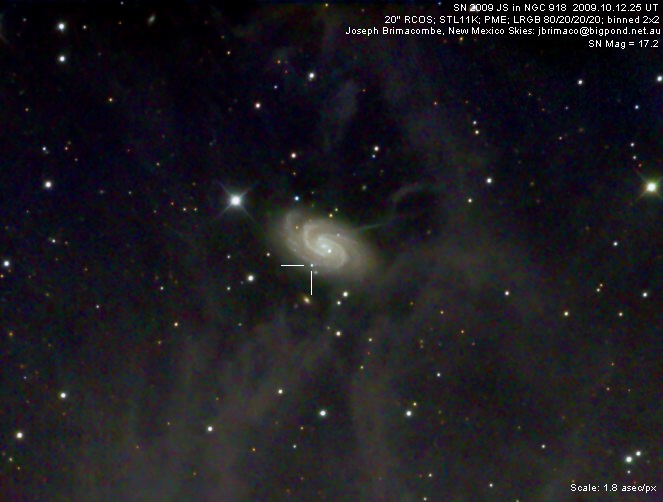
SN 2009 JS in NGC 918 by Joe Brimacombe

[/caption]

Far away in the constellation of Aries, in a 14th magnitude barred spiral galaxy designated as NGC 918… a star exploded with enough candlepower to briefly outshine its home. Discovered independently by Lick Observatory Supernova Search (LOSS) and Koichi Itagaki (Japan) on October 11, 2009, this Type II supernova might be hiding in the intergalactic dust, but it isn’t hiding from Joe Brimacombe.

So who is to blame for this poor intergalactic housekeeping condition, eh? Just exactly where did this film of dust come from that dims distant galaxies and cloaks supernova events? Try our own Milky Way. We’ve known since the first Palomar Sky Surveys that we’re looking through clouds and filaments of dust at high galactic latitudes. But it isn’t just our galaxy either… It’s our whole family! Chances are the entire local group is puffing out enough hydrogen to send up a smoke screen – possibly even with higher redshift extragalactic objects. And just who is the smoker of our group?

The Andromeda Galaxy – M31…

“Finally we come to the aspect which could most shake conventional beliefs about the Local Group and the nature of near space. Deep prints of a red sensitive Schmidt plate (Arp and Sulentic 1991) show unmistakable filamentary dust features reaching back along the minor axis direction toward M31.This filament is repeated in the blue photographs and 100 the hundred micron infra red scans. They have to be real. Although no one has cared to take a spectrum there is no hint of gaseous emission.” says Halton Arp.

“The ejection path across the whole Local Group sky from M31 to 3C120 must have carried material either dusty or capable of forming dust from the ejecting M 31. But that means dust and obscuration within the Local group of galaxies – a point which has never before been seriously advanced. But how can one escape the mult-iwavelength evidence? The most provocative object in the M31 minor axis line is NGC 918. The nebulous dust is most concentrated at the position of the galaxy but a region has been cleared on either side of the minor axis of the galaxy. Higher resolution images would give invaluable information on the process whereby ejections come out along the minor axis of galaxies. In addition the nebulosity is of such long extent across the sky and so coincident with the alignment along the M31 minor axis that it must be in the Local Group. Therefore interaction with the dust filament would represent direct evidence for a distance much smaller than NGC 918’s conventional redshift distance.”

“The filamentary features surrounding NGC 918 are well shown in this image. The outer features appear to be dust illuminated by the galaxy. Immediately around the galaxy the dust appears to cleared away. By either outflow of matter or radiation pressure from the galaxy.” explains Arp, “If the galaxy is not interacting with the nebulosity but just shining through a serendipitous hole we still have the remarkable inference that material has been ejected along the minor axis of M31 into the middle of the Local Group of galaxies. The question then arises as to how many other nearby galaxy groups contain intergalactic material and what this would do to our view of purportedly more distant galaxies.”

If dust is to blame for a clouded view here, is it possible that NGC 918 could be just as guilty of ignoring the Swiffer? Darn right it could. According to research done by E. E. Martinez-Garcia (et al), NGC 918 has its share of spiral density waves that present azimuthal color gradients that even an infrared passband won’t fully penetrate. “We believe that this effect may be due to the position of the dust lanes and stars with respect to the observer.” says Garcia, “More research needs to be done to understand the origin of this effect.”

In the meantime, we’ll thank Joe Brimacombe of Northern Galactic for being on watch and capturing this distant supernova within 24 hours of its discovery. Cuz’ another one bites the dust!

Can I Have One More #Moonwatch With You?


Gazing at the Moon seems to be universal among humans. So why not share the experience with the rest of the world using the hottest social media tool? From Oct. 26-28 you can join in on Moonwatch on Twitter. Various Twitterers will be live-tweeting conversation and images of the Moon, planets and other astronomical objects. Moonwatch was headed up by astronomers from the Newbury Astronomical Society in the UK. Additionally, the Faulkes Telescope Network of professional telescopes will also be taking part and taking images with their 2-metre telescope situated in New South Wales, Australia.
Continue reading “Can I Have One More #Moonwatch With You?”

Infrared Spectroscopy

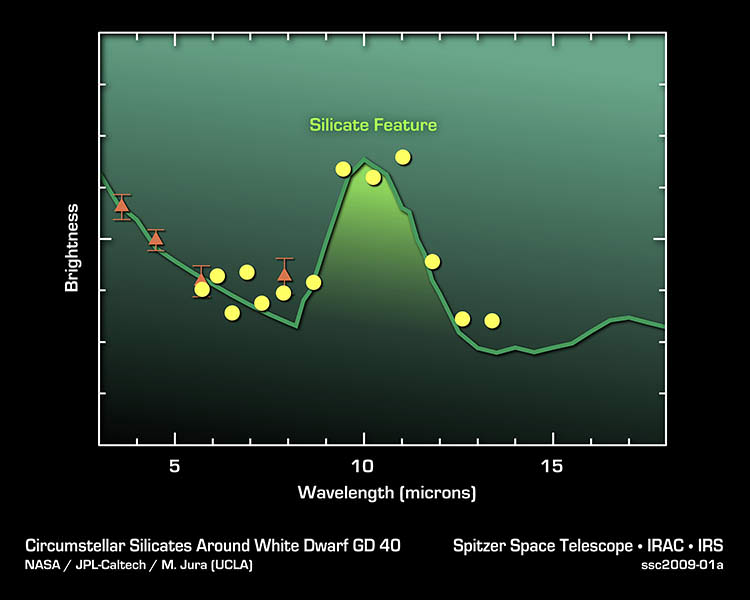
Silicates in Alien Asteroids. Credit: NASA/JPL/Caltech

[/caption]
Infrared spectroscopy is spectroscopy in the infrared (IR) region of the electromagnetic spectrum. It is a vital part of infrared astronomy, just as it is in visual, or optical, astronomy (and has been since lines were discovered in the spectrum of the Sun, in 1802, though it was a couple of decades before Fraunhofer began to study them systematically).

For the most part, the techniques used in IR spectroscopy, in astronomy, are the same or very similar to those used in the visual waveband; confusingly, then, IR spectroscopy is part of both infrared astronomy and optical astronomy! These techniques involve use of mirrors, lenses, dispersive media such as prisms or gratings, and ‘quantum’ detectors (silicon-based CCDs in the visual waveband, HgCdTe – or InSb or PbSe – arrays in IR); at the long-wavelength end – where the IR overlaps with the submillimeter or terahertz region – there are somewhat different techniques.

As infrared astronomy has a much longer ground-based history than a space-based one, the terms used relate to the windows in the Earth’s atmosphere where lower absorption spectroscopy makes astronomy feasible … so there is the near-IR (NIR), from the end of the visual (~0.7 &#181m) to ~3 &#181m, the mid (to ~30 &#181m), and the far-IR (FIR, to 0.2 mm).

As with spectroscopy in the visual and UV wavebands, IR spectroscopy in astronomy involves detection of both absorption (mostly) and emission (rather less common) lines due to atomic transitions (the hydrogen Paschen, Brackett, Pfund, and Humphreys series are all in the IR, mostly NIR). However, lines and bands due to molecules are found in the spectra of nearly all objects, across the entire IR … and the reason why space-based observatories are needed to study water and carbon dioxide (to take just two examples) in astronomical objects. One of the most important class of molecules (of interest to astronomers) is PAHs – polycyclic aromatic hydrocarbons – whose transitions are most prominent in the mid-IR (see the Spitzer webpage Understanding Polycyclic Aromatic Hydrocarbons for more details).

Looking for more info on how astronomers do IR spectroscopy? Caltech has a brief introduction to IR spectroscopy. The ESO’s Very Large Telescope (VLT) has several dedicated instruments, including VISIR (which is both an imager and spectrometer, working in the mid-IR); CIRPASS, a NIR integrated field unit spectrograph on Gemini; Spitzer’s IRS (a mid-IR spectrograph); and LWS on the ESA’s Infrared Space Observatory (a FIR spectrometer).

Universe Today stories related to IR spectroscopy include Infrared Sensor Could Be Useful on Earth Too, Search for Origins Programs Shortlisted, and Jovian Moon Was Probably Captured.

Infrared spectroscopy is covered in the Astronomy Cast episode Infrared Astronomy.

Sources:
http://en.wikipedia.org/wiki/Infrared_spectroscopy
http://www2.chemistry.msu.edu/faculty/reusch/VirtTxtJml/Spectrpy/InfraRed/infrared.htm
http://www.chem.ucla.edu/~webspectra/irintro.html

Gravity Constant

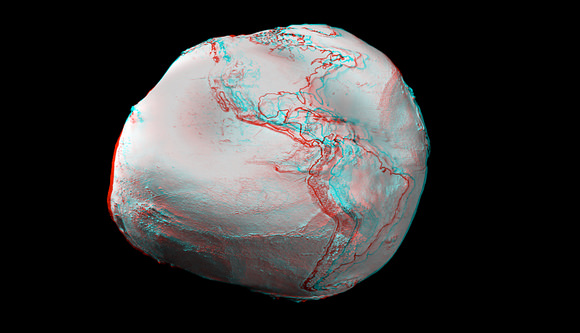
Anaglyph images created from an ESA video animation of global gravity gradients. A more accurate global map will be generated by ESA's GOCE craft. Credit: ESA and Nathaniel Burton Bradford.

[/caption]
The constant of gravity, or gravity constant, has two meanings: the constant in Newton’s universal law of gravitation (so is commonly called the gravitational constant, it also occurs in Einstein’s general theory of relativity); and the acceleration due to gravity at the Earth’s surface. The symbol for the first is G (big G), and the second g (little g).

Newton’s universal law of gravitation in words is something like “the gravitational force between two objects is proportional to the mass of each and inversely proportional to the square of the distance between them“. Or something like F (the gravitational force between two objects) is m1 (the mass of one of the objects) times m2 (the mass of one of the other object) divided by r2 (the square of the distance between them). The “is proportional to” means all you need to make an equation is a constant … which is G.

In other words: F = Gm1m2/r2

The equation for little g is simpler; from Newton we have F = ma (a force F acting on a mass m produces an acceleration a), so the force F on a mass m at the surface of the Earth, due to the gravitational attraction between the m and the Earth is F = mg.

Little g has been known from at least the time of Galileo, and is approximately 9.8 m/s2 – meters per second squared – it varies somewhat, depending on how high you are (altitude) and where on Earth you are (principally latitude).

Obviously, big G and little g are closely related; the force on a mass m at the surface of the Earth is both mg and GmM/r2, where M is the mass of the Earth and r is its radius (in Newton’s law of universal gravitation, the distance is measured between the centers of mass of each object) … so g is just GM/r2.

The radius of the Earth has been known for a very long time – the ancient Greeks had worked it out (albeit not very accurately!) – but the mass of the Earth was essentially unknown until Newton described gravity … and even afterwards too, because neither G nor M could be estimated independently! And that didn’t change until well after Newton’s death (in 1727), when Cavendish ‘weighed the Earth’ using a torsion balance and two pairs of lead spheres, in 1798.

Big G is extremely hard to measure accurately (to 1 part in a thousand, say); today’s best estimate is 6.674 28 (+/- 0.000 67) x 10-11 m3 kg-1 s -2.

The Constant Pull of Gravity: How Does It Work? is a good NASA webpage for students, on gravity; and the ESA’s GOCE mission webpage describes how satellites are being used to measure variations in little g (GOCE stands for Gravity field and steady-state Ocean Circulation Explorer).

The Pioneer Anomaly: A Deviation from Einstein’s Gravity? is a Universe Today story related to big G, as is Is the Kuiper Belt Slowing the Pioneer Spacecraft?; GOCE Satellite Begins Mapping Earth’s Gravity in Lower Orbit Than Expected is one about little g.

No surprise that the Astronomy Cast episode Gravity covers both big G and little g!