Gemini Builds Animation of Galactic Core

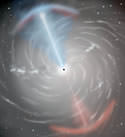
Image credit: Gemini

The Gemini Observatory located on top of Hawaii’s Mauna Kea has been used to create an animation of the action going on in galaxy NGC 1068. Using a tool called the Integral Field Unit, astronomers have been able to create a 3-dimensional animation of the tremendous jet emanating from the supermassive black hole as it slams into the galactic gas disk.

Astronomers observing with the Gemini North Telescope on Hawaii’s Mauna Kea have a powerful new tool to probe mysterious cosmic caldrons like those at the cores of galaxies and stellar nurseries.

Using the recently commissioned Integral Field Unit (IFU) on the Gemini Multi-Object Spectrograph (GMOS), astronomers at the observatory have recently obtained a complete multi-dimensional picture of the dynamic flow of gas and stars at the core of an active galaxy named NGC 1068 in a single snap-shot. The resulting windfall of data has been transformed into an animation that dramatically reveals the internal gyrations of the galaxy – including the interactions of a pair of galactic-scale jets that spew material for thousands of light years away from the suspected black hole at the galaxy’s core.

“The Gemini data of NGC 1068 reveal one of the lesser know features of galaxy jets,” explains Gemini North Associate Director Dr. Jean-Ren? Roy. “For the first time we were able to clearly see the jet’s expanding lobe as its hypersonic bow shock slams directly into the underlying gas disk of the galaxy. It’s like a huge wave smashing onto a galactic shoreline.”

Dr. Gerald Cecil of the University of North Carolina, recently led an international team to study this particular galaxy using spectra taken with the Hubble Space Telescope and believes that the new Gemini spectra will clarify many patterns revealed by Hubble. “Large ground-based telescopes like Gemini are the perfect complement to Hubble because they can collect so much more light. But it’s critical to use all this light cunningly, and not throw most of it away as standard slit spectrographs do. The GMOS’s integral field capability now enables detailed studies of fundamental physical processes that were previously too time consuming to conduct on faint cosmic sources.” The Hubble findings by Dr. Cecil et al. will appear in the April 1, 2002 issue of the Astrophysical Journal.

“By using Integral Field Spectroscopy we add dimensions to the data and can essentially make a movie with one click of the shutter,” says Dr. Bryan Miller, the Gemini instrument scientist for IFUs. “When we play back our movie of the galaxy NGC1068, we see a 3-dimensional view of the core of this galaxy. It is striking how much easier it is to interpret features with this kind of data. With integral-field data we can determine the mass distributions, the true shapes, and the histories of galaxies more accurately than before.” The Integral Field Spectroscopy findings by Dr. Miller et al. will appear in the Conference Series of the Astronomical Society of the Pacific.

This technology is new to the world of 8-10 meter class telescopes and is especially powerful on new generation telescopes like Gemini that use the latest optical technologies to focus starlight to razor sharpness. “We are very excited by these results and the superb capabilities that the integral field unit has given the GMOS in Hawaii”, notes Dr. Jeremy Allington-Smith, the scientist from the University of Durham in the United Kingdom who managed the construction of the GMOS Integral Field Unit. “In effect we have added an extra dimension to the instrument so that it can map the motion of gas and stars at any point in the image of the object under study. The GMOS IFU will be a powerful new tool for studying the centers of active galaxies that may harbor black holes, as well as the dynamic internal motions of galaxies and star forming regions.” The GMOS IFU findings by Dr. Allington-Smith et al. will appear in the Conference Series of the Astronomical Society of the Pacific.

An Integral Field Unit (IFU) like the one used in the GMOS uses hundreds of tiny optical fibers (each thinner than an human hair) with tiny micro-lenses attached to guide light from the telescope’s 2-D image to a spectrograph. The spectrograph produces one individual spectrum for each fiber for a total of 1500 individual spectra that can each reveal details of the physical conditions and velocity of the gas, dust and stars it studies. This system was the first IFU to be installed on the new generation of 8 and 10m telescopes when it was commissioned on the Gemini-North telescope in 2001.

The Integral Field Spectroscopy capabilities of the Gemini Observatory are still developing. Within the next two years both telescopes will have optical and near-infrared integral field units. Some of these systems will work with adaptive optics to provide the highest spatial resolution images deliverable by the telescopes, including images in the infrared that will be sharper than can be produced by the Hubble Space Telescope at those wavelengths.

The Gemini Observatory is an international collaboration that has built two identical 8-meter telescopes. The telescopes are located at Mauna Kea, Hawaii (Gemini North) and Cerro Pach?n in central Chile (Gemini South), and hence provide full coverage of both hemispheres of the sky. Both telescopes incorporate new technologies that allow large, relatively thin mirrors under active control to collect and focus both optical and infrared radiation from space. Gemini North began science operations in 2000 and Gemini South began scientific operations in late 2001.

The Gemini Observatory provides the astronomical communities in each partner country with state-of-the-art astronomical facilities that allocate observing time in proportion to each country’s contribution. In addition to financial support, each country also contributes significant scientific and technical resources. The national research agencies that form the Gemini partnership include: the US National Science Foundation (NSF), the UK Particle Physics and Astronomy Research Council (PPARC), the Canadian National Research Council (NRC), the Chilean Comisi?n Nacional de Investigaci?n Cientifica y Tecnol?gica (CONICYT), the Australian Research Council (ARC), the Argentinean Consejo Nacional de Investigaciones Cient?ficas y T?cnicas (CONICET) and the Brazilian Conselho Nacional de Desenvolvimento Cient?fico e Tecnol?gico (CNPq). The Observatory is managed by the Association of Universities for Research in Astronomy, Inc. (AURA) under a cooperative agreement with the NSF. The NSF also serves as the executive agency for the international partnership.

Original Source: Gemini News Release

New Evidence of the Universe’s Expansion

A team of UK and Australian astronomers have come up with independent evidence that the expansion of the universe is accelerating. Three years ago astronomers stunned the scientific community when they announced their evidence of an accelerating universe (they calculated the velocity of supernovas in distant galaxies). This team came to the same conclusion after measuring the position of 250,000 galaxies and plotted their movement compared it to the structure of the early universe.

Tightest Binary System Discovered

Image credit: ESO

Astronomers have discovered a pair of white dwarf stars that revolve around each other at a distance of only 80,000km (1/5th the distance between the Earth and the Moon) – the closest binary system ever discovered. The system, known as RX J0806.3+1527, was investigated with the European Southern Observatory’s Very Large Telescope (VLT), and observers noticed that the object dimmed once every five minutes suggesting a binary system.

Observations with ESO’s Very Large Telescope (VLT) in Chile and the Italian Telescopio Nazionale Galileo (TNG) on the Canary Islands during the past two years have enabled an international group of astronomers [1] to unravel the true nature of an exceptional binary stellar system.

This system, designated RX J0806.3+1527, was first discovered as an X-ray source of variable brightness – once every five minutes, it “switches off” for a short moment. The new observations have shown beyond doubt that this period reflects the orbital motion of two “white dwarf” stars that revolve around each other at a distance of only 80,000 km. Each of the stars is about as large as the Earth and this is the shortest orbital period known for any binary stellar system.

The VLT spectrum displays lines of ionized helium, indicating that the presence of an exceedingly hot area on one of the stars – a “hot spot” with a temperature of approx. 250,000 degrees. The system is currently in a rarely seen, transitory evolutionary state.

An amazing stellar binary system
One year is the time it takes the Earth to move once around the Sun, our central star. This may seem quite fast when measured on the scale of the Universe, but this is a snail’s motion compared to the the speed of two recently discovered stars. They revolve around each other 100,000 times faster; one full revolution takes only 321 seconds, or a little more than 5 minutes! It is the shortest period ever observed in a binary stellar system.

This is the surprising conclusion reached by an international team of astronomers led by GianLuca Israel of the Astronomical Observatory of Rome [1], and based on detailed observations of the faint light from these two stars with some of the world’s most advanced telescopes. The record-holding binary stellar system bears the prosaic name RX J0806.3+1527 and it is located north of the celestial equator in the constellation Cancer (The Crab).

The scientists also find that the two partners in this hectic dance are most likely a dying white dwarf star, trapped in the strong gravitational grip of another, somewhat heavier star of the same exotic type. The two Earth-size stars are separated by only 80,000 kilometers, a little more than twice the altitude of the TV-broadcasting satellites in orbit around the Earth, or just one fifth of the distance to the Moon.

The orbital motion is very fast indeed – over 1,000 km/sec, and the lighter star apparently always turns the same hemisphere towards its companion, just as the Moon in its orbit around Earth. Thus, that star also makes one full turn around its axis in only 5 minutes, i.e. its “day” is exactly as long as its “year”.

The discovery of RX J0806.3+1527
The visible light emitted by this unusual system is very faint, but it radiates comparatively strong X-rays. It was due to this emission that it was first detected as a celestial X-ray source of unknown origin by the German ROSAT space observatory in 1994. Later it was found to be a periodically variable source [2]. Once every 5 minutes, the X-ray radiation disappears for a couple of minutes. It was recently studied in greater detail by the NASA Chandra observatory.

The position of the X-ray source in the sky was localised with sufficient accuracy to reveal a very faint visible-light emitting object in the same direction, over one million times weaker than the faintest star that can be seen by unaided eye (V-magnitude 21.1). Follow-up observations were carried out with several world class telescopes, including the ESO Very Large Telescope (VLT) at the Paranal Observatory in Chile, and also the Telescopio Nazionale Galileo (TNG), the Italian 4-m class observatory at the Roche de Muchachos Observatory on La Palma in the Canary Islands.

The nature of RX J0806.3+1527
The observations in visible light also showed the same effect: RX J0806.3+1527 was getting dimmer once every 5 minutes, while no other periodic modulation was seen. By observing the spectrum of this faint object with the FORS1 multi-mode instrument on the 8.2-m VLT ANTU telescope, the astronomers were able to determine the composition of RX J0806.3+1527. It was found to contain large amounts of helium; this is unlike most other stars, which are mainly made up of hydrogen.

“At the outset, we thought that this was just another of the usual binary systems that emit X-rays”, says Gianluca Israel. “None of us could imagine the real nature of this object. We finally solved the puzzle by eliminating all other possibilities one by one, while we kept collecting more data. As the famous detective said: when you have eliminated the impossible, whatever remains, however improbable, must be the truth!”.

Current theory predicts that the two stars, which are bound together by gravity in this tight system, produce X rays when one of them acts as a giant “vacuum cleaner”, drawing gas off its companion. That star has already lost a significant fraction of its mass during this process.

The incoming matter impacts at high speed on the surface of the other star and the corresponding area – a “hot spot” – is heated to some 250,000 ?C, whereby X rays are emitted. This radiation disappears for a short time during each orbital revolution when this area is on the far side of the accreting star, as seen from the Earth.

A very rare class of stars
Our Sun is a normal star of comparatively low mass and it will eventually develop into a white dwarf star. Contrary to the violent demise of heavier stars in a glorious supernova explosion, this is a comparatively “quiet” process during which the star slowly cools while losing energy. It shrinks until it finally becomes as small as the Earth.

The Sun is a single star. However when a solar-like star is a member of a binary system, the evolution of its component stars is more complicated. During an initial phase, one star continues to move along an orbit that is actually inside the outer, very tenuous atmospheric layers of its companion. Then the system rids itself of this matter and develops into a binary system with two orbiting white dwarf stars, like RX J0806.3+1527.

Systems in which the orbital period is very short (less than 1 hour) are referred to as AM Canis Venaticorum (AM CVn) systems, after first known binary star of this rare class. It is likely that such systems, after having reached a minimum orbital period of a few minutes, then begin to evolve towards longer orbital periods. This indicates that RX J0806.3+1527 is now at the very beginning of the “AM CVn phase”.

Gravitational waves
With its extremely short orbital period, RX J0806.3+1527 is also a prime candidate for the detection of the elusive gravitational waves, predicted by Einstein’s General Theory of Relativity. They have never been measured directly, but their existence has been revealed indirectly in binary neutron star systems.

A planned gravitational wave space experiment, the European Space Agency’s Laser Interferometer Space Antenna (LISA) that will be launched in about 10 years’ time, will be sufficiently sensitive to be able to reveal this radiation from RX J0806.3+1527 with a high degree of confidence. Such an observational feat would open an entirely new window on the universe.

Original Source: ESO News Release

Young Pulsar Defies Theories

Astronomers working with the National Science Foundation’s Very Large Array have found a pulsar that is much younger than previously thought. The team tracked the movement of a pulsar, located 8,000 light years from Earth, against the remains of the supernova that created it. By calculating the distance it had moved, they were able to calculate the point at which they were at the same place – 64,000 years ago. Using a different method of calculating age, astronomers had previously pegged the pulsar as 107,000 years old. (source: NSF)

Oops, the Universe is Beige

Image credit: JHU

Astronomers from John Hopkins University announced several weeks back that if you averaged out the colour of all stars in the universe, the result would be an aquamarine colour. Well, it turns out they had a bug in their software that mixed the colours together incorrectly. Once they squished the bug, and reran their calculations, the average colour of the entire universe became beige.

What is the color of the Universe? This seemingly simple question has never really been answered by astronomers. It is difficult to take an accurate and complete census of all the light in the Universe.

However using the 2dF Galaxy Redshift Survey – a new survey of more than 200,000 galaxies which measures the light from a large volume of the Universe – we have recently been able to try and answer this question. We have constructed what we call “The Cosmic Spectrum”, which represents all the sum of all the energy in the local volume of the universe emitted at different optical wavelengths of light. This is what the cosmic spectrum looks like:

This is a graph of the energy emitted in the Universe for different wavelengths of light (data here). Ultraviolet and blue light is on the left and red light is on the right. This is constructed by adding together all the individual spectra of the separate galaxies in the 2dF survey. The sum represents the light of all the stars. We believe that because the 2dF survey is so large (reaching out several billion light years) that this spectrum is truly representative. We can also show the cosmic spectrum this way:

Here we have put in the approximate color the eye would see at each wavelength of light (though we cannot really see much light below about 4000 Angstroms, the near ultraviolet; and strictly, monitors cannot accurately display monochromatic colors, the colors of the rainbow).

You can think of this as what the eye would see if we put all the light in the Universe through a prism to produce a rainbow. The intensity of the color is in proportion to it’s intensity in the Universe.

So what is the average color? i.e. the color an observer would see if they had the Universe in a box, and could see all the light at once (and it wasn’t moving, for a real observer on earth, the further away a galaxy from us the more it is redshifted. We have de-redshifted all our light before combining).

To answer this question we must compute the average response of the human eye to these colors. How do we express this color? The most objective way to is quote the CIE x,y values which specify the color’s location in the CIE chromaticity diagram and hence the stimulus the eye would see. Any spectrum with the same x,y must give the same perceived color. These numbers are (0.345,0.345) and they are robust, we have calculated them for different sub-samples of the 2dF survey and they vary insignificantly. We have even computed them for the Sloan Digital Sky Survey spectroscopic survey (which will overtake 2dFGRS as the biggest redshift survey sometime in 2002) and they are essentially the same.

But what is the actual color? Well to do this we have to make some assumptions about human vision and the degree of general illumination. We also need to know what monitor you, the reader, are using! Of course this is impossible, but we can make an average guess. So here are the colors:

What are all these colors? They represent the color of the universe for different white points, which represent the adaptation of the human eye to different kinds of illumination. We will perceive different colors under different circumstances, and the kind of spectrum that appears ‘white’ will vary. A common standard is ‘D65’, which is close to setting daylight (in a slightly overcast sky) as white, and compared to which the universe appears reddish. ‘Illuminant E’ (equal energy white point) is perhaps what you would see for white when dark adapted. ‘Illuminant A’ represents indoor lighting, compared to which the Universe (and daylight) is very blue. We also show the color with and without a gamma correction of 2.2, which is the best thing to do for display on typical monitors. We provide the linear file, so you can apply your own gamma if you wish.

Almost certainly you need to look at the color patches labeled ‘gamma’, but not all displays are the same so your mileage may vary.

So what happened to “turquoise” ?
We found a bug in our code! In our original calculation, which you may have read in the press, we used (in good faith) software with a non-standard white point. Rather it was supposed to use a D65 white point, but did not apply it. The result was an effective white point somewhat redder than Illuminant E (as if some red neon lights were around) at 0.365,0.335. Although the x,y values of the Universe are unchanged from our original calculation the shift in the white point made the universe appear ‘turquoise’. (i.e. x,y, remains the same, but the corresponding effective RGB values shift).

Needless to say since that first calculation we have had a lot of correspondence with color scientists, and have now written our own software to obtain a more accurate color value. We admit the color of the Universe was something of a gimmick, to try and make our story on spectra more accessible. Nevertheless it is an actual calculable thing so we believe it is important to get it right.

We would like to point out that our original intention was merely an amusing footnote in our paper, the original press story blew up beyond our wildest expectations! The mistake took some time to realize and track down. Only a handful of color scientists had the expertise to spot the error. One moral of this story is we should have paid more attention to the ‘color science’ aspect and had that refereed as well.

Enough talk. So what color is the Universe?
Really the answer is so close to white, it is difficult to say. That is why such a small error had such a large effect. The most common choice for white is D65. However if one were to introduce a beam of cosmic spectrum into a room strongly illuminated by light bulbs only (Illuminant A) it would appear very blue, as shown above. Overall, probably Illuminant E is the most correct, for looking at the Universe from afar in dark conditions. So our new best guess is:

BEIGE

Although it’s arguable that it might look more pinkish (like D65 above). Good luck if you can see the difference between this color and white! You should be able to just see it, however if we had made the page background black, it would be very difficult! We have had numerous suggestions for this color emailled to us. We have a top ten, and deem the winner to be “Cosmic Latte” being caffeine biased!

A simulation of the Universe
Because of all these complexities we have decided to see for ourselves. Mark Fairchild at Munsell Color Laboratories in Rochester, NY is working with us to make a simulation of the cosmic spectrum, they can control light sources to give exactly the same red/green/blue eye stimulation as you would see from the cosmic spectrum. We will then be able to view this under a variety of lighting conditions, perhaps simulating deep space, and see for ourselves the true color of the Universe.

The real science story
Of course, our real motive for calculating the cosmic spectrum was really a lot more than producing these pretty color pictures. The color is interesting but in fact the cosmic spectrum is rich in detail and tells us a lot more about the history of star formation in the Universe. You may have noticed above that the cosmic spectrum contains dark lines and bright bands, these correspond to the characteristic emission and absorption of different elements:

These may remind you of Fraunhofer lines in the Solar Spectrum. Exactly the same process of atomic absorption is at work. The strength of the dark lines is determined by the temperatures of the stars contributing to the cosmic spectrum. Older stars have cooler atmospheres and produce a different set of lines to hot young stars. By analyzing the spectrum we can work out the relative proportions of these and try and infer what the star-formation rate was in past ages of the Universe. The gory details of this analysis are given in Baldry, Glazebrook, et al. 2002. A simple picture of our inferred most likely histories of star formation in the Universe is shown here:

All these models give the correct cosmic spectrum in the 2dF survey and all of them say that the majority of stars in the Universe today formed more than 5 billion years ago. This of course implies that the color of the Universe would have been different in the past when there were more hot young blue stars. In fact we can calculate what this would be from our best fitting model. The evolution of the color from 13 billion years ago to 7 billion years in the future looks like this under our various assumptions:

The universe started out young and blue, and grew gradually redder as the population of evolved ‘red’ giant stars built up. The rate of formation of new stars has declined precipitously in the last 6 billion years due to the decline in reserves of interstellar gas for forming new stars. As the star-formation rate continues to decline and more stars become red giants the color of the Universe will become redder and redder. Eventually all stars will disappear and nothing will be left but black holes. These too will eventually evaporate via the Hawking process and nothing will be left except for old light, which will itself redden as the Universe expands forever (in the current cosmological model).

Original Source: JHU News Release

Bow Shock in a Merging Galactic Cluster

A new image taken by the Chandra X-Ray observatory reveals a bow-shaped shock wave towards one side of an extremely hot galactic cluster. Astronomers believe that the shock wave is caused by 70 million degree Celsius gas is ploughed through the cluster at a speed of 10 million kph. This cluster is of great interest to astronomers because it’s one of the hottest clusters ever found – astronomers think that the galaxy might have gotten so hot because it absorbed many smaller clusters in the past.

First Detection of Short Gamma Ray Burst Afterglow

Scientists believe they have spotted the first evidence of a radiation afterglow from short gamma-ray bursts. The afterglow from the bursts was discovered by an international team of astronomers while poring through data gathered by NASA’s Compton Gamma-Ray Observatory. It’s believed longer gamma-ray bursts are caused by the collapse of massive stars, while shorter bursts might be from colliding neutron stars or black holes. By studying the afterglow, astronomers might have another tool to uncover the size, distance, and cause of the bursts.

Dust Disks Could Indicate Planets

A newly detected dust ring, just outside the orbit of Saturn could help astronomers have come up with a new strategy to shortlist star systems that might contain planets. Astronomers from the European Space Agency believe that this dusty ring is being maintained and replenished through collisions of objects in the solar system, like comets and asteroids. These distant dust clouds should be detectible, as well as swaths cleared out by planets.

New Evidence Supports Formation Theory for Rapidly Spinning Pulsars

Combining images taken by the Hubble Space Telescope, as well as data from radio observatories, astronomers from the European Space Agency have new understanding of a very unusual star system – a fast spinning pulsar and a giant red star. Although 90 of these “millisecond” pulsars have been discovered by astronomers, they haven’t figured out what gets them spinning so quickly. Perhaps through absorbing matter from another star, the pulsar is spun up by the transfer of energy that occurs when material is consumed.

ESO Releases New Images of Saturn and Io

The European Southern Observatory released stunning new images of the planet Saturn and Jupiter’s moon Io on Friday – the sharpest ever taken by a ground observatory. The photographs were taken using the ESO’s Very Large Telescope (VLT) at the Paranal Observatory in Chile, which rivals the Hubble Space Telescope in image clarity. This is an almost perfect view of Saturn, taken when the planet’s rings were tilted towards the Earth.