Aesthetics of Astronomy

This Hubble image reveals the gigantic Pinwheel Galaxy (M101), one of the best known examples of "grand design spirals," and its supergiant star-forming regions in unprecedented detail. Astronomers have searched galaxies like this in a hunt for the progenitors of Type Ia supernovae, but their search has turned up mostly empty-handed. Credit: NASA/ESA
This Hubble image reveals the gigantic Pinwheel Galaxy (M101), one of the best known examples of "grand design spirals". Credit: NASA/ESA

[/caption]

When I tell people I majored in astronomy, the general reaction is one of shock and awe. Although people don’t realize just how much physics it is (which scares them even more when they found out), they’re still impressed that anyone would choose to major in a physical science. Quite often, I’m asked the question, “Why did you choose that major?”

Only somewhat jokingly, I reply, “Because it’s pretty.” For what reasons would we explore something if we did not find some sort of beauty in it? This answer also tends to steer potential follow up questions to topics of images they’ve seen and away from topics from half-heard stories about black holes from sci-fi movies.

The topic of aesthetics in astronomy is one I’ve used here for my own devices, but a new study explores how we view astronomical images and what sorts of information people, both expert and amateur, take from them.

The study was conducted by a group formed in 2008 known as The Aesthetics and Astronomy Group. It is comprised of astrophysicists, astronomy image development professionals, educators, and specialists in the aesthetic and cognitive perception of images. The group asked to questions to guide their study:

  1. How much do variations in presentation of color, explanatory text, and illustrative scales affect comprehension of, aesthetic attractiveness, and time spent looking at deep space imagery?
  2. How do novices differ from experts in terms of how they look at astronomical images?

Data to answer this question was taken from two groups; The first was an online survey taken by volunteers from solicitations on various astronomy websites and included 8866 respondents. The second group was comprised of four focus groups held at the Harvard-Smithsonian Center for Astrophysics.

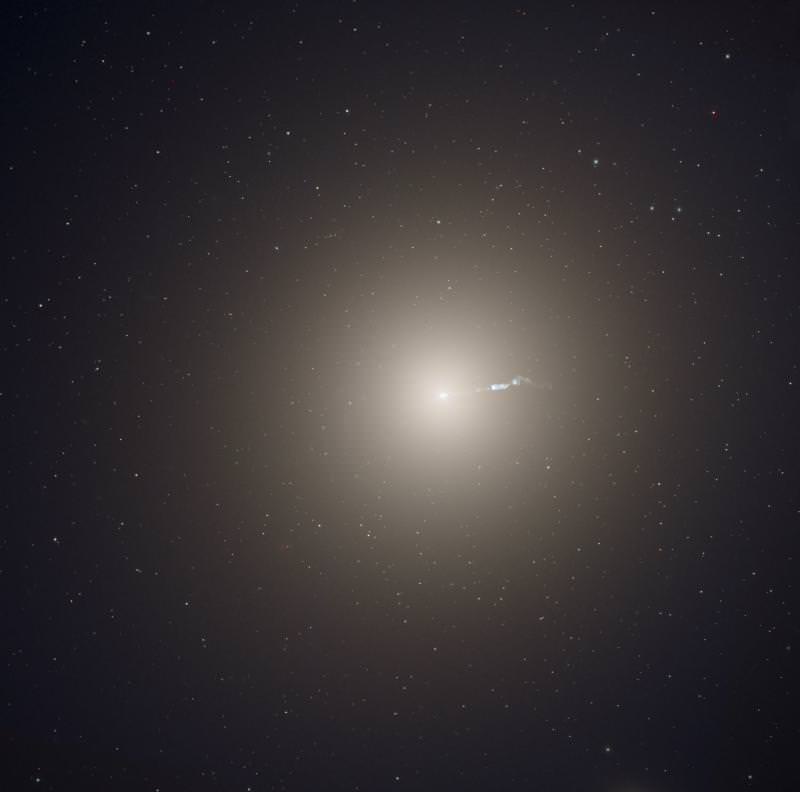
To analyze how viewers viewed color, the web study contained two pictures of the elliptical galaxy NGC 4696. The images were identical except for the colors chosen to represent different temperatures. In one image, red was chosen to represent hot regions and blue for cold regions. In the other version, the color scheme was reversed. A slight majority (53.3% to 46.7%) responded saying they preferred the version in which blue was assigned to be the hotter color. When asked which image they thought was the “hotter” image, 71.5% responded that the red image was hotter. Since astronomical images are often assigned with blue as the hotter color (since hotter objects emit shorter wavelength light which is towards the blue end of the visible spectrum), this suggests that the public’s perception of such images is likely reversed.

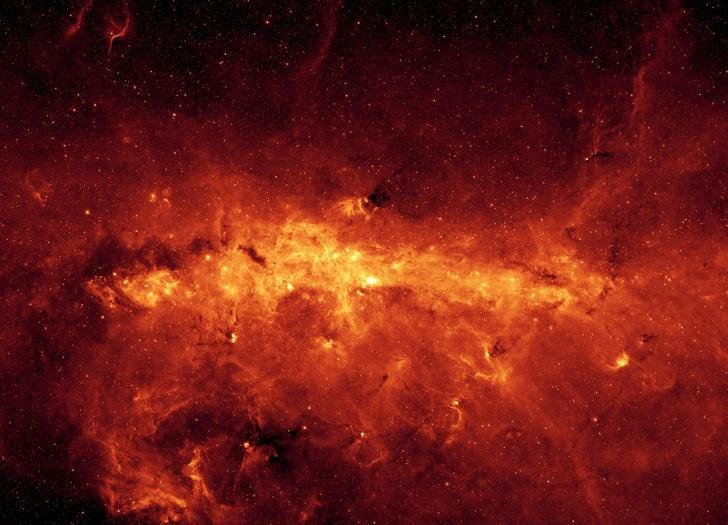
A second image for the web group divided the participants into 4 groups in which an image of a supernova remnant was shown with or without foreground stars and with or without a descriptive caption. When asked to rate the attractiveness, participants rated the one with text slightly higher (7.96 to 7.60 on a 10 point scale). Not surprisingly, those that viewed the versions of the image with captions were more likely to be able to correctly identify the object in the image. Additionally, the version of the image with stars was also more often identified correctly, even without captions, suggesting that the appearance of stars provides important context. Another question for this image also asked the size in comparison to the Earth, Solar System, and Galaxy. Although the caption gave the scale of the SNR in lightyears, the portion that viewed the caption did not fare better when asked to identify the size revealing such information is beyond the limit of usefulness.

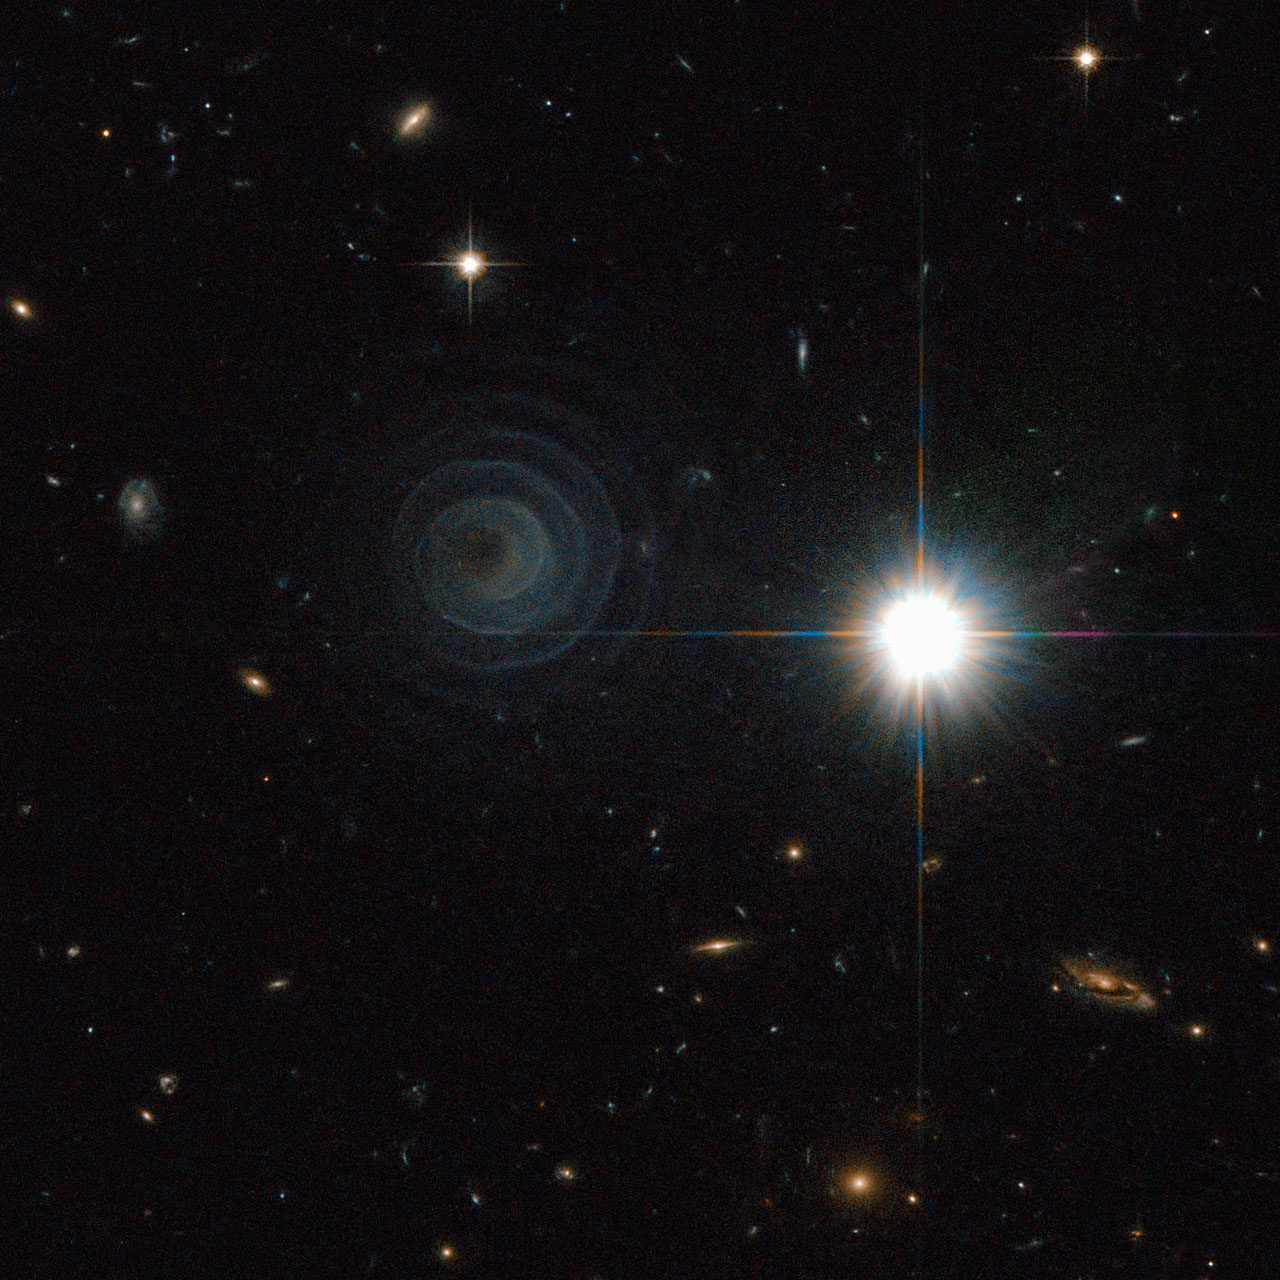
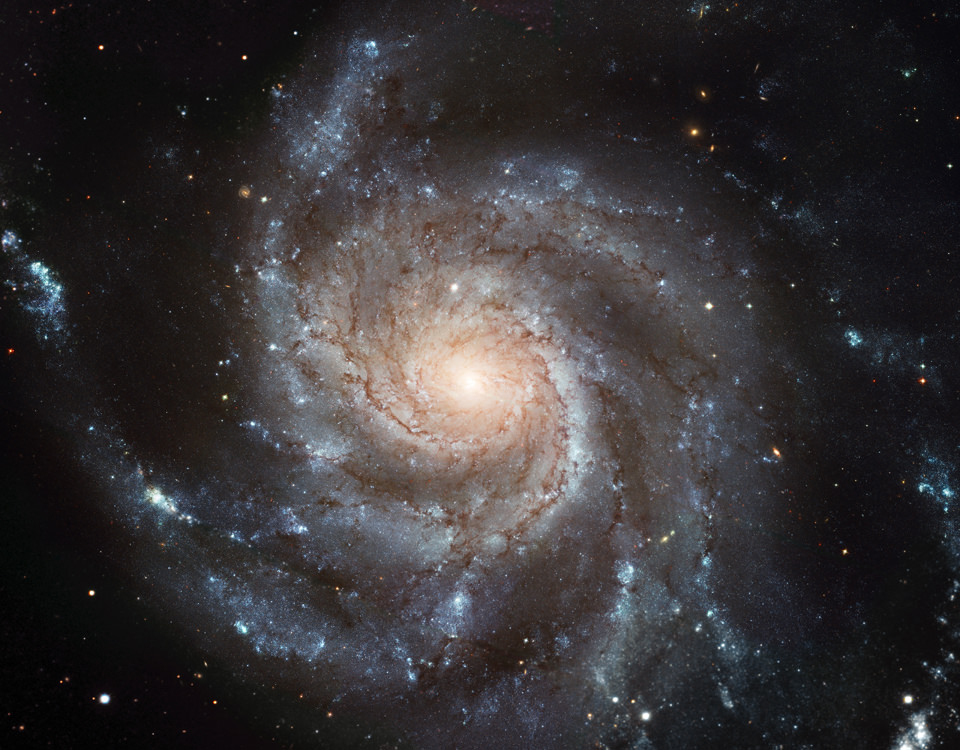
The next portion showed an image of the Whirlpool galaxy, M51 and contained either, no text, a standard blurb, a narrative blurb, or a sectionized caption with questions as headers. Taking into consideration the time spent reading the captions, the team found that those with text spent more time viewing the image suggesting that accompanying text encourages viewers to take a second look at the image itself. The version with a narrative caption prompted the most extra time.

Another set of images explored the use of scales by superimposing circles representing the Earth, a circle of 300 miles, both, or neither onto an image of spicules on the Sun’s surface, with or without text. Predictably, those with scales and text were viewed longer and the image with both scales was viewed the longest and had the best responses on a true/false quiz over the information given by the image.

When comparing self-identified experts to novices, the study found that both viewed uncaptioned images for similar lengths of time, but for images with text, novices spent an additional 15 seconds reviewing the image when compared to experts. Differences between styles of presenting text (short blurb, narrative, or question headed), novices preferred the ones in which topics were introduced with questions, whereas experts rated all similarly which suggested they don’t care how the information is given, so long as it’s present.

The focus groups were given similar images, but were prompted for free responses in discussions.

<

p style=”padding-left: 30px;”>[T]he non-professionals wanted to know what the colors represented, how the images were made, whether the images were composites from different satellites, and what various areas of the images were. They wanted to know if M101 could be seen with a home telescope, binoculars, or the naked eye.

Additionally, they were also interested in historical context and insights from what professional astronomers found interesting about the images.

Professionals, on the other hand, responded with a general pattern of “I want to know who made this image and what it was that they were trying to convey. I want to judge whether this image is doing a good job of telling me what it is they

wanted me to get out of this.” Eventually, they discussed the aesthetic nature of the images which reveals that “novices … work from aesthetics to science, and for astrophysicists … work from science to aesthetics.”

Overall, the study found an eager public audience that was eager to learn to view the images as not just pretty pictures, but scientific data. It suggested that a conversational tone that worked up to technical language worked best. These findings can be used to improve communication of scientific objectives in museums, astrophotography sections of observatories, and even in presentation of astronomical images and personal conversation.

Win ‘Star Walk’ and ‘Solar Walk’ Astronomy Apps

I’ve had a couple of people excitedly show me the Star Walk astronomy app on their iPhones and ipads, and it really is great. You can hold your device up to the sky and it will show you a sky map of your exact position. Move your device around the sky, and it moves with you. It is a very high quality, dynamic and realistic stargazing guide, which — if you are a beginning or experienced astronomer — makes skywatching easy for everybody! There is also a “Solar Walk” app — which has very cool 3D images, so grab your 3D glasses to fully enjoy. See more about this app below.
Continue reading “Win ‘Star Walk’ and ‘Solar Walk’ Astronomy Apps”

Hubble Spies an Amazing Cosmic Spiral

An Extraordinary Celestial Spiral. Credit: ESA/NASA & R. Sahai

[/caption]

The Hubble Space Telescope’s Advanced Camera for Surveys has captured a remarkable image of a spiral in space. No, not a spiral galaxy, (and not another Norway Spiral!) but the formation of an unusual pre-planetary nebula in one of the most perfect geometrical spirals ever seen. The nebula, called IRAS 23166+1655, is forming around the star LL Pegasi (also known as AFGL 3068) in the constellation of Pegasus.

The image shows what appears to be a thin spiral pattern of amazing precision winding around the star, which is itself hidden behind thick dust. Mark Morris from UCLA and an international team of astronomers say that material forming the spiral is moving outwards at a speed of about 50,000 km/hour and by combining this speed with the distance between layers, they calculate that the shells are each separated by about 800 years.

The spiral pattern suggests a regular periodic origin for the nebula’s shape, and astronomers believe that shape is forming because LL Pegasi is a binary star system. One star is losing material as it and the companion star are orbiting each other. The spacing between layers in the spiral is expected to directly reflect the orbital period of the binary, which is estimated to be also about 800 years.

A progression of quasi-concentric shells has been observed around a number of preplanetary nebulae, but this almost perfect spiral shape is unique.

Morris and his team say that the structure of the AFGL 3068 envelope raises the possibility that binary companions are responsible for quasi-concentric shells in most or all of the systems in which they have been observed, and the lack of symmetry in the shells seen elsewhere can perhaps be attributed to orbital eccentricity, to different projections of the orbital planes, and to unfavorable illumination geometries.

Additionally – and remarkably — this object may be illuminated by galactic light.

This image appears like something from the famous “Starry Night” painting by Vincent van Gogh, and reveals what can occur with stars that have masses about half that of the Sun up to about eight times that of the Sun. They do not explode as supernovae at the ends of their lives, but instead can create these striking and intricate features as their outer layers of gas are shed and drift into space. This object is just starting this process and the central star has yet to emerge from the cocoon of enveloping dust.

Abstract: A Binary-Induced Pinwheel Outflow from the Extreme Carbon Star, AFGL 3068

Source: ESA

Herschel Finds Water Around a Carbon Star

Herschel image of the carbon star CW Leonis. The arc visible to the left of the star is a bow showck, where the stellar wind encounters the interstellar medium. ESA/PACS/SPIRE/MESS Consortia

[/caption]

There’s something strange going on around the red giant star CW Leonis (a.k.a. IRC+10216). Deep within the star’s carbon-rich veil, astronomers have detected water vapor where no water should be.

CW Leonis is similar in mass to the sun, but much older and much larger. It is the nearest red giant to the sun, and in its death throes it has hidden itself in a sooty, expanding cloud of carbon-rich dust. This shroud makes CW Leonis almost invisible to the naked eye, but at some infrared wavelengths it is the brightest object in the sky.

Water was originally discovered around CW Leonis in 2001 when the Submillimeter Wave Astronomy Satellite (SWAS) found the signature of water in the chilly outer reaches of the star’s dusty envelope at a temperature of only 61 K. This water was assumed to be evidence for vaporizing comets and other icy objects around the expanding star. New observations with the SPIRE and PACS spectrometers on the Herschel Space Observatory reveal that there’s something much more surprising going on.

“Thanks to Herschel’s superb sensitivity and spectral resolution, we were able to identify more than 60 lines of water, corresponding to a whole series of energetic levels of the molecule,” explains Leen Decin from the University of Leuven and leader of the study. The newly-detected spectral lines indicate that the water vapor is not all in the cold outer envelope of the star. Some of it is much closer to the star, where temperatures reach 1000 K.

No icy fragments could exist that close to the star, so Decin and colleagues had to come up with a new explanation for the presence of the hot water vapor. Hydrogen is abundant in the envelope of gas and dust surrounding carbon stars like  CW Leonis, but the other building block of water, oxygen, is typically bound up in molecules like carbon monoxide (CO) and silicon monoxide (SiO). Ultraviolet light can split these molecules, releasing their stored oxygen, but red giant stars don’t make much UV light so it has to come from somewhere else.

An illustration of the chemical reactions caused by interstellar UV light interacting with molecules surrounding CW Leonis. ESA. Adapted from L. Decin et al. (2010)

The dusty envelopes around carbon stars are known to be clumpy, and that turns out to be the key to explaining the mysterious water vapor. The patchy structure of the shroud around CW Leonis lets UV light from interstellar space into the depths of the star’s envelope. “Well within the envelope, UV photons trigger a set of reactions that can produce the observed distribution of water, as well as other, very interesting molecules, such as ammonia (NH3),” says Decin. “This is the only mechanism that explains the full range of the water’s temperature.”

In the coming months, astronomers will test this hypothesis by using Herschel to search for evidence of water near other carbon stars.

The Black Hole/Globular Cluster Correlation

[/caption]

Often in astronomy, one observable property traces another property which may be more difficult to observe directly; X-ray activity on stars can be used to trace turbulent heating of the photosphere. CO is used to trace cold H2. Sometimes these correlations make sense. Activities in stars produce the X-ray emissions. Other times, the tracer seems distantly related at best.

This is the case of a newly discovered correlation between the mass of the central black hole of galaxies and the number of globular clusters they contain. What can this relationship teach astronomers? Why does it hold for some types of galaxies better than others? And where does it come from in the first place.

The mass of a galaxy’s super massive black hole (SMBH) is known to have a strong relationship between many features of their host galaxies. It has identified to follow the range of velocities of stars in the galaxy, the mass and luminosity of the bulge of spiral galaxies, and the total amount of dark matter in galaxies. Because dark matter in the halo of galaxies and the luminosity have also been known to correspond to the number of globular clusters, Andreas Burkert of the Max-Planck-Institute for Extraterrestrial Physics in Germany, and Scott Tremaine at Princeton wondered if they could cut out the middlemen of dark matter and luminosity and still maintain a strong correlation between the central SMBH and the number of globular clusters.

Their initial investigation involved only 13 galaxies, but a follow-up study by Gretchen and William Harris and submitted to the Monthly Notices of the Royal Astronomical Society, increased the number of galaxies included in the survey to 33. The results of these studies indicated that for elliptical galaxies, the SMBH-GC relationship is evident. However, for lenticular galaxies there was no clear correlation. While there appeared to be a trend for classical spirals, the small number of data points (4) would not provide a strong statistical case independently, but did appear to follow the trend established by the elliptical galaxies.

Although the correlation appeared strong in most cases, about 10% of the galaxies included in the larger surveys were clear outliers. This included the Milky Way which has a SMBH mass that falls significantly short of the expectation from cluster number. One source of error the authors of the original study suspect is that it is possible that, in some cases, objects identified as globular clusters may have been misidentified and in actuality, be the cores of tidally stripped dwarf galaxies. Regardless, the relationship as it stands presently, seems to be quite strong and is even more tightly defined than that of the correlation between that of the SMBH mass and velocity dispersion that implied the potential relationship in the first place. The reason for the discordance in lenticular galaxies has not yet been explained and no reasons have yet been postulated.

But what of the cause of this unusual relation? Both sets of authors suggest the connection lies in the formation of the objects. While distinct in most respects, both are fed by major merger events; Black holes gain mass by accreting gas and globular clusters are often formed from the resulting shocks and interactions. Additionally, the majority of both types of objects formed at high redshifts.

Sources:

A correlation between central supermassive black holes and the globular cluster systems of early-type galaxies

The Globular Cluster/Central Black Hole Connection in Galaxies

How to Crash Stars Together

Globular Cluster
A Hubble Space Telescope image of the typical globular cluster Messier 80, an object made up of hundreds of thousands of stars and located in the direction of the constellation of Scorpius. The Milky Way galaxy has an estimated 160 globular clusters of which one quarter are thought to be ‘alien’. Image: NASA / The Hubble Heritage Team / STScI / AURA. Click for hi-resolution version.

[/caption]

The math is simple: Star + Other star = Bigger star.

While conceptually this works well, it fails to take into account the extremely vast distances between stars. Even in clusters, where the density of stars is significantly higher than in the main disk, the number of stars per unit volume is so low that collisions are scarcely considered by astronomers. Of course, at some point the stellar density must reach a point at which the chance for a collision does become statistically significant. Where is that tipping point and are there any locations that might actually make the cut?

Early in the development of stellar formation models, the necessity of stellar collisions to produce massive stars was not well constrained. Early models of formation via accretion hinted that accretion may be insufficient, but as models became more complex and moved into three dimensional simulations, it became apparent that collisions simply weren’t needed to populate the upper mass regime. The notion fell out of favor.

However, there have been two recent papers that have explored the possibility that, while still certainly rare, there may be some environments in which collisions are likely to occur. The primary mechanism that assists in this is the notion that, as clusters sweep through the interstellar medium, they will inevitably pick up gas and dust, slowly increase in mass. This increase mass will cause the cluster to shrink, increasing the stellar density. The studies suggest that in order for the probability of collision to be statistically significant, a cluster would be required to reach a density of roughly 100 million stars per cubic parsec. (Keep in mind, a parsec is 3.26 light years and is roughly the distance between the sun, and our nearest neighboring star.)

Presently, such a high concentration has never been observed. While some of this is certainly due to the rarity of such densities, observational constraints likely play a crucial role in making such systems difficult to detect. If such high densities were to be achieved, it would require extraordinarily high spatial resolution to distinguish such systems. As such, numerical simulations of extremely dense systems will have to replace direct observations.

While the density necessary is straightforward, the more difficult topic is what sorts of clusters might be capable of meeting such criteria. To investigate this, the teams writing the recent papers conducted Monte Carlo simulations in which they could vary the numbers of stars. This type of simulation is essentially a model of a system that is allowed to play forward repeatedly with slightly different starting configurations (such as the initial positions of the stars) and by averaging the results of numerous simulations, an approximate understanding of the behavior of the system is reached. An initial investigation suggested that such densities could be reached in clusters with as little as a few thousand stars provided gas accumulation were sufficiently rapid (clusters tend to disperse slowly under tidal stripping which can counteract this effect on longer timescales). However, the model they used contained numerous simplifications since the investigation into the feasibility of such interactions was merely preliminary.

The more recent study, uploaded to arXiv yesterday, includes more realistic parameters and finds that the overall number of stars in the clusters would need to be closer to 30,000 before collisions became likely. This team also suggested that there were more conditions that would need to be satisfied including rates of gas expulsion (since not all gas would remain in the cluster as the first team had assumed for simplicity) and the degree of mass segregation (heavier stars sink to the center and lighter ones float to the outside and since heavier ones are larger, this actually decreases the number density while increasing the mass density).  While many globular clusters can easily meet the requirement of number of stars, these other conditions would likely not be met. Furthermore, globular clusters spend little time in regions of the galaxy in which they would be likely to encounter sufficiently high densities of gas to allow for accumulation of sufficient mass on the necessary timescales.

But are there any clusters which might achieve sufficient density? The most dense galactic cluster known is the Arches cluster. Sadly, this cluster only reaches a modest ~535 stars per cubic parsec, still far too low to make a large number of collisions likely. However, one run of the simulation code with conditions similar to those in the Arches cluster did predict one collision in ~2 million years.

Overall, these studies seem to confirm that the role of collisions in forming massive stars is small. As pointed out previously, accretion methods seem to account for the broad range of stellar masses. Yet in many young clusters, still forming stars, rarely do astronomers find stars much in excess of ~50 solar masses. The second study this year suggests that this observation may yet leave room for collisions to play some unexpected role.

(NOTE: While it may be suggested that collisions could also be considered to take place as the orbit of binary stars decays due to tidal interactions, such processes are generally referred to as “mergers”. The term “collision” as used in the source materials and this article is used to denote the merging of two stars that are not gravitationally bound.)

Sources:

Stellar collisions in accreting protoclusters: a Monte Carlo dynamical study

Collisional formation of very massive stars in dense clusters

Ultraluminous Gamma Ray Burst 080607 – A “Monster in the Dark”

Shedding Light on Dark Gamma Ray Bursts

[/caption]

Gamma Ray Bursts (GRBs) are among the most energetic phenomena astronomers regularly observe. These events are triggered by massive explosions and a large amount of the energy if focused into narrow beams that sweep across the universe. These beams are so tightly concentrated that they can be seen across the visible universe and allow astronomers to probe the universe’s history. If such an event happened in our galaxy and we stood in the path of the beam, the effects would be pronounced and may lead to large extinctions. Yet one of the most energetic GRBs on record (GRB 080607) was shrouded in cloud of gas and dust dimming the blast by a factor of 20 – 200, depending on the wavelength.  Despite this strong veil, the GRB was still bright enough to be detected by small optical telescopes for over an hour. So what can this hidden monster tell astronomers about ancient galaxies and GRBs in general?

GRB 080607 was discovered on June 6, 2008 by the Swift satellite. Since GRBs are short lived events, searches for them are automated and upon detection, the Swift satellite immediately oriented itself towards the source. Other GRB hunting satellites quickly joined in and ground based observatories, including ROTSE-III and Keck made observations as well. This large collection of instruments allowed astronomers, led by D. A. Perley of UC Berkley, to develop a strong understanding of not just the GRB, but also the obscuring gas. Given that the host galaxy lies at a distance of over 12 billion light years, this has provided a unique probe into the nature of the environment of such distant galaxies.

One of the most surprising features was unusually strong absorption near 2175 °A. Although such absorption has been noticed in other galaxies, it has been rare in galaxies at such large cosmological distances. In the local universe, this feature seems to be most common in dynamically stable galaxies but tends to be “absent in more disturbed locations such as the SMC, nearby starburst galaxies” as well as some regions of the Milky Way which more turbulence is present. The team uses this feature to imply that the host galaxy was stable as well. Although this feature is familiar in nearby galaxies, observing it in this case makes it the furthest known example of this phenomenon. The precise cause of this feature is not yet known, although other studies have indicated “polycyclic aromatic hydrocarbons and graphite” are possible suspects.

Earlier studies of this event have shown other novel spectral features. A paper by Sheffer et al. notes that the spectrum also revealed molecular hydrogen. Again, such a feature is common in the local universe and many other galaxies, but never before has such an observation been made linked to a galaxy in which a GRB has occurred. Molecular hydrogen (as well as other molecular compounds) become disassociated at high temperatures like the ones in galaxies containing large amounts of star formation that would produce regions with large stars capable of triggering GRBs. With observations of one molecule in hand, this lead Sheffer’s team to suspect that there might be large amounts of other molecules, such as carbon monoxide (CO). This too was detected making yet another first for the odd environment of a GRB host.

This unusual environment may help to explain a class of GRBs known as “subluminous optical bursts” or “dark bursts” in which the optical component of the burst (especially the afterglow) is less bright than would be predicted by comparison to more traditional GRBs.

Sources:

Monster in the Dark: The Ultra Luminous GRB 080706 and its Dusty Environment

The Discovery of Vibrationally-Excited H2 In the Molecular Cloud Near GRB 080706

disassociated

The Race to Stellar Formation

The Cosmic Web - NGC 2070 by Joseph Brimacombe

[/caption]

Racing is rarely the term that comes to mind when one considers astronomy. However, many events are a race to reach stability before a system flies apart or implodes. The formation of stars from gigantic interstellar clouds is just such a race in which stars struggle to form before the cloud is dispersed. Although a rough estimation of the requirements for collapse are discussed in introductory astrophysics classes (See: Jeans Mass Criterion) this formulation leaves out several elements that come into play in the real universe. Unfortunately for astronomers, these effects can be subtle but significant but untangling them is the subject of a recent paper uploaded to the arXiv preprint server.

The Jeans Mass Criterion only takes into consideration a gas cloud in isolation. Whether or not it will collapse will depend on whether or not the density is sufficiently high. But as we know, stars don’t form in isolation; They form in stellar nurseries which form hundreds to thousands of stars. These forming stars contract under self gravity, and in doing so, heat up. This increases the local pressure and slows contraction as well as giving off additional radiation that also affects the cloud at large. Similarly, solar winds (particles streaming from the surface of formed stars) and supernovae can also disrupt further formation. These feedback mechanisms are the target of a new study by a group of astronomers led by Laura Lopez from the University of California Santa Cruz.

To investigate how each feedback mechanism operated, the group selected the Tarantula Nebula (aka, 30 Doradus or NGC 2070), one of the largest star forming regions easily accessible to astronomers since it resides in the Large Magellanic Cloud. This region was selected due to its large angular size which allowed the team to have good spatial resolutions (down to scales smaller than a parsec) as well as being well above the plane of our own galaxy to minimize interference from gas sources in our own galaxy.

To conduct their study, Lopez’s team broke 30 Dor into 441 individual regions to assess how each feedback mechanism worked in different portions of the nebula. Each “box” consisted of a column slicing through the nebula that was a mere 8 parsecs to a side to ensure sufficient quality of the data across the entire spectrum since observations were used from radio telescopes to X-ray and used data from Spitzer and Hubble.

Perhaps unsurprisingly, the team found that different feedback mechanisms played varying roles in different places. Close the the central star cluster (<50 parsecs), radiation pressure dominated the effects on the gas. Further out, pressure from the gas itself played the stronger role. Another potential feedback mechanism was that of “hot” gas being excited by X-ray emission. What the team uncovered is that, although there is a significant amount of this material, the nebula’s density is insufficient to entrap it and allow it to have a large effect on the overall pressure. Rather, they described this portion as “leaking out of the pores”.

This research is some of the first to observationally explore, on a large scale, many of the mechanisms that have been proposed by theorists in the past. Although such research may seem inconsequential, these feedback mechanisms will have large effects on the distribution of stellar masses (known as the Initial Mass Function). This distribution determines which the relative amounts of massive stars which help to create heavy elements and drive the chemical evolution of galaxies as a whole.

Astronomy Without A Telescope – Galactic Gravity Lab

The center of the Milky Way containing Sagittarius A*. The black hole and several massive young stars in the chaotic region create a surrounding haze of superheated gas that shows up in X-ray light. Credit: chandra.harvard.edu and Kyoto University.

[/caption]

Many an alternative theory of gravity has been dreamt up in the bath, while waiting for a bus – or maybe over a light beverage or two. These days it’s possible to debunk (or otherwise) your own pet theory by predicting on paper what should happen to an object that is closely orbiting a black hole – and then test those predictions against observations of S2 and perhaps other stars that are closely orbiting our galaxy’s central supermassive black hole – thought to be situated at the radio source Sagittarius A*.

S2, a bright B spectral class star, has been closely observed since 1995 during which time it has completed over one orbit of the black hole, given its orbital period is less than 16 years. S2’s orbital dynamics can be expected to differ from what would be predicted by Kepler’s 3rd law and Newton’s law of gravity, by an amount that is three orders of magnitude greater than the anomalous amount seen in the orbit of Mercury. In both Mercury’s and S2’s cases, these apparently anomalous effects are predicted by Einstein’s theory of general relativity, as a result of the curvature of spacetime caused by a nearby massive object – the Sun in Mercury’s case and the black hole in S2’s case.

S2 travels at an orbital speed of about 5,000 kilometers per second – which is nearly 2% of the speed of light. At the periapsis (closest-in point) of its orbit, it is thought to come within 5 billion kilometres of the Schwarzschild radius of the supermassive blackhole, being the boundary beyond which light can no longer escape – and a point we might loosely regard as the surface of the black hole. The supermassive black hole’s Schwarzschild radius is roughly the distance from the Sun to the orbit of Mercury – and at periapsis, S2 is roughly the same distance away from the black hole as Pluto is from the Sun.

The supermassive black hole is estimated to have a mass of roughly four million solar masses, meaning it may have dined upon several million stars since its formation in the early universe – and meaning that S2 only manages to cling on to existence by virtue of its stupendous orbital speed – which keeps it falling around, rather than falling into, the black hole. For comparison, Pluto stays in orbit around the Sun by maintaining a leisurely orbital speed of nearly 5 kilometers per second.

Some astrometrics of S2's orbit around the supermassive black hole Sagittarius A* at the center of the Milky Way. Credit: Schödel et al (2002), published in Nature.

The detailed data set of S2’s astrometric position (right ascension and declination) changes over time – and from there, its radial velocity calculated at different points along its orbit – provides an opportunity to test theoretical predictions against observations.

For example, with these data, it’s possible to track various non-Keplerian and non-Newtonian features of S2’s orbit including:

– the effects of general relativity (from a external frame of reference, clocks slow and lengths contract in stronger gravity fields). These are features expected from orbiting a classic Schwarzschild black hole;
– the quadrapole mass moment (a way of accounting for the fact that the gravitational field of a celestial body may not be quite spherical due to its rotation). These are additional features expected from orbiting a Kerr black hole – i.e. a black hole with spin; and
– dark matter (conventional physics suggests that the galaxy should fly apart given the speed it’s rotating at – leading to the conclusion that there is more mass present than meets the eye).

But hey, that’s just one way of interpreting the data. If you want to test out some alternative theories – like, say Oceanic String Space Theory – well, here’s your chance.

Further reading: Iorio, L. (2010) Long-term classical and general relativistic effects on the radial velocities of the stars orbiting Sgr A*.