Planets and their Remnants around White Dwarfs

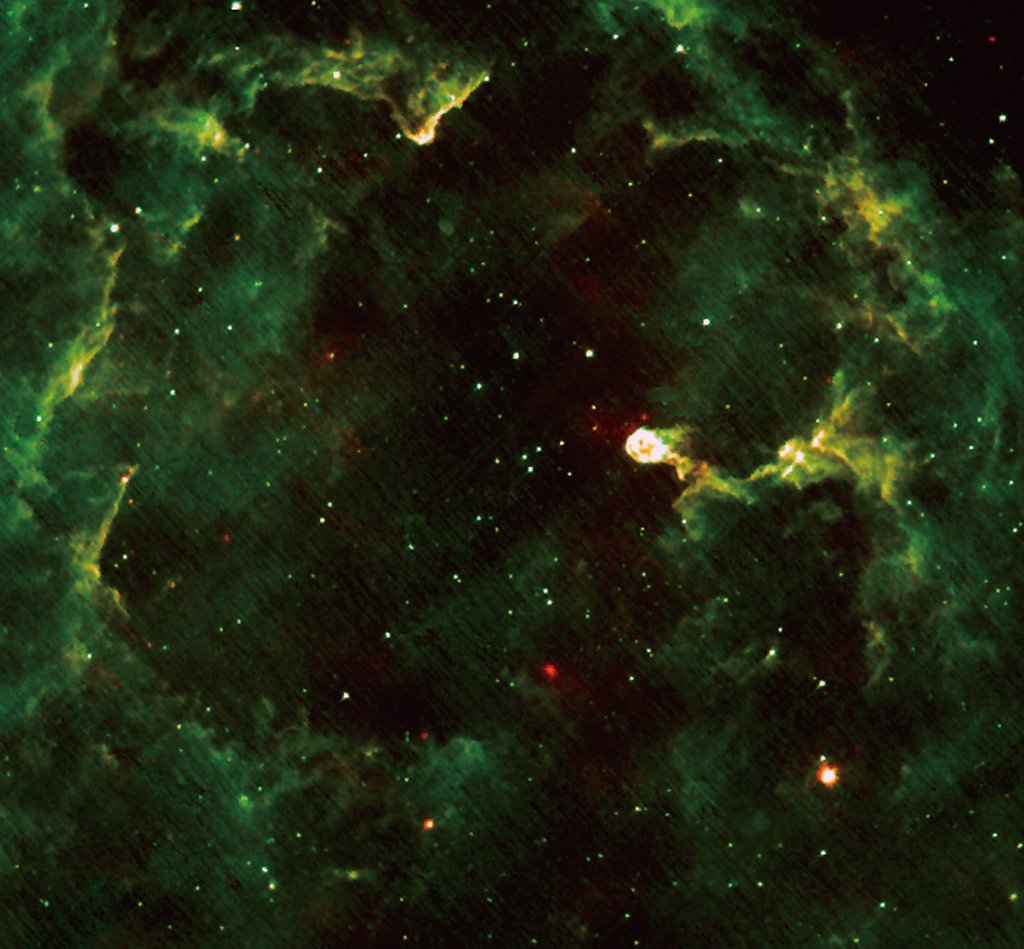
The white dwarf G29-38. Many stars, including our Sun, end their lives as white dwarfs. Determining the masses of white dwarf stars is key to the new technique of determining a star's age. Image Credit: NASA

[/caption]

While supernovae are the most dramatic death of stars, 95% of stars will end their lives in a far more quiet fashion, first swelling up to a red giant (perhaps a few times for good measure) before slowly releasing their outer layers into a planetary nebula and fading away as a white dwarf. This is the fate of our own sun which will expand nearly to the orbit of Mars. Mercury, Venus, and Earth will be completely consumed. But what will happen to the rest of the planets in the system?

While many stories have suggested that as the star reaches the red giant phase, even before swallowing the Earth, the inner planets will become inhospitable while the habitable zone will expand to the outer planets, perhaps making the now frozen moons of Jupiter the ideal beach getaway. However, these situations routinely only consider planets with unchanging orbits. As the star loses mass, orbits will change. Those close in will experience drag due to the increased density of released gas. Those further out will be spared but will have orbits that slowly expand as the mass interior to their orbit is shed. Planets at different radii will feel the combination of these effects in different ways causing their orbits to change in ways unrelated to one another.

This general shaking up of the orbital system will result in the system becoming once again, dynamically “young”, with planets migrating and interacting much as they would when the system was first forming. The possible close interactions can potentially crash planets together, fling them out of the system, into looping elliptical orbits, or worse, into the star itself. But can evidence of these planets be found?

A recent review paper explores the possibility. Due to convection in the white dwarf, heavy elements are quickly dragged to lower layers of the star removing traces of elements other than hydrogen and helium in the spectra. Thus, should heavy elements be detected, it would be evidence of ongoing accretion either from the interstellar medium or from a source of circumstellar material. The author of the review lists two early examples of white dwarfs with atmospheres polluted in this respect: van Maanen 2 and G29-38. The spectra of both show strong absorption lines due to calcium while the latter has also had a dust disk detected around the star?

But is this dust disk a remnant of a planet? Not necessarily. Although the material could be larger objects, such as asteroids, smaller dust sized grains would be swept from the solar system due to radiation pressure from the star during the main sequence lifetime. Much like planets, the asteroids orbits would be perturbed and any passing too close to the star could be torn apart tidally and pollute the star as well, albeit on a much smaller scale than a digested planet. Also along these lines is the potential disruption of a potential Oort cloud. Some estimates have predicted that a planet similar to Jupiter may have it’s orbit expanded as much as a thousand times, which would likely scatter many into the star as well.

The key to sorting these sources out may again lie with spectroscopy. While asteroids and comets could certainly contribute to the pollution of the white dwarf, the strength of the spectral lines would be an indirect indicator of the averaged rate of absorption and should be higher for planets. Additionally, the ratio of various elements may help constrain where the consumed body formed in the system. Although astronomers have found numerous gaseous planets in tight orbits around their host stars, it is suspected that these formed further out where temperatures would allow for the gas to condense before being swept away. Objects formed closer in would likely be more rocky in nature and if consumed, their contribution to the spectra would be shifted towards heavier elements.

With the launch of the Spitzer telescope, dust disks indicative of interactions have been found around numerous white dwarfs and improving spectral observations have indicated that a significant number of systems appear polluted. “If one attributes all metal-polluted white dwarfs to rocky debris, then the fraction of terrestrial planetary systems that survive post-main sequence evolution (at least in part) is as high as 20% to 30%”. However, with consideration for other sources of pollution, the number drops to a few percent. Hopefully, as observations progress, astronomers will begin to discover more planets around stars between the main sequence and white dwarf region to better explore this phase of planetary evolution.

A Comet that Gives Twice?

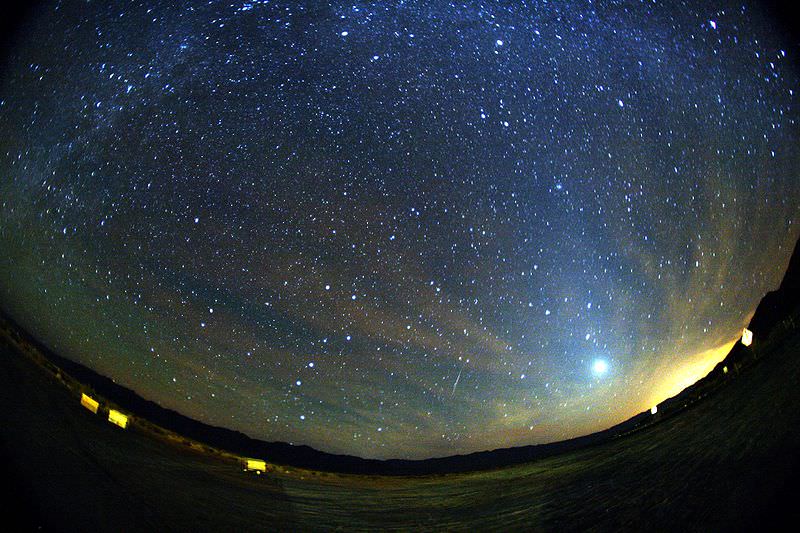
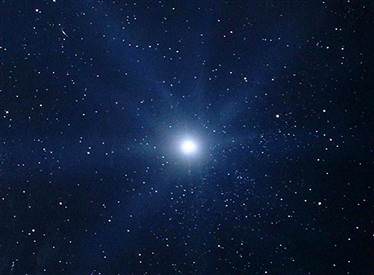
A green and red Orionid meteor striking the sky below Milky Way and to the right of Venus. Zodiacal light is also seen at the image The trail appears slightly curved due to edge distortion in the lens. Taken by Mila Zinkova

[/caption]

While historically, meteor showers were portents of ill omens, we know today that they are the remnants of ejecta from comets entering our atmosphere. Many showers have had their parent comets identified. But a new study is suggesting that two meteor showers, the December Monocerotids and the November Orionids, may share the same parent.


The possibility of a single comet providing multiple showers isn’t too difficult to imagine. Since comets orbit the Sun in elliptical paths there are two potential points the path can intersect Earth’s orbit: Once on the way in and once on the way out. The trouble is that comets don’t tend to orbit directly in the ecliptic plane (defined by the plane on which the Earth orbits the Sun). Thus, comets only puncture through this plane at points known as “nodes”. As a body passes from the upper half to the lower (where upper and lower are the halves defined by Earth’s north and south poles respectively) this point of intersection of the orbit with the ecliptic plane is known as the descending node. When it heads back up, this is the ascending node. If both nodes happen to lie near enough to Earth’s orbital path, the potential for two meteor showers exists. Another possibility is that orbital evolution cause the nodes to change their position and, over time, crossed Earth’s orbit at two different points.

In principle, identifying a parent comet for two showers is much simpler with the first method. In that instance, the comet still orbits in the same path (or near enough) to be conclusively identified as the progenitor. If such an instance were to arise due to orbital evolution, the case must be much more indirect since interactions with planets, even at fairly large distances, can induce large uncertainties in the orbital history.

The December Monocerotids have been associated with a comet known as C/1917 F1 Mellish. Unfortunately for the researchers, the current orbital characteristics of the comet did not feature nodes in Earth’s orbit and did not match the November Orionids. Thus, to establish a connection between the two meteor streams, the team of astronomers from Comenius University in Slovakia, looked at the characteristics of the showers. In order to track these characteristics, the team utilized a publicly available database of meteor recordings from SonotaCo which uses webcams to capture video of meteors and then compute the orbital characteristics of the debris. However, the two showers did share suspiciously similar distributions of sizes (and thus brightnesses) of meteors as well as the velocity and less so, but still notable, the eccentricity.

This led the team to suspect that the node had evolved across Earth’s orbit sweeping by once in the past to create the stream of debris that forms the November shower, and more recently, crossed our orbit to create the December shower. If this hypothesis were correct, the team expected to also find subtle differences hinting that the November shower was older. Sure enough, the November Orionids show a larger dispersion of velocities than that of the December shower.

In the future, the team plans to revise the orbital characteristics of the parent comet. While they were able to show that the precession of the orbit would allow for the situation described, it was only one of a number of possible solutions. Thus, refining the knowledge of the orbit, perhaps from archival photographic plates, would allow the team to better constrain the path and determine the orbital history sufficiently to reinforce or refute their scenario.

Kepler Spacecraft Can “Hear” a Red Giant Concerto in Space

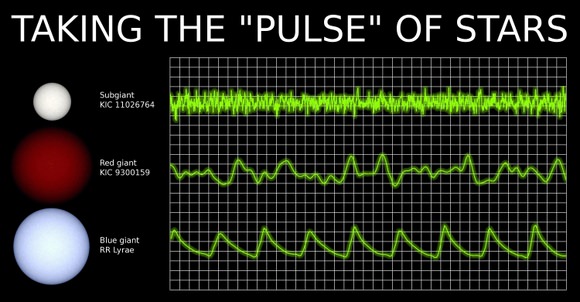
The stars and their light variation studied by Kepler.

[/caption]

Not only is the Kepler spacecraft hunting down extrasolar planets, but it also provides the ability to study stars in unprecedented detail. “We knew that if Kepler had the sensitivity of detecting Earth-size planets, that it would have capability to transform our knowledge of stars themselves,” said Natalie Batalha of San Jose State University in California, a co-investigator on the Kepler Astroseismic Science Consortium. This international partnership of over 400 astronomers uses the Kepler spacecraft to “listen” to tiny oscillations, or “star quakes,” in red giant stars, allowing scientists to do groundbreaking work in deducing the fundamental properties of stars.

In just the first year of Kepler’s operation, the team has been able to study thousands of stars using astroseismology, while previously only a few dozen of stars had been “listened to” using this technique.
“We can say Kepler is listening to thousands of musicians in the sky,” said Daniel Huber, a graduate student at the University of Sydney, during a webcast of a press conference about the new findings.

“From first year of the Kepler mission we moved from having a couple of dozen of stars with a couple of weeks of data,” said Travis Metcalfe, scientist at The National Center for Atmospheric Research, responding to a question posed by Universe today “to having one month to study each of a several thousands of stars. This is an enormous expansion of our capability to study this type of star and what the oscillations tells us.”
Similar to how seismologists study earthquakes to probe the Earth’s interior, astroseismology measures the natural pulse of light waves from stars to gain new insights into stellar structure and evolution.

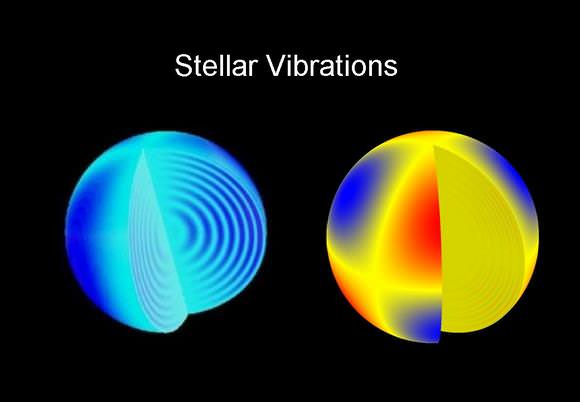
The variations in brightness can be interpreted as vibrations, or oscillations within the stars, using a technique called asteroseismology. The oscillations reveal information about the internal structure of the stars, in much the same way that seismologists use earthquakes to probe the Earth's interior. Credit: Kepler Astroseismology team.

“Kepler allows us to study the periods of stellar oscillations, and we use them to study the cores of stars — in a way to touch the stars — and get the most accurate measurements of stars we have ever made,” said Hans Kjeldsen, associate professor, KASC, Aarhus University in Denmark.

They can measure size and age with extreme precision and they have now characterized the structure and life cycle of over 1,000 red giants. What they have found so far confirms the current principals of stellar evolution and allows for better predictions of what might happen to our Sun in several billion years.

Kjeldsen said they are getting data of amazing quality. “We can now actually study stars of all phases and evolutionary stages, of different mass, and all different types. This is the amazing thing for me. Instead of looking one star for awhile and then moving on to next star, we now have access to thousands of stars at once. And having said that, there are still thousands and thousands of stars we still need to study.”

Metcalfe said astroseismology listens to the oscillations of the star, and can hear a tone so low that even a whale would have a hard time hearing it. Kepler can see even tiny oscillations as a flickering in the star.
“Sound waves travel into the star and bring information up to the surface, which Kepler can see as a tiny flickering in brightness of the star,” said astronomer Travis Metcalfe of The National Center for Atmospheric Research.

That flickering has a tone like the notes of a musical instrument. “We essentially measure the tone of these musical notes from the star,” he said. “Larger stars flicker in lower tones while smaller stars in higher tones.”

Listen to Daniel Huber's Red Giant Oscillation Symphony

One star that Metcalfe has been focusing on is a red giant, that measured twice the size of the Sun. KIC 11026764 now has the most accurately known properties of any star in the Kepler field. In fact, few stars in the universe are known to similar accuracy, the team said. The oscillations reveal that this star is 5.94 billion years old and is powered by hydrogen fusion in a thin shell around a helium-rich core.

In this consortium, no dollars are actually exchanged between nations. The US provides the Kepler instrument and software pipeline, while the international partners are supplying human resources of ingenuity and scientific expertise.

“We’re not just getting a great legacy of scientific results, but also a valuable symbiosis and partnership here,” said Batalha.

You can watch the press conference on Universe Today at this link.

Super Star Smashes into the Record Books.

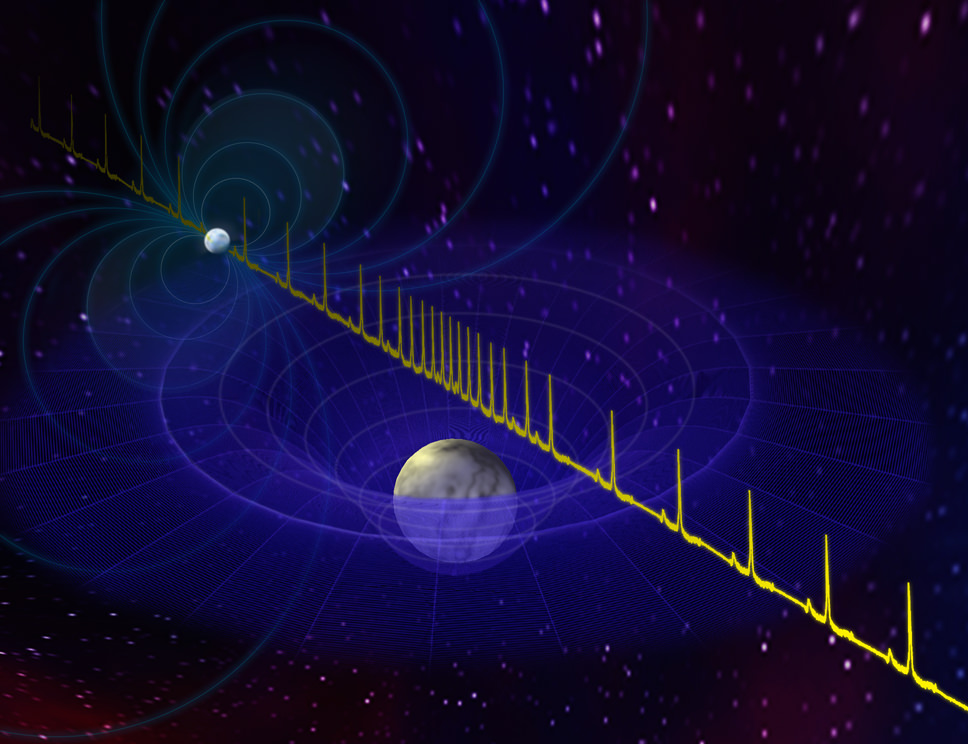
Pulses from neutron star (rear) are slowed as they pass near foreground white dwarf. This effect allowed astronomers to measure masses of the system. CREDIT: Bill Saxton, NRAO/AUI/NSF

[/caption]

The discovery of a super massive neutron star has thrown our understanding of stellar evolution into turmoil. The new star, called PSR J1614-2230 contains twice the mass of the Sun but compressed down into a star that is smaller than the Earth (you could fit over a million Earth’s inside the Sun by comparison). It is estimated a thimbleful of material from the star could weigh more than 500 million tons — that equates to about a million airliners. The study has cast serious doubt over how matter reacts under extreme densities.

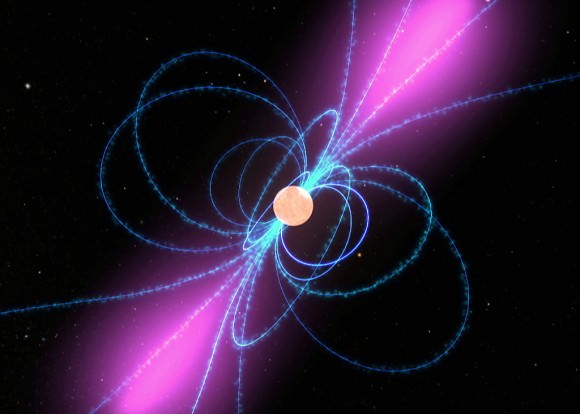
The study by a team of astronomers using the National Radio Astronomy Observatory in New Mexico focussed its attention on the star which is about 3,000 light years away (the distance light can travel in 3,000 years at a speed of 300,000 km per second). The stellar corpse whose life ended long ago is now rotating at an incredible speed, completing 317 rotations every second. Its emitting an intense beam of energy from its polar regions which just happens to point in the direction of us here on Earth. We can detect this radiation beam as it flashes on and off like a celestial lighthouse. This type of neutron star is classed a pulsar.

Artist impression of Pulsar

Rather fortuitously, the star is part of a binary star system and is orbited by a white dwarf star which completes one orbit in just nine days. Its through the measurements of the interaction of the two which gave astronomers the clue as to the pulsar’s mass. The orbit of the white dwarf takes it between the beam of radiation and us here on Earth so that the energy from the beam has to pass close by the companion star. By measuring the delay in the beam’s arrival caused by distortion of space-time in the proximity of the white dwarf, scientists can determine the mass of both objects. Its an effect called the Shapiro Delay and its simply luck that the orientation of the stars to the Earth allows the effect to be measured.

Dave Finley, Public Information Officer from NRAO told Universe Today ‘Pulsars are neutron stars, whose radiation beams emerge from the poles and sweep across the Earth.  The orientation of the poles (and thus of the beams) is a matter of chance. We just got very lucky with this system.’

The discovery which was made possible by the new ‘Green Bank Ultimate Pulsar Processing Instrument (GUPPI) was able to measure the pulses from the pulsar with incredible accuracy and thus come to the conclusion that the star weighed in at a hefty two times the mass of the Sun. Current theories suggested a mass of around one and a half solar masses were possible but this new discovery changes the understanding of the composition of such stars, even to the subatomic level.

Neutron stars or pulsars are extreme objects at the very edges of the conditions that matter can exist. They really test our knowledge of the physical Universe and slowly but surely, through dedicated work of teams of astronomers, we are not only learning more about the stars above our heads but more and more about matter in the Universe in which we live.

Mark Thompson is a writer and the astronomy presenter on the BBC One Show. See his website, The People’s Astronomer, and you can follow him on Twitter, @PeoplesAstro

Source: NRAO

Where’s M31’s Thick Disc?

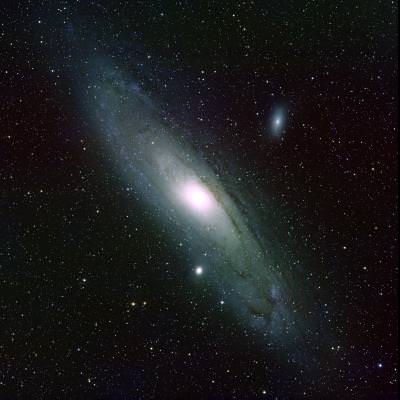
Within our own galaxy, the thick disc is a distinct population of stars that resides above and below the main (thin) disc. Its stars have a larger range of velocities, are generally older and more metal poor. While astronomers aren’t entirely sure how it formed (remnants of accretion of small galaxies or ejection from the thin disc), it’s certainly there and analogues have been observed in other galaxies, more than 10 megaparsecs away. If these thick discs are truly a product of mergers, then galaxies showing evidence of mergers in other regards should show the presence of this second population as well. Yet in the case of M31, the Andromeda galaxy, the closest major galaxy to our own, which is thought to have a rich merger history, traces of the thick disc have proved elusive. So where is it?


Part of the problem in finding this galactic component is the angle at which the galaxy is presented to us. The galaxies for which a thick disc component have been detected (aside from our own) all lie edge on. This makes the process of finding the thick component greatly simplified. Astronomers can use photometric systems designed for detecting different populations of stars (young vs. old) and observe the change in distribution. When galaxies are presented closer to face on, the projection of the thick component onto the thin makes the identification far more difficult. The Andromeda galaxy is somewhere in between these two extremes and makes an angle of 77° on the sky (where 90° is edge on).

Due to this difficulty, another method is necessary to search for this extended population. Since 2002, a team led by Michelle Collins of Cambridge university has been using the Keck II telescope to search for the expected disc. To do this, the team has been using spectroscopic observations of numerous red giant stars to determine if a specific sub-population can be found with thick disc characteristics. While a sub-population has been discovered before in M31, its velocity dispersion was too low, and the distribution was too closely tied to the classical thin disc to truly be considered the missing component. Instead, it is referred to as the “extended disc”.

But where others have failed, Collins’ team has prevailed. From her team’s study, a recent paper claims to have discovered the thick disc and with such a large sample, have made some interesting observations about its nature. The first is that M31’s thick disc is nearly three times as thick. Additionally, the average velocity of both the thin and thick discs are notably higher (thinM31 = 32.0 kms-1, thinMW = 20.0 kms-1; thickM31 = 45.7 kms-1, thickMW = 40.0 km-1). If the thick disc is indeed related to mergers, then this may indicate that M31 has undergone a more intensive period of recent interactions than our own galaxy. However, the team notes that, from their observations alone, they are unable to constrain the formation methods of this component. While other studies have shown that accretion and ejection each leave distinct fingerprints, the necessary components were not mapped in sufficient detail to distinguish between the two.

Hubble Predicts the Future of Omega Centauri

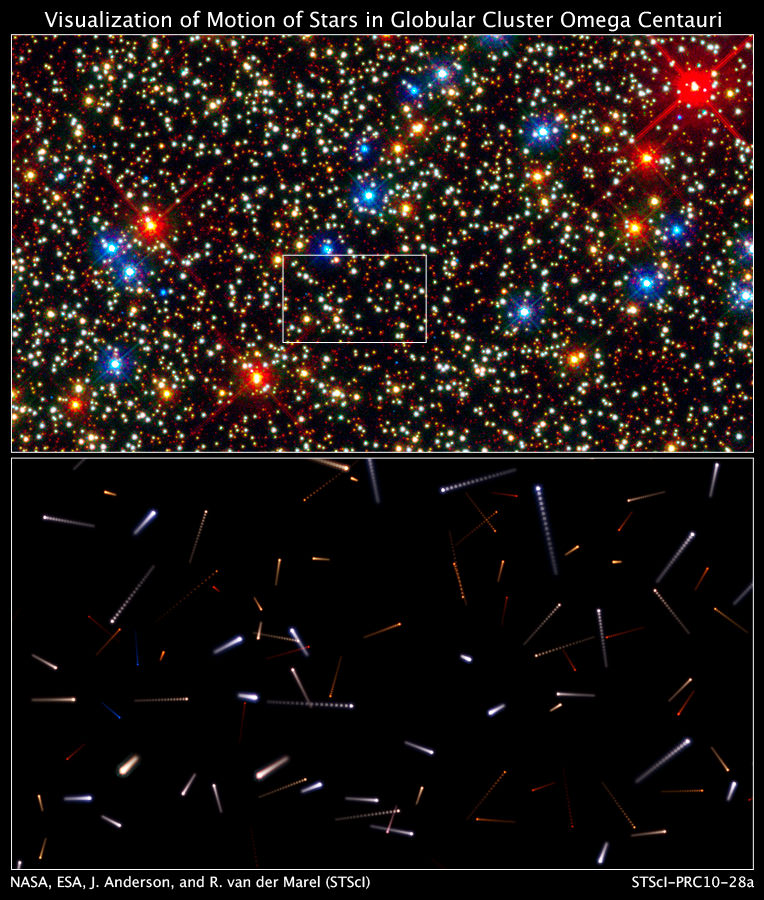
The current and future positions of stars in Omega Centauri. Credit: NASA, ESA, and J. Anderson and R. van der Marel (STScI)

[/caption]

Using four years of data from the Hubble Space Telescope’s Advanced Camera for Surveys, astronomers have made the most accurate measurements of the movement of stars in the globular cluster Omega Centauri, and now can predict their movements for the next 10,000 years. This “beehive” of stars is tightly crammed together, so resolving the individual stars was a job that perhaps only Hubble could do. “It takes high-speed, sophisticated computer programs to measure the tiny shifts in the positions of the stars that occur in only four years’ time,” says astronomer Jay Anderson of the Space Telescope Science Institute in Baltimore, Md., who conducted the study with fellow Institute astronomer Roeland van der Marel. “Ultimately, though, it is Hubble’s razor-sharp vision that is the key to our ability to measure stellar motions in this cluster.”

Astronomers say that the precise measurement of star motions in giant clusters can yield insights into how stellar groupings formed in the early universe, and whether an “intermediate mass” black hole, one roughly 10,000 times as massive as our Sun, might be lurking among the stars.

Analyzing archived images taken over a four-year period by Hubble’s astronomers have made the most accurate measurements yet of the motions of more than 100,000 cluster inhabitants, the largest survey to date to study the movement of stars in any cluster.

The astronomers used the Hubble images, which were taken in 2002 and 2006, to make a movie simulation of the frenzied motion of the cluster’s stars. The movie shows the stars’ projected migration over the next 10,000 years.

Omega Centauri is the biggest and brightest globular cluster in the Milky Way, and one of the few that can be seen by the unaided eye. It is located in the constellation Centaurus, Omega Centauri, so is viewable in the southern skies, and is one of about 150 such clusters in our Milky Way Galaxy.

In this video below, astronomers Jay Anderson and Roeland van der Marel discuss their in-depth study of the giant cluster Omega Centauri.

Source: HubbleSite

Watch Kepler Press Conference Today Live On Universe Today

Get the news of the latest findings regarding stars and their structures during a press conference that will be streamed live from Aarhus University in Denmark today at 11 am EDT (1500 GMT). Using data from NASA’s Kepler spacecraft, an international research team has examined and characterized thousands of stars by using the natural pulse of stellar light waves, thereby gaining new insights into stellar structure and
evolution.

Interstellar Scintilation

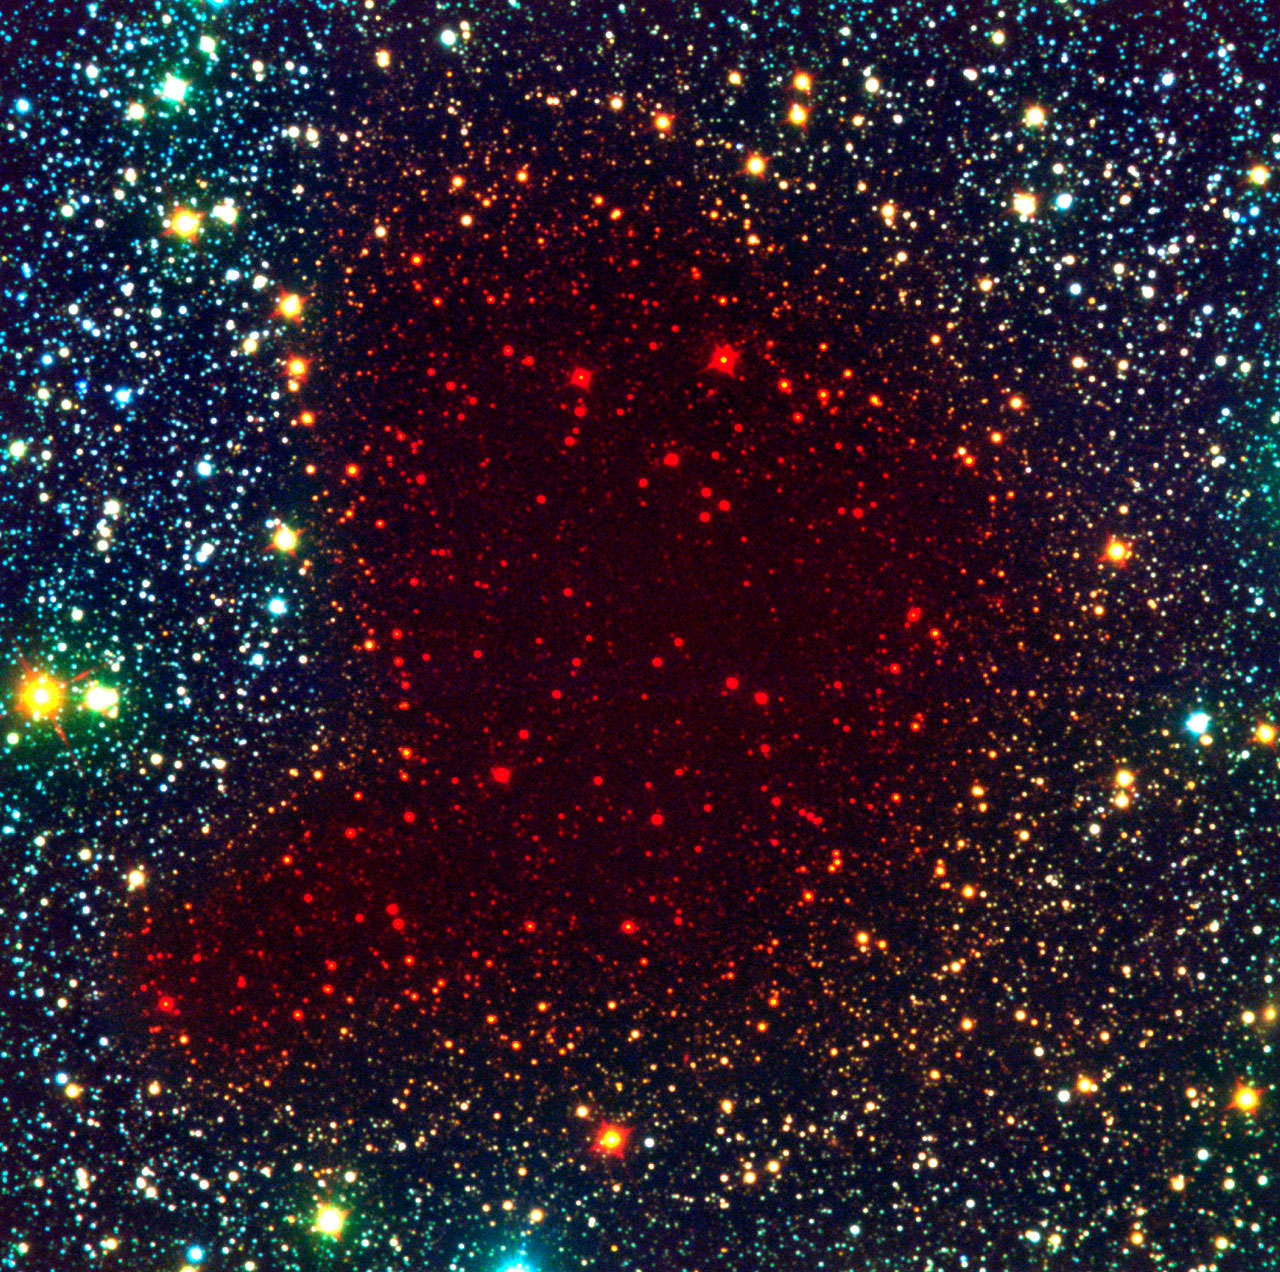
Barnard 68 (Credit: ESO)

[/caption]

Anyone who has looked at stars in the night sky (especially ones low on the horizon) has undoubtedly seen the common effect of twinkling. This effect is caused by turbulence in the atmosphere as small over densities cause the path of the light to bend ever so slightly. Often, vivid color shifts occur since the effects are wavelength dependent. All of this happens in the short distance between the edge of the atmosphere and our eyes. Yet often times, giant molecular clouds lie between our detectors and a star. Could these clouds of gas and dust cause a twinkling effect as well?


In theory, there’s no reason they shouldn’t. As the giant molecular clouds intercepting the incoming starlight move and distort, so too should the path of the light. The difference is that, due to the extremely low density and extremely large size, the timescales over which this distortion would take place would be far longer. Should it be discovered, it would provide astronomers another method by which to discover previously hidden gas.

Doing this is precisely the goals of a team of astronomers working from the Paris University and Sharif University in Iran. To get and understanding of what to expect, the team first simulated the effect, taking into account the properties of the cloud (distribution, velocity, etc…) as well as refraction and reflection. They estimated that, for a star in the Large Magellanic Cloud with light passing through typical galactic H2 gas, this would produce twinkles with changes taking around 24 minutes.

Yet there are many other effects which can produce modulations on the same timescale such as variable stars. Additional constraints would be necessary to claim that a change would be due to a twinkling effect and not a product of the star itself. As stated before, the effect is different for different wavelengths which would produce a “variation of the characteristic time scale … between the red side of the optical spectrum and the blue side.”

With expectations in hand, the team began searching for this effect in areas of the sky in which they knew especially high densities of gas to exist. Thus, they pointed their telescopes towards dense nebulae known as Bok globules like Barnard 68 (pictured above). Observations were taken using the 3.6 meter ESO NTT-SOFI telescope since it had the capabilities to also take infrared images and better explore the potential effects on the red side of the spectrum.

From their observations over two nights, the team discovered one instance in which the modulation of brightness in the different wavelengths followed the predicted effects. However, they note that from a single observation of their effects, it does not conclusively demonstrate the principle. The team also observed stars in the direction of the Small Magellanic Cloud to attempt to observe this twinkling effect in that direction due to previously undetected clouds along the line of sight. In this attempt, they were unsuccessful. Further similar observations along these lines in the future could help to constrain the amount of cold gas within the galaxy.

The Hunt for Young Exoplanets

While there is a great deal of excitement and effort in the hopes of finding small, terrestrial sized exoplanets, another realm of exoplanet discovery that is often overlooked is that of ones of differing ages to explore how planetary systems can evolve. The first discovered exoplanet orbited a pulsar, showing that planets can be hardy enough to survive the potential violent deaths of their parent stars. On the other end, young planets can help astronomers constrain how planets form and a potential new discovery may help in those regards.


Historically, astronomers have often avoided looking at stars younger than about 100 million years. Their young nature tends to make them unruly. They are prone to flares and other eccentric behaviors that often make observations messy. Additionally, many young stars often retain debris disks or are still embedded in the nebula in which they formed which also obscures observations.

Despite this, some astronomers have begun developing targeted searches for young exoplanets. The age of the exoplanet is not independently derived, but instead, taken from the age of the host star. This too can be difficult to determine. For isolated stars, there are precious few methods (such as gyrochronology) and they generally have large errors associated with them. Thus, instead of looking for isolated stars, astronomers searching for young exoplanets have tended to focus on clusters which can be dated more easily using the main sequence turn off method.

Through this methodology, astronomers have searched clusters and other groups, such as Beta Pictoris which turned up a planet earlier this year. The Beta Pic moving group boasts an age of ~12 million years making it one of the youngest associations currently known.

Trumpler 37 (also known as IC 1396 and the Elephant Trunk Nebula) is one of the few clusters with an even younger age of 1-5 million years. This was one of several young clusters observed by a team of German astronomers led by Gracjan Maciejewski of Jena University. The group utilized an array of telescopes across the world to continuously monitor Trumpler 37 for several weeks. During that time, they discovered numerous flares and variable stars, as well as a star with a dip in its brightness that could be a planet.

The team cautions that the detection may not be a planet. Several objects can mimic planetary transit lightcurves such as “the central transit of a low-mass star in front of a large main-sequence star or red giant, grazing eclipses in systems consisting of two main-sequence stars and a contamination of a fainter eclipsing binary along the same line of sight.” Due to the physics of small objects, the size of brown dwarfs and many Jovian type planets are similar leading difficulty in distinguishing from the light curve alone. Spectroscopic results will have to be undertaken to confirm the object truly is a planet.

However, assuming it is, based on the size of the dip in brightness, the team predicts the planet is about twice the radius of Jupiter, and about 15 times the mass. If so, this would be in good agreement with models of planetary formation for the expected age. Ultimately, planets of such age will help test our understanding of how planets form, whether it be from a single gravitational collapse early on, or slow accretion over time.

Breaking News: The Sun Worked 175 Years Ago!

The sunspot butterfly diagram. This modern version is constructed (and regularly updated) by the solar group at NASA Marshall Space Flight Center.

[/caption]

You’ll have to forgive my title. After writing so many articles as moderately as I could, I couldn’t help but engage in a bit of sensationalism of my own, especially in the interest of sarcasm. Although it’s not especially exciting that the sun has indeed been working for nearly two centuries (indeed, much longer than that), what is interesting is how using historical data, scientists have confirmed that process we see today have been relatively consistent since 1825.


The observations revolve around a familiar diagram known as the Butterfly diagram (pictured above). This diagram depicts the position of sunspots at various latitudes on the sun’s surface as time progresses. At the beginning of a cycle, sunspots start of at high latitudes and as the cycle progresses, appear at lower and lower latitudes until they disappear and the cycle repeats. The pattern formed resembles the wings of a butterfly, thereby giving the diagram its name.

Although sunspots have been observed as far back as 364 BC by Chinese astronomers, telescopic observations of them did not start until the early 1600’s. Continuous observation of the sun and its spots started in 1876 at the Royal Greenwich Observatory. There Edward Maunder recognized the pattern of sunspots and published them in the format that is the now famous Butterfly diagram in 1904. The diagram, as its usually shown only comprises data starting from around 1876 and continuing until present day. But the use of new records have extended the diagram back an additional 51 years, covering four new solar cycles. Although many observations exist with total sunspot counts, this new set of data includes detailed documentation of the position of the spots on the solar disc.

The observations were created by German astronomer Heinrich Schwabe. Originally an apothecary, he won a telescope in a lottery in 1825 and was fascinated, selling his family business four years later. Schwabe observed the Sun compulsively attempting to discover a new planet with an orbit interior to Mercury by witnessing it transiting the Sun. Although this effort was doomed to failure, Schwabe maintained detailed records of the sunspots. He even recognized the pattern of spots occurred in an 11 year cycle and published the discovery in 1843. It was met with little attention for several years until it was included in Alexander von Humboldt’s Kosmos. Due to this discovery, the 11 year solar cycle is also referred to as the Schwabe cycle.

From 1825 until 1867, Schwabe compiled at least 8468 observations of the Sun’s disc, drawn on 5cm circles. On his death, these documents, as well as the rest of his scientific works, were donated to the Royal Astronomical Society of London, and in 2009, were provided to a team of researchers for digitization. From the 8468 drawings, 7299 “have a coordinate system which is found to be aligned with the celestial equator” making them suitable for translation into scientific data.

Thus far, the team has converted 11% of the images into usable data and already, it has created a detailed butterfly diagram preceding those produced elsewhere. From it, the astronomers undertaking the conversion have made some interesting observations. The cycle beginning around 1834 was weaker than others around that time. The following one, starting around 1845, displayed a notable asymmetry where sunspots in the southern hemisphere were conspicuously lacking for the first 1-2 years of the cycle, whereas most cycles are fairly well mirrored. Although unusual, such phase shifts are not unprecedented. In fact, another study using historical records has demonstrated that, for the last 300 years, one hemisphere has always led (although not usually so greatly) for several cycles before trading off.

As with the recently discussed historical project on weather trends this reanalysis of historical data is one of many such projects giving us a broader picture of the trends we see today and how they have changed over time. While undoubtedly, many will be demonstrated to be mundane and familiar, undeserving of the exaggerated significance of my title, this is how science works: by expanding our knowledge to test our expectations.

NOTE: I’d Emailed the team asking for permission to show their image of the historical butterfly diagram, but since I haven’t gotten permission, I didn’t reproduce it here. But you can still view it in the paper. Go do so. It’s awesomely familiar.