[/caption]
Not only is the Kepler spacecraft hunting down extrasolar planets, but it also provides the ability to study stars in unprecedented detail. "We knew that if Kepler had the sensitivity of detecting Earth-size planets, that it would have capability to transform our knowledge of stars themselves," said Natalie Batalha of San Jose State University in California, a co-investigator on the Kepler Astroseismic Science Consortium. This international partnership of over 400 astronomers uses the Kepler spacecraft to "listen" to tiny oscillations, or "star quakes," in red giant stars, allowing scientists to do groundbreaking work in deducing the fundamental properties of stars.
In just the first year of Kepler's operation, the team has been able to study thousands of stars using astroseismology, while previously only a few dozen of stars had been "listened to" using this technique. "We can say Kepler is listening to thousands of musicians in the sky," said Daniel Huber, a graduate student at the University of Sydney, during a webcast of a press conference about the new findings.
"From first year of the Kepler mission we moved from having a couple of dozen of stars with a couple of weeks of data," said Travis Metcalfe, scientist at The National Center for Atmospheric Research, responding to a question posed by Universe today "to having one month to study each of a several thousands of stars. This is an enormous expansion of our capability to study this type of star and what the oscillations tells us." Similar to how seismologists study earthquakes to probe the Earth's interior, astroseismology measures the natural pulse of light waves from stars to gain new insights into stellar structure and evolution.
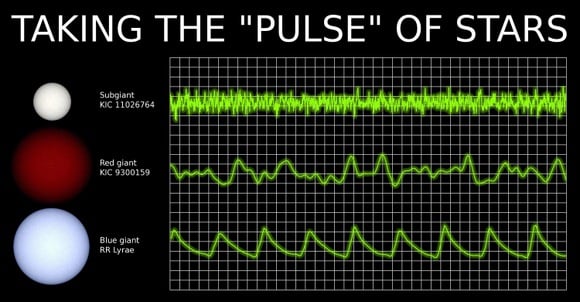
[caption id="attachment_76894" align="aligncenter" width="580" caption="The variations in brightness can be interpreted as vibrations, or oscillations within the stars, using a technique called asteroseismology. The oscillations reveal information about the internal structure of the stars, in much the same way that seismologists use earthquakes to probe the Earth's interior. Credit: Kepler Astroseismology team. "]
[/caption]
"Kepler allows us to study the periods of stellar oscillations, and we use them to study the cores of stars -- in a way to touch the stars -- and get the most accurate measurements of stars we have ever made," said Hans Kjeldsen, associate professor, KASC, Aarhus University in Denmark.
They can measure size and age with extreme precision and they have now characterized the structure and life cycle of over 1,000 red giants. What they have found so far confirms the current principals of stellar evolution and allows for better predictions of what might happen to our Sun in several billion years.
Kjeldsen said they are getting data of amazing quality. "We can now actually study stars of all phases and evolutionary stages, of different mass, and all different types. This is the amazing thing for me. Instead of looking one star for awhile and then moving on to next star, we now have access to thousands of stars at once. And having said that, there are still thousands and thousands of stars we still need to study."
Metcalfe said astroseismology listens to the oscillations of the star, and can hear a tone so low that even a whale would have a hard time hearing it. Kepler can see even tiny oscillations as a flickering in the star.
"Sound waves travel into the star and bring information up to the surface, which Kepler can see as a tiny flickering in brightness of the star," said astronomer Travis Metcalfe of The National Center for Atmospheric Research.
That flickering has a tone like the notes of a musical instrument. "We essentially measure the tone of these musical notes from the star," he said. "Larger stars flicker in lower tones while smaller stars in higher tones."
Listen to
Daniel Huber's Red Giant Oscillation Symphony
One star that Metcalfe has been focusing on is a red giant, that measured twice the size of the Sun. KIC 11026764 now has the most accurately known properties of any star in the Kepler field. In fact, few stars in the universe are known to similar accuracy, the team said. The oscillations reveal that this star is 5.94 billion years old and is powered by hydrogen fusion in a thin shell around a helium-rich core.
In this consortium, no dollars are actually exchanged between nations. The US provides the Kepler instrument and software pipeline, while the international partners are supplying human resources of ingenuity and scientific expertise.
"We're not just getting a great legacy of scientific results, but also a valuable symbiosis and partnership here," said Batalha.
You can watch the press conference on Universe Today
at this link.