Too Big, Too Soon. Monster Black Hole Seen Shortly After the Big Bang

This artist's concept shows the most distant supermassive black hole ever discovered. It is part of a quasar from just 690 million years after the Big Bang. Credit: Robin Dienel/Carnegie Institution for Science

It is a well known fact among astronomers and cosmologists that the farther into the Universe you look, the further back in time you are seeing. And the closer astronomers are able to see to the Big Bang, which took place 13.8 billion years ago, the more interesting the discoveries tend to become. It is these finds that teach us the most about the earliest periods of the Universe and its subsequent evolution.

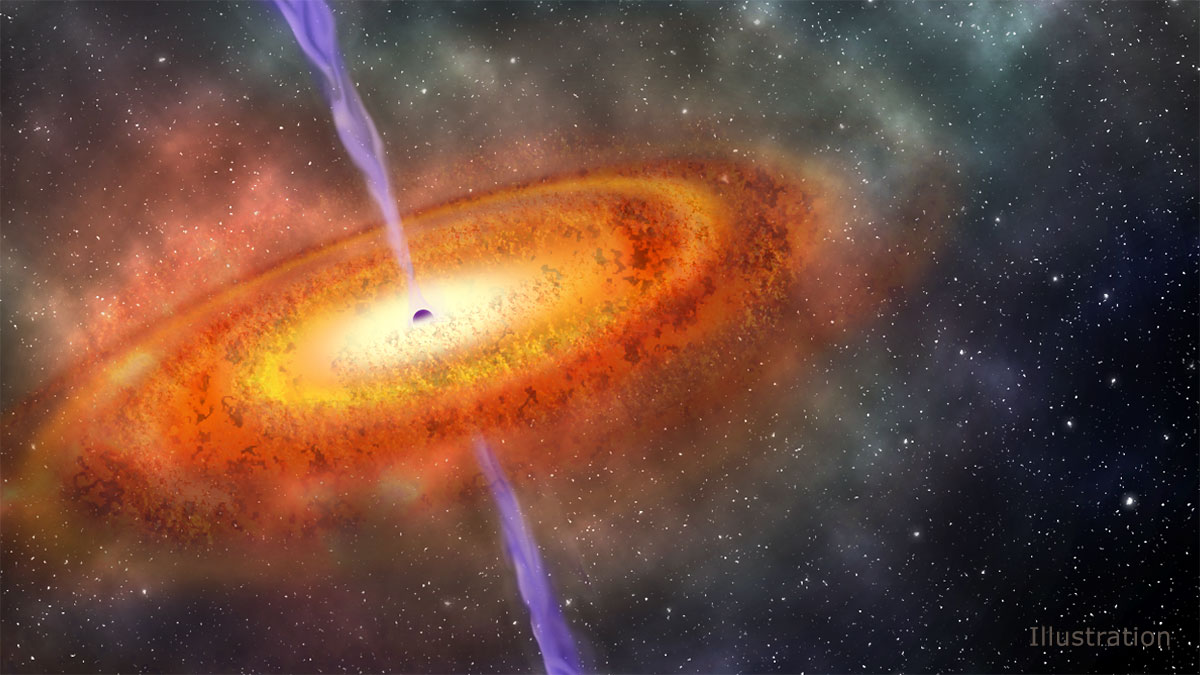
For instance, scientists using the Wide-field Infrared Survey Explorer (WISE) and the Magellan Telescopes recently observed the earliest Supermassive Black Hole (SMBH) to date. According to the discovery team’s study, this black hole is roughly 800 million times the mass of our Sun and is located more than 13 billion light years from Earth. This makes it the most distant, and youngest, SMBH observed to date.

The study, titled “An 800-million-solar-mass black hole in a significantly neutral Universe at a redshift of 7.5“, recently appeared in the journal Nature. Led by Eduardo Bañados, a researcher from the Carnegie Institution for Science, the team included members from NASA’s Jet Propulsion Laboratory, the Max Planck Institute for Astronomy, the Kavli Institute for Astronomy and Astrophysics, the Las Cumbres Observatory, and multiple universities.

Artist’s impression of ULAS J1120+0641, a very distant quasar powered by a black hole with a mass two billion times that of the Sun. Credit: ESO/M. Kornmesser

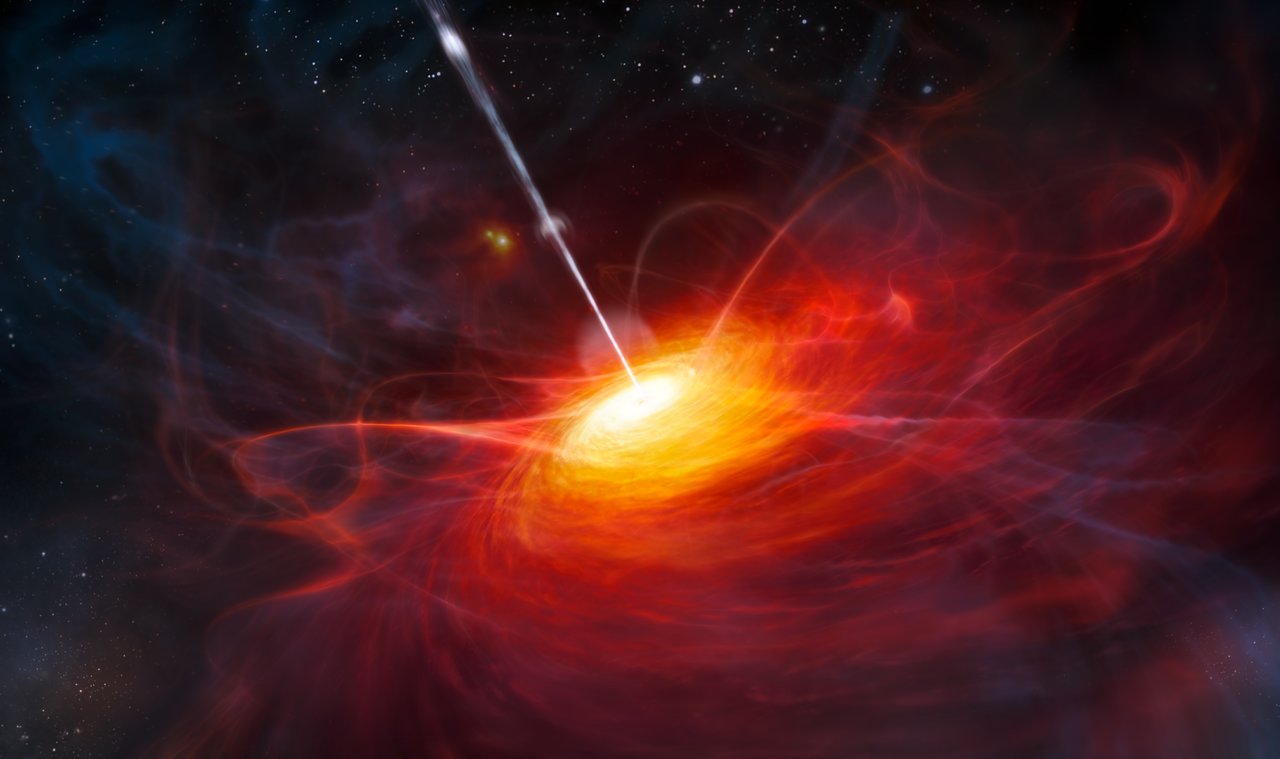
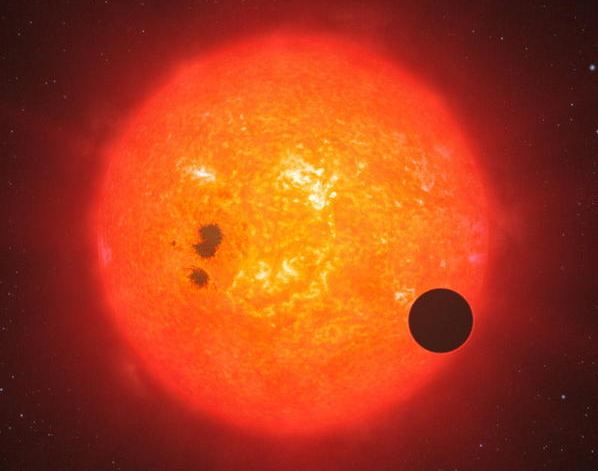
As with other SMBHs, this particular discovery (designated J1342+0928) is a quasar, a class of super bright objects that consist of a black hole accreting matter at the center of a massive galaxy. The object was discovered during the course of a survey for distant objects, which combined infrared data from the WISE mission with ground-based surveys. The team then followed up with data from the Carnegie Observatory’s Magellan telescopes in Chile.

As with all distant cosmological objects,  J1342+0928’s distance was determined by measuring its redshift. By measuring how much the wavelength of an object’s light is stretched by the expansion of the Universe before it reaches Earth, astronomers are able to determine how far it had to travel to get here. In this case, the quasar had a redshift of 7.54, which means that it took more than 13 billion years for its light to reach us.

As Xiaohui Fan of the University of Arizona’s Steward Observatory (and a co-author on the study) explained in a Carnegie press release:

“This great distance makes such objects extremely faint when viewed from Earth. Early quasars are also very rare on the sky. Only one quasar was known to exist at a redshift greater than seven before now, despite extensive searching.”

Given its age and mass, the discovery of this quasar was quite the surprise for the study team. As Daniel Stern, an astrophysicist at NASA’s Jet Propulsion Laboratory and a co-author on the study, indicated in a NASA press release, “This black hole grew far larger than we expected in only 690 million years after the Big Bang, which challenges our theories about how black holes form.”

This illustration shows the evolution of the Universe, from the Big Bang on the left, to modern times on the right. Image: NASA

Essentially, this quasar existed at a time when the Universe was just beginning to emerge from what cosmologists call the “Dark Ages”. During this period, which began roughly 380,000 years to 150 million years after the Big Bang, most of the photons in the Universe were interacting with electrons and protons. As a result, the radiation of this period is undetectable by our current instruments – hence the name.

The Universe remained in this state, without any luminous sources, until gravity condensed matter into the first stars and galaxies. This period is known as the “Reinozation Epoch”, which lasted from 150 million to 1 billion years after the Big Bang and was characterized by the first stars, galaxies and quasars forming. It is so-named because the energy released by these ancient galaxies caused the neutral hydrogen of the Universe to get excited and ionize.

Once the Universe became reionzed, photons could travel freely throughout space and the Universe officially became transparent to light. This is what makes the discovery of this quasar so interesting. As the team observed, much of the hydrogen surrounding it is neutral, which means it is not only the most distant quasar ever observed, but also the only example of a quasar that existed before the Universe became reionized.

In other words, J1342+0928 existed during a major transition period for the Universe, which happens to be one of the current frontiers of astrophysics. As if this wasn’t enough, the team was also confounded by the object’s mass. For a black hole to have become so massive during this early period of the Universe, there would have to be special conditions to allow for such rapid growth.

A billion years after the big bang, hydrogen atoms were mysteriously torn apart into a soup of ions. Credit: NASA/ESA/A. Felid (STScI)).

What these conditions are, however, remains a mystery. Whatever the case may be, this newly-found SMBH appears to be consuming matter at the center of a galaxy at an astounding rate. And while its discovery has raised many questions, it is anticipated that the deployment of future  telescopes will reveal more about this quasar and its cosmological period. As Stern said:

“With several next-generation, even-more-sensitive facilities currently being built, we can expect many exciting discoveries in the very early universe in the coming years.”

These next-generation missions include the European Space Agency’s Euclid mission and NASA’s Wide-field Infrared Survey Telescope (WFIRST). Whereas Euclid will study objects located 10 billion years in the past in order to measure how dark energy influenced cosmic evolution, WFIRST will perform wide-field near-infrared surveys to measure the light coming from a billion galaxies.

Both missions are expected to reveal more objects like J1342+0928. At present, scientists predict that there are only 20 to 100 quasars as bright and as distant as J1342+0928 in the sky. As such, they were most pleased with this discovery, which is expected to provide us with fundamental information about the Universe when it was only 5% of its current age.

Further Reading: NASA, Carnegie Science, Nature

Earth and Venus are the Same Size, so Why Doesn’t Venus Have a Magnetosphere? Maybe it Didn’t Get Smashed Hard Enough

At a closest average distance of 41 million km (25,476,219 mi), Venus is the closest planet to Earth. Credit: NASA/JPL/Magellan

For many reasons, Venus is sometimes referred to as “Earth’s Twin” (or “Sister Planet”, depending on who you ask). Like Earth, it is terrestrial (i.e. rocky) in nature, composed of silicate minerals and metals that are differentiated between an iron-nickel core and silicate mantle and crust. But when it comes to their respective atmospheres and magnetic fields, our two planets could not be more different.

For some time, astronomers have struggled to answer why Earth has a magnetic field (which allows it to retain a thick atmosphere) and Venus do not. According to a new study conducted by an international team of scientists, it may have something to do with a massive impact that occurred in the past. Since Venus appears to have never suffered such an impact, its never developed the dynamo needed to generate a magnetic field.

The study, titled “Formation, stratification, and mixing of the cores of Earth and Venus“, recently appeared in the scientific journal Earth and Science Planetary Letters. The study was led by Seth A. Jacobson of Northwestern University, and included members from the Observatory de la Côte d’Azur, the University of Bayreuth, the Tokyo Institute of Technology, and the Carnegie Institution of Washington.

The Earth's layers, showing the Inner and Outer Core, the Mantle, and Crust. Credit: discovermagazine.com
The Earth’s layers, showing the Inner and Outer Core, the Mantle, and Crust. Credit: discovermagazine.com

For the sake of their study, Jacobson and his colleagues began considering how terrestrial planets form in the first place. According to the most widely-accepted models of planet formation, terrestrial planets are not formed in a single stage, but from a series of accretion events characterized by collisions with planetesimals and planetary embryos – most of which have cores of their own.

Recent studies on high-pressure mineral physics and on orbital dynamics have also indicated that planetary cores develop a stratified structure as they accrete. The reason for this has to do with how a higher abundance of light elements are incorporated in with liquid metal during the process, which would then sink to form the core of the planet as temperatures and pressure increased.

Such a stratified core would be incapable of convection, which is believed to be what allows for Earth’s magnetic field. What’s more, such models are incompatible with seismological studies that indicate that Earth’s core consists mostly of iron and nickel, while approximately 10% of its weight is made up of light elements – such as silicon, oxygen, sulfur, and others. It’s outer core is similarly homogeneous, and composed of much the same elements.

As Dr. Jacobson explained to Universe Today via email:

“The terrestrial planets grew from a sequence of accretionary (impact) events, so the core also grew in a multi-stage fashion. Multi-stage core formation creates a layered stably stratified density structure in the core because light elements are increasingly incorporated in later core additions. Light elements like O, Si, and S increasingly partition into core forming liquids during core formation when pressures and temperatures are higher, so later core forming events incorporate more of these elements into the core because the Earth is bigger and pressures and temperatures are therefore higher.

“This establishes a stable stratification which prevents a long-lasting geodynamo and a planetary magnetic field. This is our hypothesis for Venus. In the case of Earth, we think the Moon-forming impact was violent enough to mechanically mix the core of the Earth and allow a long-lasting geodynamo to generate today’s planetary magnetic field.”

To add to this state of confusion, paleomagnetic studies have been conducted that indicate that Earth’s magnetic field has existed for at least 4.2 billion years (roughly 340 million years after it formed). As such, the question naturally arises as to what could account for the current state of convection and how it came about. For the sake of their study, Jacobson and his team considering the possibility that a massive impact could account for this. As Jacobson indicated:

“Energetic impacts mechanically mix the core and so can destroy stable stratification. Stable stratification prevents convection which inhibits a geodynamo. Removing the stratification allows the dynamo to operate.”

Basically, the energy of this impact would have shaken up the core, creating a single homogeneous region within which a long-lasting geodynamo could operate. Given the age of Earth’s magnetic field, this is consistent with the Theia impact theory, where a Mars-sized object is believed to have collided with Earth 4.51 billion years ago and led to the formation of the Earth-Moon system.

This impact could have caused Earth’s core to go from being stratified to homogeneous, and over the course of the next 300 million years, pressure and temperature conditions could have caused it to differentiate between a solid inner core and liquid outer core. Thanks to rotation in the outer core, the result was a dynamo effect that protected our atmosphere as it formed.

Artist’s concept of a collision between proto-Earth and Theia, believed to happened 4.5 billion years ago. Credit: NASA

The seeds of this theory were presented last year at the 47th Lunar and Planetary Science Conference in The Woodlands, Texas. During a presentation titled “Dynamical Mixing of Planetary Cores by Giant Impacts“, Dr. Miki Nakajima of Caltech – one of the co-authors on this latest study – and David J. Stevenson of the Carnegie Institution of Washington. At the time, they indicated that the stratification of Earth’s core may have been reset by the same impact that formed the Moon.

It was Nakajima and Stevenson’s study that showed how the most violent impacts could stir the core of planets late in their accretion. Building on this, Jacobson and the other co-authors applied models of how Earth and Venus accreted from a disk of solids and gas about a proto-Sun. They also applied calculations of how Earth and Venus grew, based on the chemistry of the mantle and core of each planet through each accretion event.

The significance of this study, in terms of how it relates to the evolution of Earth and the emergence of life, cannot be understated. If Earth’s magnetosphere is the result of a late energetic impact, then such impacts could very well be the difference between our planet being habitable or being either too cold and arid (like Mars) or too hot and hellish (like Venus). As Jacobson concluded:

“Planetary magnetic fields shield planets and life on the planet from harmful cosmic radiation. If a late, violent and giant impact is necessary for a planetary magnetic field then such an impact may be necessary for life.”

Looking beyond our Solar System, this paper also has implications in the study of extra-solar planets. Here too, the difference between a planet being habitable or not may come down to high-energy impacts being a part of the system’s early history. In the future, when studying extra-solar planets and looking for signs of habitability, scientists may very well be forced to ask one simple question: “Was it hit hard enough?”

Further Reading: Earth Science and Planetary Letters

Astronauts in Trouble Will be Able to Press the “Take Me Home” Button

NASA astronauts will be able to find their way back to the spacecraft more easily with the help of a self-return system developed by Draper. Credit: NASA

Living and working in space for extended periods of time is hard work. Not only do the effects of weightless take a physical toll, but conducting spacewalks is a challenge in itself. During a spacewalk, astronauts can become disoriented, confused and nauseous, which makes getting home difficult. And while spacewalks have been conducted for decades, they are particularly important aboard the International Space Station (ISS).

Hence why the Charles Stark Draper Laboratory (aka. Draper Inc.), a Massachusetts-based non-profit research and development company, is designing a new spacesuit with support from NASA. In addition to gyroscopes, autonomous systems and other cutting-edge technology, this next-generation spacesuit will feature a “Take Me Home” button that will remove a lot of the confusion and guesswork from spacewalks.

Spacewalks, otherwise known as “Extra-Vehicular Activity” (EVA), are an integral part of space travel and space exploration. Aboard the ISS, spacewalks usually last between five and eight hours, depending on the nature of the work being performed. During a spacewalk, astronauts use tethers to remain fixed to the station and keep their tools from floating away.

Another safety feature that comes into play is the Simplified Aid for EVA Rescue (SAFER), a device that is worn by astronauts like a backpack. This device relies on jet thrusters that are controlled by a small joystick to allow astronauts to move around in space in the event that they become untethered and float away. This device was used extensively during the construction of the ISS, which involved over 150 spacewalks.

However, even with a SAFER on, it is not difficult for an astronaut to become disoriented during and EVA and lose their bearings. Or as Draper engineer Kevin Duda indicated in a Draper press statement, “Without a fail-proof way to return to the spacecraft, an astronaut is at risk of the worst-case scenario: lost in space.” As a space systems engineer, Duda has studied astronauts and their habitat on board the International Space Station for some time.

He and his colleagues recently filed a patent for the technology, which they refer to as an “assisted extravehicular activity self-return” system. As they described the concept in the patent:

“The system estimates a crewmember’s navigation state relative to a fixed location, for example on an accompanying orbiting spacecraft, and computes a guidance trajectory for returning the crewmember to that fixed location. The system may account for safety and clearance requirements while computing the guidance trajectory.”

On the way back from the moon, Apollo 17 astronaut Ronald Evans went on a spacewalk. Evans brought in film from cameras outside the command and service module. Apollo 17 was the final Apollo mission to the moon. Credit: NASA

In one configuration, the system will control the crew member’s SAFER pack and follow a prescribed trajectory back to a location designated as “home”. In another, the system will provide directions in the form of visual, auditory or tactile cues to direct the crew member back to their starting point. The crew member will be able to activate the system themselves, but a remote operator will also be able to turn it on if need be.

According to Séamus Tuohy, Draper’s director of space systems, this type of return-home technology is an advance in spacesuit technology that is long overdue. The current spacesuit features no automatic navigation solution—it is purely manual—and that could present a challenge to our astronauts if they are in an emergency,” he said.

Such a system presents multiple challenges, not the least of which has to do with Global Positioning Systems (GPS), which are simply not available in space. The system also has to compute an optimal return trajectory that accounts for time, oxygen consumption, safety and clearance requirements. Lastly, it has to be able to guide a disoriented (or even unconscious astronaut) effectively back to their airlock. As Duda explained:

“Giving astronauts a sense of direction and orientation in space is a challenge because there is no gravity and no easy way to determine which way is up and down. Our technology improves mission success in space by keeping the crew safe.”

Even tools must be tethered in space. Astronauts always make sure their tools are connected to their spacesuits so the tools don’t float away. Credit: NASA

The solutions, as far as Duda and his colleagues are concerned, is to equip future spacesuits with sensors that can monitor the wearer’s movement, acceleration, and relative position to a fixed object. According to the patent, this would likely be an accompanying orbiting spacecraft. The navigation, guidance and control modules will also be programmed to accommodate various scenarios, ranging from GPS to vision-aided navigation or star tracking.

Draper has also developed proprietary software for the system that fuses data from vision-based and inertial navigation systems. The system will further benefit from the company’s extensive work in wearable technology, which also has extensive commercial applications. By developing spacesuits that allow the wearer to obtain more data from their surroundings, they are effectively bringing augmented reality technology into space.

Beyond space exploration, the company also foresees applications for their navigation system here at home. These include first responders and firefighters who have to navigate through smoke-filled rooms, skydivers falling towards the Earth, and scuba divers who might become disoriented in deep water. Literally any situation where life and death may depend on not getting lost could benefit from this technology.

Further Reading: Draper, Google Patents

The Space Station is Getting a New Gadget to Detect Space Debris

Artist's impression of all the space junk in Earth orbit. Credit: NASA

Since the 1960s, NASA and other space agencies have been sending more and more stuff into orbit. Between the spent stages of rockets, spent boosters, and satellites that have since become inactive, there’s been no shortage of artificial objects floating up there. Over time, this has created the significant (and growing) problem of space debris, which poses a serious threat to the International Space Station (ISS), active satellites and spacecraft.

While the larger pieces of debris – ranging from 5 cm (2 inches) to 1 meter (1.09 yards) in diameter – are regularly monitored by NASA and other space agencies, the smaller pieces are undetectable. Combined with how common these small bits of debris are, this makes objects that measure about 1 millimeter in size a serious threat. To address this, the ISS is relying on a new instrument known as the Space Debris Sensor (SDS).

This calibrated impact sensor, which is mounted on the exterior of the station, monitors impacts caused by small-scale space debris. The sensor was incorporated into the ISS back in September, where it will monitor impacts for the next two to three years. This information will be used to measure and characterize the orbital debris environment and help space agencies develop additional counter-measures.

The International Space Station (ISS), seen here with Earth as a backdrop. Credit: NASA

Measuring about 1 square meter (~10.76 ft²), the SDS is mounted on an external payload site which faces the velocity vector of the ISS. The sensor consists of a thin front layer of Kapton – a polyimide film that remains stable at extreme temperatures – followed by a second layer located 15 cm (5.9 inches) behind it. This second Kapton layer is equipped with acoustic sensors and a grid of resistive wires, followed by a sensored-embedded backstop.

This configuration allows the sensor to measure the size, speed, direction, time, and energy of any small debris it comes into contact with. While the acoustic sensors measure the time and location of a penetrating impact, the grid measures changes in resistance to provide size estimates of the impactor. The sensors in the backstop also measure the hole created by an impactor, which is used to determine the impactor’s velocity.

This data is then examined by scientists at the White Sands Test Facility in New Mexico and at the University of Kent in the UK, where hypervelocity tests are conducted under controlled conditions. As Dr. Mark Burchell, one of the co-investigators and collaborators on the SDS from the University of Kent, told Universe Today via email:

“The idea is a multi layer device. You get a time as you pass through each layer. By triangulating signals in a layer you get position in that layer. So two times and positions give a velocity… If you know the speed and direction you can get the orbit of the dust and that can tell you if it likely comes from deep space (natural dust) or is in a similar earth orbit to satellites so is likely debris. All this in real time as it is electronic.”
The chip in the ISS’ Cupola window, photographed by astronaut Tim Peake. Credit: ESA/NASA/Tim Peake

This data will improve safety aboard the ISS by allowing scientists to monitor the risks of collisions and generate more accurate estimates of how small-scale debris exists in space. As noted, the larger pieces of debris in orbit are monitored regularly. These consists of the roughly 20,000 objects that are about the size of a baseball, and an additional 50,000 that are about the size of a marble.

However, the SDS is focused on objects that are between 50 microns and 1 millimeter in diameter, which number in the millions. Though tiny, the fact that these objects move at speeds of over 28,000 km/h (17,500 mph) means that they can still cause significant damage to satellites and spacecraft. By being able to get a sense of these objects and how their population is changing in real-time, NASA will be able to determine if the problem of orbital debris is getting worse.

Knowing what the debris situation is like up there is also intrinsic to finding ways to mitigate it. This will not only come in handy when it comes to operations aoard the ISS, but in the coming years when the Space Launch System (SLS) and Orion capsule take to space. As Burchell added, knowing how likely collisions will be, and what kinds of damage they may cause, will help inform spacecraft design – particularly where shielding is concerned.

“[O]nce you know the hazard you can adjust the design of future missions to protect them from impacts, or you are more persuasive when telling satellite manufacturers they have to create less debris in future,” he said. “Or you know if you really need to get rid of old satellites/ junk before it breaks up and showers earth orbit with small mm scale debris.”

The interior of the Hypervelocity Ballistic Range at NASA’s Ames Research Center. This test is used to simulate what happens when a piece of orbital debris hits a spacecraft in orbit. Credit: NASA/Ames

Dr. Jer Chyi Liou, in addition to being a co-investigator on the SDS, is also the NASA Chief Scientist for Orbital Debris and the Program Manager for the Orbital Debris Program Office at the Johnson Space Center. As he explained to Universe Today via email:

“The millimeter-sized orbital debris objects represent the highest penetration risk to the majority of operational spacecraft in low Earth orbit (LEO). The SDS mission will serve two purposes. First, the SDS will collect useful data on small debris at the ISS altitude. Second, the mission will demonstrate the capabilities of the SDS and enable NASA to seek mission opportunities to collect direct measurement data on millimeter-sized debris at higher LEO altitudes in the future – data that will be needed for reliable orbital debris impact risk assessments and cost-effective mitigation measures to better protect future space missions in LEO.”

The results from this experiment build upon previous information obtained by the Space Shuttle program. When the shuttles returned to Earth, teams of engineers inspected hardware that underwent collisions to determine the size and impact velocity of debris. The SDS is also validating the viability of impact sensor technology for future missions  at higher altitudes,  where risks from debris to spacecraft are greater than at the ISS altitude.

Further Reading: NASA

Two new Super-Earths Discovered Around a Red Dwarf Star

K2-18b and its neighbour, newly discovered K2-18c, orbit the red-dwarf star k2-18 locataed 111 light years away in the constellation Leo. Credit: Alex Boersma

The search for extra-solar planets has turned up some very interesting discoveries. Aside planets that are more-massive versions of their Solar counterparts (aka. Super-Jupiters and Super-Earths), there have been plenty of planets that straddle the line between classifications. And then there were times when follow-up observations have led to the discovery of multiple planetary systems.

This was certainly the case when it came to K2-18, a red dwarf star system located about 111 light-years from Earth in the constellation Leo. Using the ESO’s High Accuracy Radial Velocity Planet Searcher (HARPS), an international team of astronomers was recently examining a previously-discovered exoplanet in this system (K2-18b) when they noted the existence of a second exoplanet.

The study which details their findings – “Characterization of the K2-18 multi-planetary system with HARPS” – is scheduled to be published in the journal Astronomy and Astrophysics. The research was supported by the Natural Sciences and Research Council of Canada (NSERC) and the Institute for Research on Exoplanets – a consortium of scientists and students from the University of Montreal and McGill University.

Artist’s impression of a Super-Earth planet orbiting a Sun-like star. Credit: ESO/M. Kornmesser

Led by Ryan Cloutier, a PhD student at the University of Toronto’s Center for Planet Science and the University of Montréal’s Institute for Research on Exoplanets (iREx), the team included members from the University of Geneva, the University Grenoble Alpes, and the University of Porto. Together, the team conducted a study of K2-18b in the hopes of characterizing this exoplanet and determining its true nature.

When K2-18b was first discovered in 2015, it was found to be orbiting within the star’s habitable zone (aka. “Goldilocks Zone“). The team responsible for the discovery also determined that given its distance from its star, K2-18b’s surface received similar amounts of radiation as Earth. However, the initial estimates of the planet’s size left astronomers uncertain as to whether the planet was a Super-Earth or a mini-Neptune.

For this reason, Cloutier and his team sought to characterize the planet’s mass, a necessary step towards determining it’s atmospheric properties and bulk composition. To this end, they obtained radial velocity measurements of K2-18 using the HARPS spectrograph. These measurements allowed them to place mass constraints on previously-discovered exoplanet, but also revealed something extra.

As Ryan Cloutier explained in a UTSc press statement:

“Being able to measure the mass and density of K2-18b was tremendous, but to discover a new exoplanet was lucky and equally exciting… If you can get the mass and radius, you can measure the bulk density of the planet and that can tell you what the bulk of the planet is made of.”

Artist’s impression of a super-Earth with a dense atmosphere, which is what scientists now believe K2-18b is. Credit: NASA/JPL

Essentially, their radial velocity measurements revealed that K2-18b has a mass of about 8.0 ± 1.9 Earth masses and a bulk density of 3.3 ± 1.2 g/cm³. This is consistent with a terrestrial (aka. rocky) planet with a significant gaseous envelop and a water mass fraction that is equal to or less than 50%. In other words, it is either a Super-Earth with a small gaseous atmosphere (like Earths) or “water world” with a thick layer of ice on top.

They also found evidence for a second “warm” Super Earth named K2-18c, which has a mass of 7.5 ± 1.3 Earth masses, an orbital period of 9 days, and a semi-major axis roughly 2.4 times smaller than K2-18b. After re-examining the original light curves obtained from K2-18, they concluded that K2-18c was not detected because it has an orbit that does not lie on the same plane. As Cloutier described the discovery:

“When we first threw the data on the table we were trying to figure out what it was. You have to ensure the signal isn’t just noise, and you need to do careful analysis to verify it, but seeing that initial signal was a good indication there was another planet… It wasn’t a eureka moment because we still had to go through a checklist of things to do in order to verify the data. Once all the boxes were checked it sunk in that, wow, this actually is a planet.”

Unfortunately, the newly-discovered K2-18c orbits too closely to its star for it to be within it’s habitable zone. However, the likelihood of K2-18b being habitable remains probable, thought that depends on its bulk composition. In the end, this system will benefit from additional surveys that will more than likely involve NASA’s James Webb Space Telescope (JWST) – which is scheduled for launch in 2019.

Artist’s impression of Super-Earth orbiting closely to its red dwarf star. Credit: M. Weiss/CfA

These surveys are expecting to resolve the latest mysteries about this planet, which is whether it is Earth-like or a “water world”. “With the current data, we can’t distinguish between those two possibilities,” said Cloutier. “But with the James Webb Space Telescope (JWST) we can probe the atmosphere and see whether it has an extensive atmosphere or it’s a planet covered in water.”

As René Doyon – the principal investigator for the Near-Infrared Imager and Slitless Spectrograph (NIRISS), the Canadian Space Agency instrument on board JWST, and a co-author on the paper – explained:

“There’s a lot of demand to use this telescope, so you have to be meticulous in choosing which exoplanets to look at. K2-18b is now one of the best targets for atmospheric study, it’s going to the near top of the list.”

The discovery of this second Super-Earth in the K2-18 system is yet another indication of how prevalent multi-planet systems are around M-type (red dwarf) stars. The proximity of this system, which has at least one planet with a thick atmosphere, also makes it well-suited to studies that will teach astronomers more about the nature of exoplanet atmospheres.

Expect to hear more about this star and its planetary system in the coming years!

Further Reading: University of Toronto Scarborough, Astronomy and Astrophysics

What is the Transit Method?

In a series of papers, Professor Loeb and Michael Hippke indicate that conventional rockets would have a hard time escaping from certain kinds of extra-solar planets. Credit: NASA/Tim Pyle

Welcome all to the first in our series on Exoplanet-hunting methods. Today we begin with the most popular and widely-used, known as the Transit Method (aka. Transit Photometry).

For centuries, astronomers have speculated about the existence of planets beyond our Solar System. After all, with between 100 and 400 billion stars in the Milky Way Galaxy alone, it seemed unlikely that ours was the only one to have a system of planets. But it has only been within the past few decades that astronomers have confirmed the existence of extra-solar planets (aka. exoplanets).

Astronomers use various methods to confirm the existence of exoplanets, most of which are indirect in nature. Of these, the most widely-used and effective to date has been Transit Photometry, a method that measures the light curve of distant stars for periodic dips in brightness. These are the result of exoplanets passing in front of the star (i.e. transiting) relative to the observer.

Description:

These changes in brightness are characterized by very small dips and for fixed periods of time, usually in the vicinity of 1/10,000th of the star’s overall brightness and only for a matter of hours. These changes are also periodic, causing the same dips in brightness each time and for the same amount of time. Based on the extent to which stars dim, astronomers are also able to obtain vital information about exoplanets.

For all of these reasons, Transit Photometry is considered a very robust and reliable method of exoplanet detection. Of the 3,526 extra-solar planets that have been confirmed to date, the transit method has accounted for 2,771 discoveries – which is more than all the other methods combined.

Advantages:

One of the greatest advantages of Transit Photometry is the way it can provide accurate constraints on the size of detected planets. Obviously, this is based on the extent to which a star’s light curve changes as a result of a transit.  Whereas a small planet will cause a subtle change in brightness, a larger planet will cause a more noticeable change.

When combined with the Radial Velocity method (which can determine the planet’s mass) one can determine the density of the planet. From this, astronomers are able to assess a planet’s physical structure and composition – i.e. determining if it is a gas giant or rocky planet. The planets that have been studied using both of these methods are by far the best-characterized of all known exoplanets.

In addition to revealing the diameter of planets, Transit Photometry can allow for a planet’s atmosphere to be investigated through spectroscopy. As light from the star passes through the planet’s atmosphere, the resulting spectra can be analyzed to determine what elements are present, thus providing clues as to the chemical composition of the atmosphere.

Artist’s impression of an extra-solar planet transiting its star. Credit: QUB Astrophysics Research Center

Last, but not least, the transit method can also reveal things about a planet’s temperature and radiation based on secondary eclipses (when the planet passes behind it’s sun). On this occasion, astronomers measure the star’s photometric intensity and then subtract it from measurements of the star’s intensity before the secondary eclipse. This allows for measurements of the planet’s temperature and can even determine the presence of clouds formations in the planet’s atmosphere.

Disadvantages:

Transit Photometry also suffers from a few major drawbacks. For one, planetary transits are observable only when the planet’s orbit happens to be perfectly aligned with the astronomers’ line of sight. The probability of a planet’s orbit coinciding with an observer’s vantage point is equivalent to the ratio of the diameter of the star to the diameter of the orbit.

Only about 10% of planets with short orbital periods experience such an alignment, and this decreases for planets with longer orbital periods. As a result, this method cannot guarantee that a particular star being observed does indeed host any planets. For this reason, the transit method is most effective when surveying thousands or hundreds of thousands of stars at a time.

It also suffers from a substantial rate of false positives; in some cases, as high as 40% in single-planet systems (based on a 2012 study of the Kepler mission). This necessitates that follow-up observations be conducted, often relying on another method. However, the rate of false positives drops off for stars where multiple candidates have been detected.

Number of extrasolar planet discoveries per year through September 2014, with colors indicating method of detection – radial velocity (blue), transit (green), timing (yellow), direct imaging (red), microlensing (orange). Credit: Public domain

While transits can reveal much about a planet’s diameter, they cannot place accurate constraints on a planet’s mass. For this, the Radial Velocity method (as noted earlier) is the most reliable, where astronomers look for signs of “wobble” in a star’s orbit to the measure the gravitational forces acting on them (which are caused by planets).

In short, the transit method has some limitations and is most effective when paired with other methods. Nevertheless, it remains the most widely-used means of “primary detection” – detecting candidates which are later confirmed using a different method – and is responsible for more exoplanet discoveries than all other methods combined.

Examples of Transit Photometry Surveys:

Transit Photometry is performed by multiple Earth-based and space-based observatories around the world. The majority, however, are Earth-based, and rely on existing telescopes combined with state-of-the-art photometers. Examples include the Super Wide Angle Search for Planets (SuperWASP) survey, an international exoplanet-hunting survey that relies on the Roque de los Muchachos Observatory and the South African Astronomical Observatory.

There’s also the Hungarian Automated Telescope Network (HATNet), which consists of six small, fully-automated  telescopes and is maintained by the Harvard-Smithsonian Center for Astrophysics. The MEarth Project is another, a National Science Foundation-funded robotic observatory that combines the Fred Lawrence Whipple Observatory (FLWO) in Arizona with the Cerro Tololo Inter-American Observatory (CTIO) in Chile.

The SuperWasp Cameras at the South African Astronomical Observatory. Credit: SuperWASP project & David Anderson

Then there’s the Kilodegree Extremely Little Telescope (KELT), an astronomical survey jointly administered by Ohio State University, Vanderbilt University, Lehigh University, and the South African Astronomical Society (SAAO). This survey consists of two telescopes, the Winer Observatory in southeastern Arizona and the Sutherland Astronomical Observation Station in South Africa.

In terms of space-based observatories, the most notable example is NASA’s Kepler Space Telescope. During its initial mission, which ran from 2009 to 2013, Kepler detected 4,496 planetary candidates and confirmed the existence of 2,337 exoplanets. In November of 2013, after the failure of two of its reaction wheels, the telescope began its K2 mission, during which time an additional 515 planets have been detected and 178 have been confirmed.

The Hubble Space Telescope also conducted transit surveys during its many years in orbit. For instance, the Sagittarius Window Eclipsing Extrasolar Planet Search (SWEEPS) – which took place in 2006 – consisted of Hubble observing 180,000 stars in the central bulge of the Milky Way Galaxy. This survey revealed the existence of 16 additional exoplanets.

Other examples include the ESA’s COnvection ROtation et Transits planétaires (COROT) – in English “Convection rotation and planetary transits” – which operated from 2006 to 2012. Then there’s the ESA’s Gaia mission, which launched in 2013 with the purpose of creating the largest 3D catalog ever made, consisting of over 1 billion astronomical objects.

NASA’s Kepler space telescope was the first agency mission capable of detecting Earth-size planets. Credit: NASA/Wendy Stenzel

In March of 2018, the NASA Transiting Exoplanet Survey Satellite (TESS) is scheduled to be launched into orbit. Using the transit method, TESS will detect exoplanets and also select targets for further study by the James Webb Space Telescope (JSWT), which will be deployed in 2019. Between these two missions, the confirmation and characterization or many thousands of exoplanets is anticipated.

Thanks to improvements in terms of technology and methodology, exoplanet discovery has grown by leaps and bounds in recent years. With thousands of exoplanets confirmed, the focus has gradually shifted towards the characterizing of these planets to learn more about their atmospheres and conditions on their surface.

In the coming decades, thanks in part to the deployment of new missions, some very profound discoveries are expected to be made!

We have many interesting articles about exoplanet-hunting here at Universe Today. Here’s What are Extra Solar Planets?, What are Planetary Transits?, What is the Radial Velocity Method?, What is the Direct Imaging Method?, What is the Gravitational Microlensing Method?, and Kepler’s Universe: More Planets in our Galaxy than Stars.

Astronomy Cast also has some interesting episodes on the subject. Here’s Episode 364: The COROT Mission.

For more information, be sure to check out NASA’s page on Exoplanet Exploration, the Planetary Society’s page on Extrasolar Planets, and the NASA/Caltech Exoplanet Archive.

Sources:

A New Survey Takes the Hubble Deep Field to the Next Level, Analyzing Distance and Properties of 1,600 Galaxies

Images from the Hubble Ultra Deep Field (HUDF). Credit: NASA/ESA/S. Beckwith (STScI)/HUDF Team

Since its deployment in 1990, the Hubble Space Telescope has given us some of the richest and most detailed images of our Universe. Many of these images were taken while observing a patch of sky located in the Fornax constellation between September 2003 and January 2004. This region, known as the Hubble Ultra Deep Field (HUDF), contains an estimated 10,000 galaxies, all of which existed roughly 13 billion years ago.

Looking to this region of space, multiple teams of astronomers used the MUSE instrument on the ESO’s Very Large Telescope (VLT) to discover 72 previously unseen galaxies. In a series of ten recently released studies, these teams indicate how they measured the distance and properties of 1600 very faint galaxies in the Ultra Deep Field, revealing new information about star formation and the motions of galaxies in the early Universe.

The original HUDF images, which were published in 2004, were a major milestone for astronomy and cosmology. The thousands of galaxies it observed were dated to less than just a billion years after the Big Bang, ranging from 400 to 800 million years of age. This area was subsequently observed many times using the Hubble and other telescopes, which has resulted in the deepest views of the Universe to date.

One such telescope is the European Southern Observatory‘s (ESO) Very Large Telescope, located in the Paranal Observatory in Chile. Intrinsic to the studies of the HUDF was the Multi Unit Spectroscopic Explorer (MUSE), a panoramic integral-field spectrograph operating in the visible wavelength range. It was the data accumulated by this instrument that allowed for 72 new galaxies to be discovered from this tiny area of sky.

The MUSE HUDF Survey team, which was led by Roland Bacon of the Centre de recherche astrophysique de Lyon (CRAL) and the National Center for Scientific Research (CNRS), included members from multiple European observatories, research institutes and universities. Together, they produced ten studies detailing the precise spectroscopic measurements they conducted of 1600 HUDF galaxies.

This was an unprecedented accomplishment, given that this is ten times as many galaxies that have had similar measurements performed on them in the last decade using ground-based telescopes. As Bacon indicated in an ESO press release:

MUSE can do something that Hubble can’t — it splits up the light from every point in the image into its component colors to create a spectrum. This allows us to measure the distance, colors and other properties of all the galaxies we can see — including some that are invisible to Hubble itself.

The galaxies detected in this survey were also 100 times fainter than any galaxies studied in previous surveys. Given their age and their very dim and distant nature, the study of these 1600 galaxies is sure to add to any already very richly-observed field. This,in turn, can only deepen our understanding of how galaxies formed and evolved during the past 13 billions years.

The 72 newly-discovered galaxies that the survey observed are known as Lyman-alpha emitters, a class of galaxy that is extremely distant and only detectable in Lyman-alpha light. This form of radiation is emitted by excited hydrogen atoms, and is thought to be the result of ongoing star formation. Our current understanding of star formation cannot fully explain these galaxies, and they were not visible in the original Hubble images.

Thanks to MUSE’s ability to disperse light into its component colors, these galaxies became more apparent. As Jarle Brinchmann – an astronomer at the University of Leiden and the University of Porto’s (CAUP) Institute of Astrophysics and Space Sciences, and the lead author of one of the papers – described the results of the survey:

MUSE has the unique ability to extract information about some of the earliest galaxies in the Universe — even in a part of the sky that is already very well studied. We learn things about these galaxies that is only possible with spectroscopy, such as chemical content and internal motions — not galaxy by galaxy but all at once for all the galaxies!

Another major finding of this survey was the systematic detection of luminous hydrogen halos around galaxies in the early Universe. This finding is expected to give astronomers a new and promising way to study how material flowed in and out of early galaxies, which was central to early star formation and galactic evolution. The series of studies produced by Bacon and his colleagues also indicate a range of other possibilities.

These include studying the role faint galaxies played during cosmic reionization, the period that took place between 150 million to billion years after the Big Bang. It was during this period, which followed the “dark ages” (380 thousand to 150 million years ago) that the first stars and quasars formed and sent ionizing radiation throughout the early Universe. And as Roland Bacon explained, the best may yet be to come:

Remarkably, these data were all taken without the use of MUSE’s recent Adaptive Optics Facility upgrade. The activation of the AOF after a decade of intensive work by ESO’s astronomers and engineers promises yet more revolutionary data in the future.”

Even before Einstein proposed his groundbreaking Theory of General Relativity – which established that space and time are inextricably linked – scientists have understood that probing deeper into the cosmic field is to also probe farther back in time. The farther we are able to see, the more we are able to learn about how the Universe evolved over the course of billions of years.

Further Reading: ESO

There Could be Hundreds More Icy Worlds with Life Than on Rocky Planets Out There in the Galaxy

The moons of Europa and Enceladus, as imaged by the Galileo and Cassini spacecraft. Credit: NASA/ESA/JPL-Caltech/SETI Institute

In the hunt for extra-terrestrial life, scientists tend to take what is known as the “low-hanging fruit approach”. This consists of looking for conditions similar to what we experience here on Earth, which include at oxygen, organic molecules, and plenty of liquid water. Interestingly enough, some of the places where these ingredients are present in abundance include the interiors of icy moons like Europa, Ganymede, Enceladus and Titan.

Whereas there is only one terrestrial planet in our Solar System that is capable of supporting life (Earth), there are multiple “Ocean Worlds” like these moons. Taking this a step further, a team of researchers from the Harvard Smithsonian Center for Astrophysics (CfA) conducted a study that showed how potentially-habitable icy moons with interior oceans are far more likely than terrestrial planets in the Universe.

The study, titled “Subsurface Exolife“, was performed by Manasvi Lingam and Abraham Loeb of the Harvard Smithsonain Center for Astrophysics (CfA) and the Institute for Theory and Computation (ITC) at Harvard University. For the sake of their study, the authors consider all that what defines a circumstellar habitable zone (aka. “Goldilocks Zone“) and likelihood of there being life inside moons with interior oceans.

Cutaway showing the interior of Saturn’s moon Enceladus. Credit: ESA

To begin, Lingam and Loeb address the tendency to confuse habitable zones (HZs) with habitability, or to treat the two concepts as interchangeable. For instance, planets that are located within an HZ are not necessarily capable of supporting life – in this respect, Mars and Venus are perfect examples. Whereas Mars is too cold and it’s atmosphere too thin to support life, Venus suffered a runaway greenhouse effect that caused it to become a hot, hellish place.

On the other hand, bodies that are located beyond HZs have been found to be capable of having liquid water and the necessary ingredients to give rise to life. In this case, the moons of Europa, Ganymede, Enceladus, Dione, Titan, and several others serve as perfect examples. Thanks to the prevalence of water and geothermal heating caused by tidal forces, these moons all have interior oceans that could very well support life.

As Lingam, a post-doctoral researcher at the ITC and CfA and the lead author on the study, told Universe Today via email:

“The conventional notion of planetary habitability is the habitable zone (HZ), namely the concept that the “planet” must be situated at the right distance from the star such that it may be capable of having liquid water on its surface. However, this definition assumes that life is: (a) surface-based, (b) on a planet orbiting a star, and (c) based on liquid water (as the solvent) and carbon compounds. In contrast, our work relaxes assumptions (a) and (b), although we still retain (c).”

As such, Lingam and Loeb widen their consideration of habitability to include worlds that could have subsurface biospheres. Such environments go beyond icy moons such as Europa and Enceladus and could include many other types deep subterranean environments. On top of that, it has also been speculated that life could exist in Titan’s methane lakes (i.e. methanogenic organisms). However, Lingam and Loeb chose to focus on icy moons instead.

A “true color” image of the surface of Jupiter’s moon Europa as seen by the Galileo spacecraft. Image credit: NASA/JPL-Caltech/SETI Institute

“Even though we consider life in subsurface oceans under ice/rock envelopes, life could also exist in hydrated rocks (i.e. with water) beneath the surface; the latter is sometimes referred to as subterranean life,” said Lingam. “We did not delve into the second possibility since many of the conclusions (but not all of them) for subsurface oceans are also applicable to these worlds. Similarly, as noted above, we do not consider lifeforms based on exotic chemistries and solvents, since it is not easy to predict their properties.”

Ultimately, Lingam and Loeb chose to focus on worlds that would orbit stars and likely contain subsurface life humanity would be capable of recognizing. They then went about assessing the likelihood that such bodies are habitable, what advantages and challenges life will have to deal with in these environments, and the likelihood of such worlds existing beyond our Solar System (compared to potentially-habitable terrestrial planets).

For starters, “Ocean Worlds” have several advantages when it comes to supporting life. Within the Jovian system (Jupiter and its moons) radiation is a major problem, which is the result of charged particles becoming trapped in the gas giants powerful magnetic field. Between that and the moon’s tenuous atmospheres, life would have a very hard time surviving on the surface, but life dwelling beneath the ice would fare far better.

“One major advantage that icy worlds have is that the subsurface oceans are mostly sealed off from the surface,” said Lingam. “Hence, UV radiation and cosmic rays (energetic particles), which are typically detrimental to surface-based life in high doses, are unlikely to affect putative life in these subsurface oceans.”

Artist rendering showing an interior cross-section of the crust of Enceladus, which shows how hydrothermal activity may be causing the plumes of water at the moon’s surface. Credits: NASA-GSFC/SVS, NASA/JPL-Caltech/Southwest Research Institute

“On the negative side,’ he continued, “the absence of sunlight as a plentiful energy source could lead to a biosphere that has far less organisms (per unit volume) than Earth. In addition, most organisms in these biospheres are likely to be microbial, and the probability of complex life evolving may be low compared to Earth. Another issue is the potential availability of nutrients (e.g. phosphorus) necessary for life; we suggest that these nutrients might be available only in lower concentrations than Earth on these worlds.”

In the end, Lingam and Loeb determined that a wide range of worlds with ice shells of moderate thickness may exist in a wide range of habitats throughout the cosmos. Based on how statistically likely such worlds are, they concluded that “Ocean Worlds” like Europa, Enceladus, and others like them are about 1000 times more common than rocky planets that exist within the HZs of stars.

These findings have some drastic implications for the search for extra-terrestrial and extra-solar life. It also has significant implications for how life may be distributed through the Universe. As Lingam summarized:

“We conclude that life on these worlds will undoubtedly face noteworthy challenges. However, on the other hand, there is no definitive factor that prevents life (especially microbial life) from evolving on these planets and moons. In terms of panspermia, we considered the possibility that a free-floating planet containing subsurface exolife could be temporarily “captured” by a star, and that it may perhaps seed other planets (orbiting that star) with life. As there are many variables involved, not all of them can be quantified accurately.”

Exogenesis
A new instrument called the Search for Extra-Terrestrial Genomes (STEG)
is being developed to find evidence of life on other worlds. Credit: NASA/Jenny Mottor

Professor Leob – the Frank B. Baird Jr. Professor of Science at Harvard University, the director of the ITC, and the study’s co-author – added that finding examples of this life presents its own share of challenges. As he told Universe Today via email:

“It is very difficult to detect sub-surface life remotely (from a large distance) using telescopes. One could search for excess heat but that can result from natural sources, such as volcanos. The most reliable way to find sub-surface life is to land on such a planet or moon and drill through the surface ice sheet. This is the approach contemplated for a future NASA mission to Europa in the solar system.”

Exploring the implications for panspermia further, Lingam and Loeb also considered what might happen if a planet like Earth were ever ejected from the Solar System. As they note in their study, previous research has indicated how planets with thick atmospheres or subsurface oceans could still support life while floating in interstellar space. As Loeb explained, they also considered what would happen if this ever happened with Earth someday:

“An interesting question is what would happen to the Earth if it was ejected from the solar system into cold space without being warmed by the Sun. We have found that the oceans would freeze down to a depth of 4.4 kilometers but pockets of liquid water would survive in the deepest regions of the Earth’s ocean, such as the Mariana Trench, and life could survive in these remaining sub-surface lakes. This implies that sub-surface life could be transferred between planetary systems.”

The Drake Equation, a mathematical formula for the probability of finding life or advanced civilizations in the universe. Credit: University of Rochester

This study also serves as a reminder that as humanity explores more of the Solar System (largely for the sake of finding extra-terrestrial life) what we find also has implications in the hunt for life in the rest of the Universe. This is one of the benefits of the “low-hanging fruit” approach. What we don’t know is informed but what we do, and what we find helps inform our expectations of what else we might find.

And of course, it’s a very vast Universe out there. What we may find is likely to go far beyond what we are currently capable of recognizing!

Further Reading: arXiv

Juno Isn’t Exactly Where it’s Supposed To Be. The Flyby Anomaly is Back, But Why Does it Happen?

Jupiter’s south pole. captured by the JunoCam on Feb. 2, 2017, from an altitude of about 62,800 miles (101,000 kilometers) above the cloud tops. Credits: NASA/JPL-Caltech/SwRI/MSSS/John Landino

In the early 1960s, scientists developed the gravity-assist method, where a spacecraft would conduct a flyby of a major body in order to increase its speed. Many notable missions have used this technique, including the Pioneer, Voyager, Galileo, Cassini, and New Horizons missions. In the course of many of these flybys, scientists have noted an anomaly where the increase in the spacecraft’s speed did not accord with orbital models.

This has come to be known as the “flyby anomaly”, which has endured despite decades of study and resisted all previous attempts at explanation. To address this, a team of researchers from the University Institute of Multidisciplinary Mathematics at the Universitat Politecnica de Valencia have developed a new orbital model based on the maneuvers conducted by the Juno probe.

The study, which recently appeared online under the title “A Possible Flyby Anomaly for Juno at Jupiter“, was conducted by Luis Acedo, Pedro Piqueras and Jose A. Morano. Together, they examined the possible causes of the so-called “flyby anomaly” using the perijove orbit of the Juno probe. Based on Juno’s many pole-to-pole orbits, they not only determined that it too experienced an anomaly, but offered a possible explanation for this.

Artist’s impression of the Pioneer 10 probe, launched in 1972 and now making its way out towards the star Aldebaran. Credit: NASA

To break it down, the speed of a spacecraft is determined by measuring the Doppler shift of radio signals from the spacecraft to the antennas on the Deep Space Network (DSN). During the 1970s when the Pioneer 10 and 11 probes were launched, visiting Jupiter and Saturn before heading off towards the edge of the Solar System, these probes both experienced something strange as they passed between 20 to 70 AU (Uranus to the Kuiper Belt) from the Sun.

Basically, the probes were both 386,000 km (240,000 mi) farther from where existing models predicted they would be. This came to be known as the “Pioneer anomaly“, which became common lore within the space physics community. While the Pioneer anomaly was resolved, the same phenomena has occurred many times since then with subsequent missions. As Dr. Acebo told Universe Today via email:

“The “flyby anomaly” is a problem in astrodynamics discovered by a JPL’s team of researchers lead by John Anderson in the early 90s. When they tried to fit the whole trajectory of the Galileo spacecraft as it approached the Earth on December, 8th, 1990, they found that this only can be done by considering that the ingoing and outgoing pieces of the trajectory correspond to asymptotic velocities that differ in 3.92 mm/s from what is expected in theory.

“The effect appears both in the Doppler data and in the ranging data, so it is not a consequence of the measurement technique. Later on, it has also been found in several flybys performed by Galileo again in 1992, the NEAR [Near Earth Asteroid Rendezvous mission] in 1998, Cassini in 1999 or Rosetta and Messenger in 2005. The largest discrepancy was found for the NEAR (around 13 mm/s) and this is attributed to the very close distance of 532 Km to the surface of the Earth at the perigee.”

NASA’s Juno spacecraft launched on August 6, 2011 and should arrive at Jupiter on July 4, 2016. Credit: NASA / JPL

Another mystery is that while in some cases the anomaly was clear, in others it was on the threshold of detectability or simply absent – as was the case with Juno‘s flyby of Earth in October of 2013. The absence of any convincing explanation has led to a number of explanations, ranging from the influence or dark matter and tidal effects to extensions of General Relativity and the existence of new physics.

However, none of these have produced a substantive explanation that could account for flyby anomalies. To address this, Acedo and his colleagues sought to create a model that was optimized for the Juno mission while at perijove – i.e. the point in the probe’s orbit where it is closest to Jupiter’s center. As Acedo explained:

After the arrival of Juno at Jupiter on July, 4th, 2016, we had the idea of developing our independent orbital model to compare with the fitted trajectories that were being calculated by the JPL team at NASA. After all, Juno is performing very close flybys of Jupiter because the altitude over the top clouds (around 4000 km) is a small fraction of the planet’s radius. So, we expected to find the anomaly here.  This would be an interesting addition to our knowledge of this effect because it would prove that it is not only a particular problem with Earth flybys but that it is universal.”

Their model took into account the tidal forces exerted by the Sun and by Jupiter’s larger satellites – Io, Europa, Ganymede and Callisto – and also the contributions of the known zonal harmonics. They also accounted for Jupiter’s multipolar fields, which are the result of the planet oblate shape, since these play a far more important role than tidal forces as Juno reaches perijove.

Illustration of NASA’s Juno spacecraft firing its main engine to slow down and go into orbit around Jupiter. Lockheed Martin built the Juno spacecraft for NASA’s Jet Propulsion Laboratory. Credit: NASA/Lockheed Martin

In the end, they determined that an anomaly could also be present during the Juno flybys of Jupiter. They also noted a significant radial component in this anomaly, one which decayed the farther the probe got from the center of Jupiter. As Acebo explained:

“Our conclusion is that an anomalous acceleration is also acting upon the Juno spacecraft in the vicinity of the perijove (in this case, the asymptotic velocity is not a useful concept because the trajectory is closed). This acceleration is almost one hundred times larger than the typical anomalous accelerations responsible for the anomaly in the case of the Earth flybys. This was already expected in connection with Anderson et al.’s initial intuition that the effect increases with the angular rotational velocity of the planet (a period of 9.8 hours for Jupiter vs the 24 hours of the Earth), the radius of the planet and probably its mass.”

They also determined that this anomaly appears to be dependent on the ratio between the spacecraft’s radial velocity and the speed of light, and that this decreases very fast as the craft’s altitude over Jupiter’s clouds changes. These issues were not predicted by General Relativity, so there is a chance that flyby anomalies are the result of novel gravitational phenomena – or perhaps, a more conventional effect that has been overlooked.

In the end, the model that resulted from their calculations accorded closely with telemetry data provided by the Juno mission, though questions remain. Further research is necessary because the pattern of the anomaly seems very complex and a single orbit (or a sequence of similar orbits as in the case of Juno) cannot map the whole field,” said Acebo. “A dedicated mission is required but financial cuts and limited interest in experimental gravity may prevent us to see this mission in the near future.”

It is a testament to the complexities of physics that even after sixty years of space exploration – and one hundred years since General Relativity was first proposed – that we are still refining our models. Perhaps someday we will find there are no mysteries left to solve, and the Universe will make perfect sense to us. What a terrible day that will be!

Further Reading: Earth and Planetary Astrophysics

Oops, low energy LEDs are increasing light pollution

The city of Denver, Colorado, as seen from space. Credit: NASA

When it comes to technology and the environment, it often seems like it’s “one step forward, two steps back.” Basically, sometimes the new and innovative technologies that are intended correct for one set of problems inevitably lead to new ones. This appears to be the case with the transition to solid-state lighting technology, aka. the “lighting revolution”.

Basically, as nations transition from traditional lights to the energy-saving Light-Emitting Diodes (LEDs), there is the potential for a rebound effect. According to an international study led by Christopher Kyba from the GFZ German Research Center for Geoscience, the widespread use of LED lights could mean more usage and more light pollution, thus counter-acting their economic and environmental benefits.

The study, titled “Artificially Lit Surface of Earth at Night Increasing in Radiance and Extent“, recently appeared in the journal Science Advances. Led by Christopher C. M. Kyba, the team also included members from the Leibniz Institute of Freshwater Ecology and Inland Fisheries, the Instituto de Astrofísica de Andalucía (CSIS), the Complutense University of Madrid, the University of Colorado, the University of Exeter, and the National Oceanic and Atmospheric Administration (NOAA).

Photograph of Calgary, Alberta, Canada, taken from the International Space Station on Nov. 27th, 2015. Credit: NASA’s Earth Observatory/Kyba, GFZ

To put it simply, the cost-saving effects of LED lights make them attractive from a consumer standpoint. From an environmental standpoint, they are also attractive because they reduce our carbon footprint. Unfortunately, as more people are using them for residential, commercial and industrial purposes, overall energy consumption appears to be going up instead of down, leading to an increased environmental impact.

For the sake of their study, the team relied on satellite radiometer data calibrated for nightlights collected by the Visible/Infrared Imager Radiometer Suite (VIIRS), an instrument on the NOAA’s Suomi-NPP satellite that has been monitoring Earth since October of 2011. After examining data obtained between 2012 and 2016, the team noted a discernible increase in power consumption associated with LED use. As they explain in their study:

“[F]rom 2012 to 2016, Earth’s artificially lit outdoor area grew by 2.2% per year, with a total radiance growth of 1.8% per year. Continuously lit areas brightened at a rate of 2.2% per year. Large differences in national growth rates were observed, with lighting remaining stable or decreasing in only a few countries.”

This data is not consistent with energy reductions on a global scale, but rather an increase in light pollution. The increase corresponded to increases in the Gross Domestic Product (GDP) of the fastest-growing developing nations. Moreover, it was also found to be happening in developed nations. In all cases, increased power consumption and light pollution has natural consequences for plants, animals, and human well-being.

As Kevin Gaston – a professor from the Environment and Sustainability Institute at the University of Exeter and a co-author on the study – explained in a University of Exeter press release:

“The great hope was that LED lighting would lead to lower energy usage, but what we’re seeing is those savings being used for increased lighting. We’re not just seeing this in developing countries, but also in developed countries. For example, Britain is getting brighter. You now struggle to find anywhere in Europe with a natural night sky – without that sky glow we’re all familiar with.”

The team also compared the VIIRS data to photographs taken from the International Space Station (ISS) which showed that the Suomi-NPP satellite sometimes record a dimming of some cities. This is due to the fact that the sensor can’t pick up light at wavelengths below 500 nanometers (nm) – i.e. blue light. When cities replace orange lamps with white LEDs, they emit more radiation below 500 nm.

The effect of this is that cities that are at the same brightness or have experienced an increase in brightness may actually appear dimmer. In other words, even in cases where satellites are detecting less radiation coming from the surface, Earth’s night-time brightness is actually increasing. But before anyone gets to thinking that it’s all bad news, there is a ray of light (no pun!) to be found in this research.

In previous studies, Kyba has shown that light emissions per capita in the US are 3 to 5 times higher than that in Germany. As he indicated, this could be seen as a sign that prosperity and conservative light use can coexist:

“Other studies and the experience of cities like Tucson, Arizona, show that well designed LED lamps allow a two-third or more decrease of light emission without any noticeable effect for human perception. There is a potential for the solid state lighting revolution to save energy and reduce light pollution, but only if we don’t spend the savings on new light”.

Reducing humanity’s impact on Earth’s natural environment is challenging work; and in the end, many of the technologies we depend upon to reduce our footprint can have the opposite effect. However, if there’s one thing that can prevent this from continually happening, it’s research that helps us to identifies our bad habits (and fix them!)

Further Reading: Eureka Alert!, University of Exeter, Science Advances