How Long Can a Rocky World Withstand the Blasts From a Red Dwarf Star?

Artist’s impression of Proxima b, which was discovered using the Radial Velocity method. Credit: ESO/M. Kornmesser

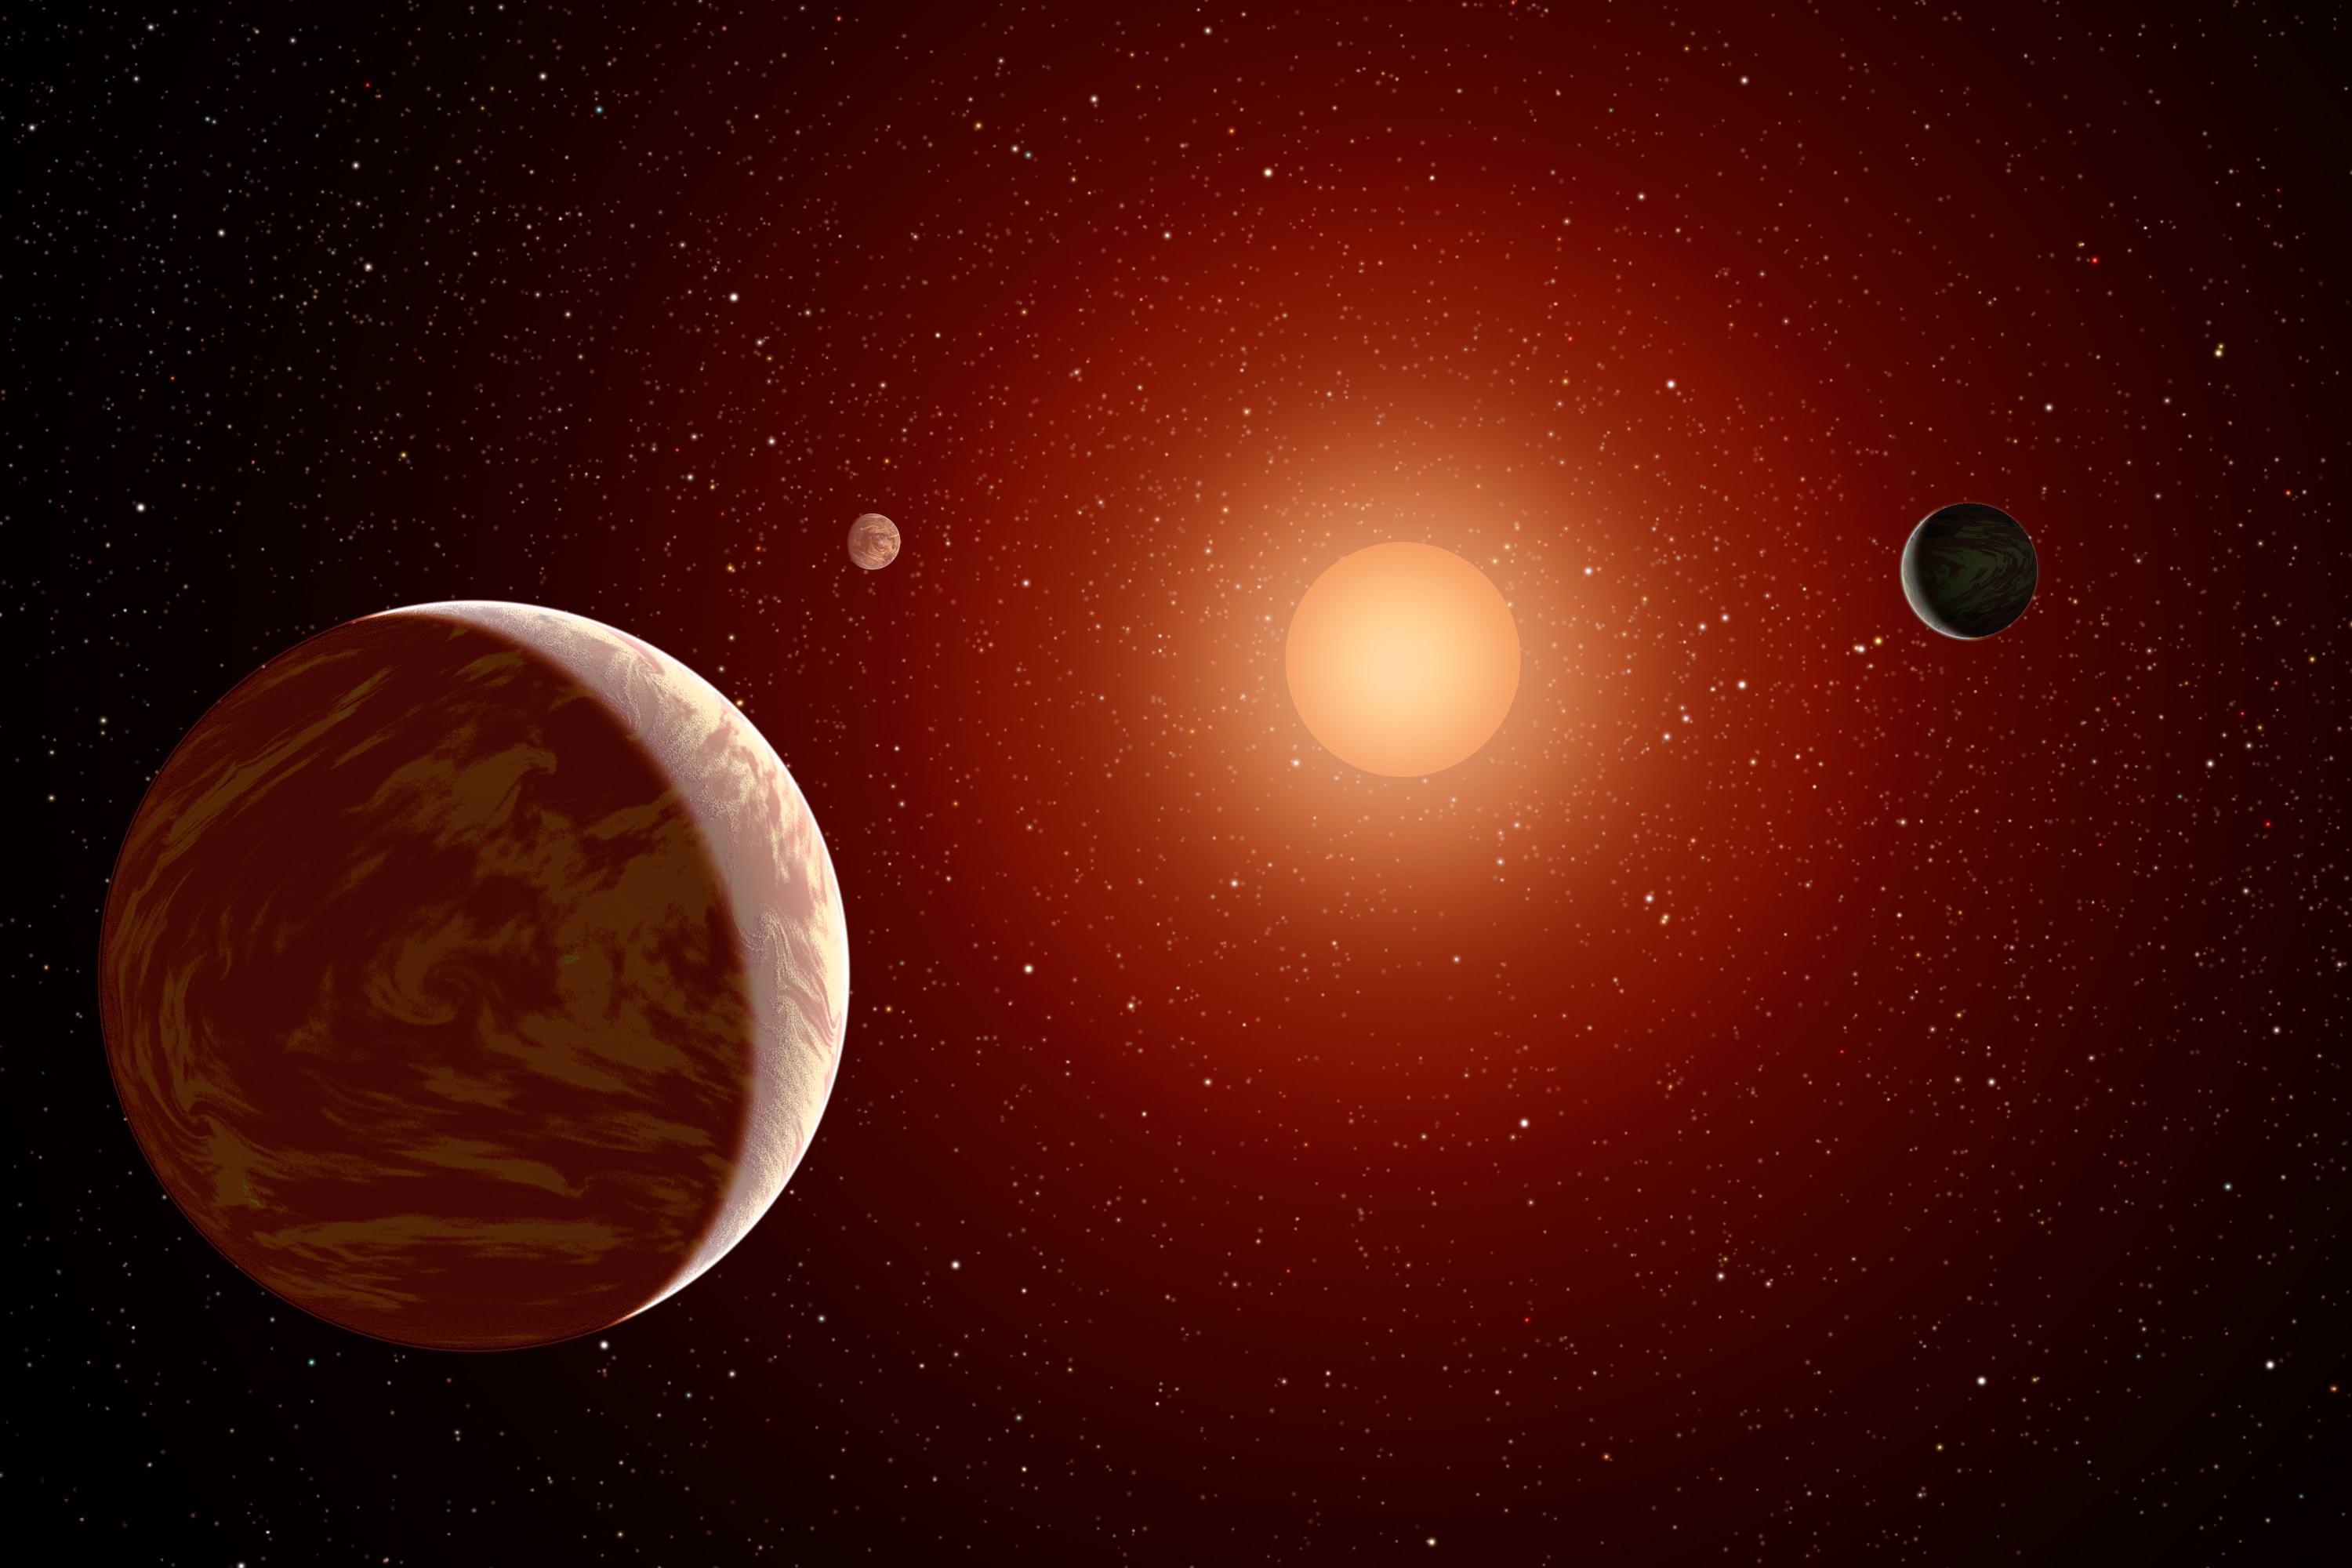
Red dwarf stars have become a major focal point for exoplanet studies lately, and for good reason. For starters, M-type (red dwarf) stars are the most common type in our Universe, accounting for 75% of stars in the Milky Way alone. In addition, in the past decade, numerous terrestrial (i.e rocky) exoplanets have been discovered orbiting red dwarf stars, and within their circumstellar habitable zones (“Goldilocks Zones”) to boot.

This has naturally prompted several studies to determine whether or not rocky planets can retain their atmospheres. The latest study comes from NASA, using data obtained by the Mars Atmosphere and Volatile Evolution (MAVEN) orbiter. Having studied Mars’ atmosphere for years to determine how and when it was stripped away, the MAVEN mission is well-suited when it comes to measuring the potential habitability of other planets.

The study was shared on Dec. 13th, 2017, at the Fall Meeting of the American Geophysical Union in New Orleans, Louisiana. In a presentation titled “Spanning Disciplines to Search for Life Beyond Earth“, a team of NASA scientists and researchers from the University of California-Riverside and the University of Colorado-Boulder explained how insights from the MAVEN mission could be applied to the habitability of rocky planets orbiting other stars.

Artist’s rendering of a solar storm hitting Mars and stripping ions from the planet’s upper atmosphere. Credits: NASA/GSFC

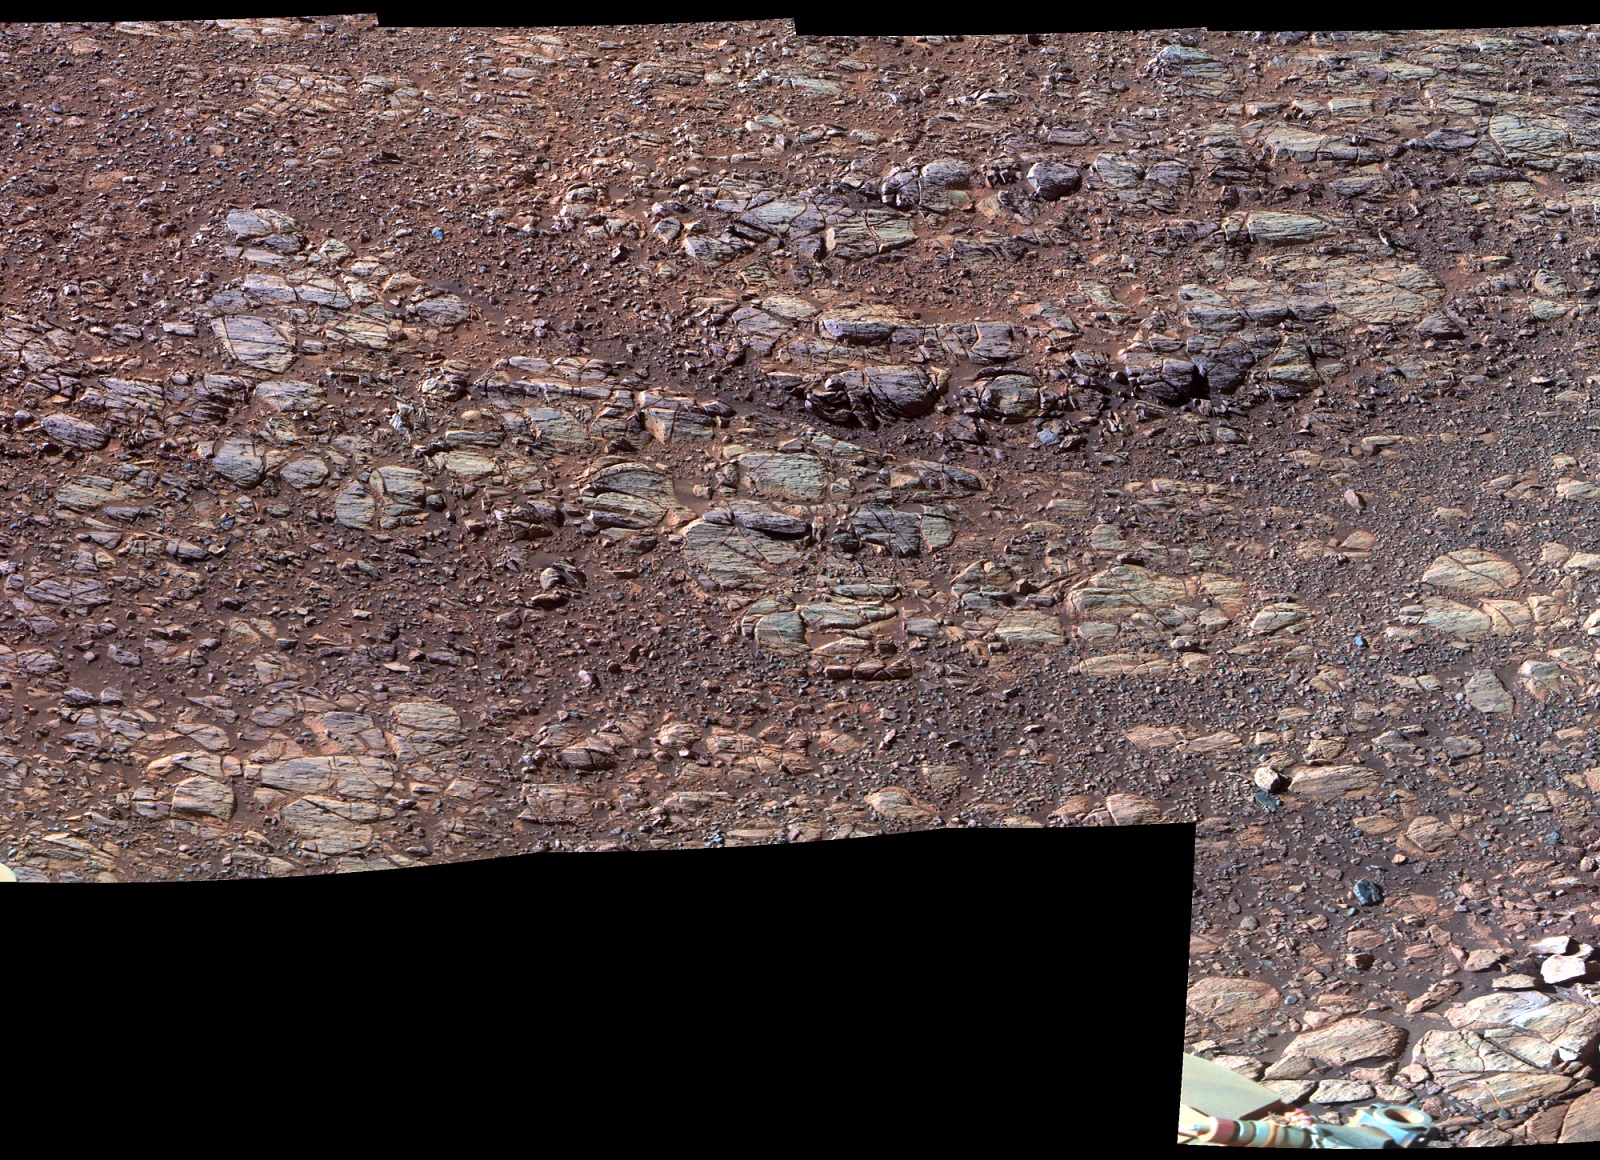
Launched in November 18th, 2013, the MAVEN mission established orbit around Mars on September 22nd, 2014. The purpose of this mission has been to explore the Red Planet’s upper atmosphere, ionosphere and its interactions with the Sun and solar wind for the sake of determining how and when Mars’ atmosphere went from being thicker and warmer in the past (and thus able to support liquid water on the surface) to thin and tenuous today.

Since November of 2014, MAVEN has been measuring Mars’ atmospheric loss using its suite of scientific instruments. From the data it has obtained, scientists have surmised that the majority of the planet’s atmosphere was lost to space over time due to a combination of chemical and physical processes. And in the past three years, the Sun’s activity has increased and decreased, giving MAVEN the opportunity to observe how Mars’ atmospheric loss has risen and fallen accordingly.

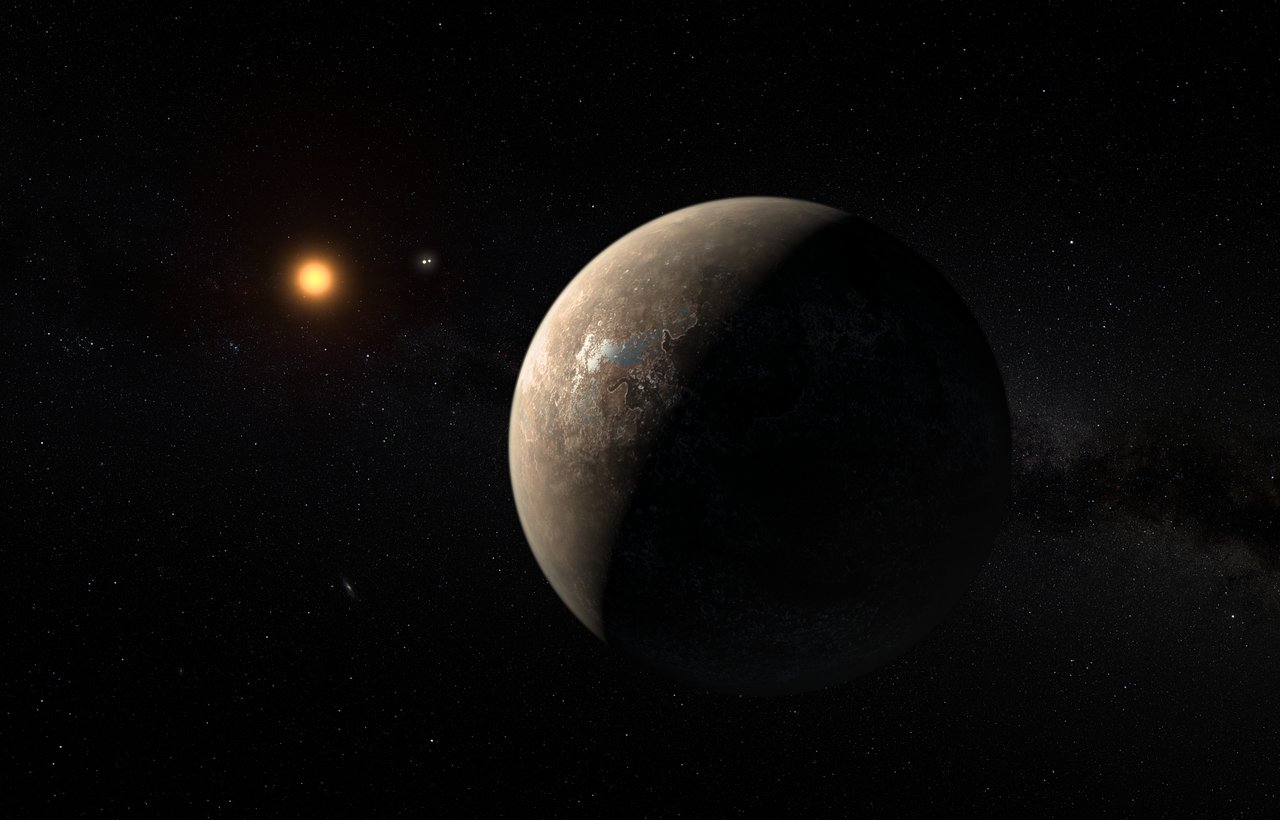
Because of this, David Brain – a professor at the Laboratory for Atmospheric and Space Physics (LASP) at the CU Boulder is also a MAVEN co-investigator – and his colleagues began to think about how these insights could be applied to a hypothetical Mars-like planet orbiting around an red dwarf star. These planets include Proxima b (the closest exoplanet to our Solar System) and the seven planet system of TRAPPIST-1.

As Brain he explained in a recent NASA press release:

“The MAVEN mission tells us that Mars lost substantial amounts of its atmosphere over time, changing the planet’s habitability. We can use Mars, a planet that we know a lot about, as a laboratory for studying rocky planets outside our solar system, which we don’t know much about yet.”

At one time, Mars had a magnetic field similar to Earth, which prevented its atmosphere from being stripped away. Credit: NASA

To determine if this hypothetical planet could retain its atmosphere over time, the researchers performed some preliminary calculations that assumed that this planet would be positioned near the outer edge of the star’s habitable zone (as Mars is). Since red dwarf’s are dimmer than our Sun, the planet would have to orbit much closer to the star – even closer than Mercury does to our Sun – to be within this zone.

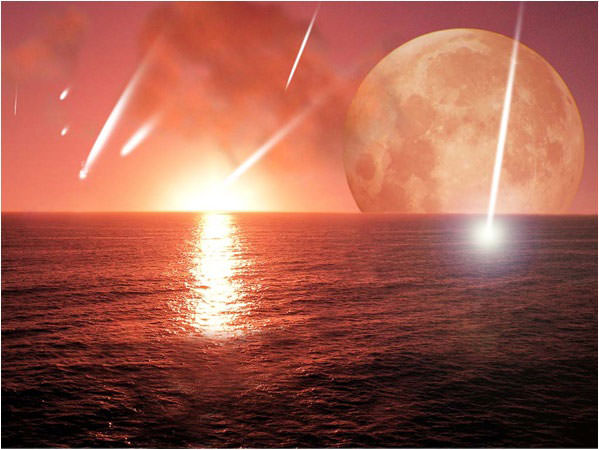
They also considered how a higher proportion of the light emanating from red dwarf stars is in the ultraviolet wavelength. Combined with a close orbit, this means that the hypothetical planet would be bombarded with about 5 times more UV radiation the real Mars gets. This would also mean that the processes responsible for atmospheric loss would be increased for this planet.

Based on data obtained by MAVEN, Brain and colleagues were able to estimate how this increase in radiation would affect Mars’ own atmospheric loss. Based on their calculations, they found that the planet’s atmosphere would lose 3 to 5 times as many charged particles through ion escape, while about 5 to 10 times more neutral particles would be lost through photochemical escape (where UV radiaion breaks apart molecules in the upper atmosphere).

Another form of atmospheric loss would also result, due to the fact that more UV radiation means that more charged particles would be created. This would result in a process called “sputtering”, where energetic particles are accelerated into the atmosphere and collide with other molecules, kicking some out into space and sending others crashing into neighboring particles.

To receive the same amount of starlight as Mars receives from our Sun, a planet orbiting an M-type red dwarf would have to be positioned much closer to its star than Mercury is to the Sun. Credit: NASA’s Goddard Space Flight Center

Lastly, they considered how the hypothetical planet might experience about the same amount of thermal escape (aka. Jeans escape) as the real Mars. This process occurs only for lighter molecules such as hydrogen, which Mars loses at the top of its atmosphere through thermal escape. On the “exo-Mars”, however, thermal escape would increase only if the increase in UV radiation were to push more hydrogen into the upper atmosphere.

In conclusion, the researchers determined that orbiting at the edge of the habitable zone of a quiet M-type star (instead of our Sun) could shorten the habitable period for a Mars-like planet by a factor of about 5 to 20. For a more active M-type star, the habitable period could be cut by as much as 1,000 times. In addition, solar storm activity around a red dwarf, which is thousands of times more intense than with our Sun, would also be very limiting.

However, the study is based on how an exo-Mars would fair around and M-type star, which kind of stacks the odds against habitability in advance. When different planets are considered, which possess mitigating factors Mars does not, things become a bit more promising. For instance, a planet that is more geologically active than Mars would be able to replenish its atmosphere at a greater rate.

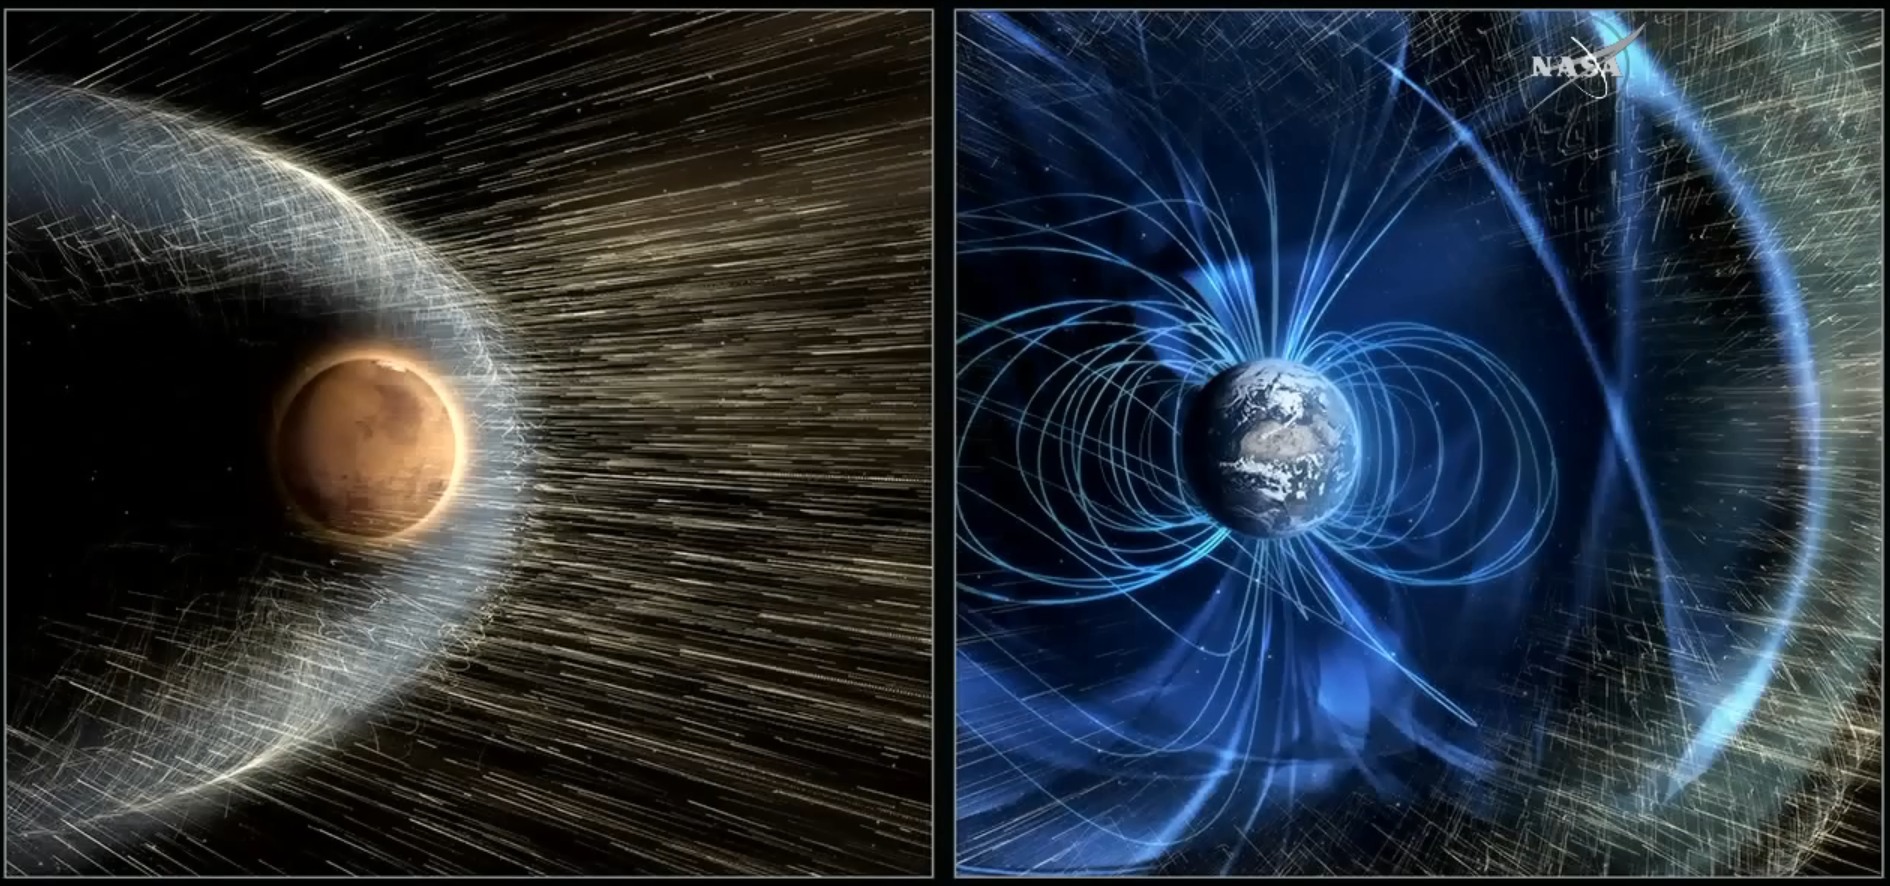
Other factors include increase mass, which would allow for the planet to hold onto more of its atmosphere, and the presence of a magnetic field to shield it from stellar wind. As Bruce Jakosky, MAVEN’s principal investigator at the University of Colorado (who was not associated with this study), remarked:

“Habitability is one of the biggest topics in astronomy, and these estimates demonstrate one way to leverage what we know about Mars and the Sun to help determine the factors that control whether planets in other systems might be suitable for life.”

Multiple survey have revealed evidence of rocky planets orbiting a red dwarf stars, raising questions about their habitability. Credit: ESO/M. Kornmesser/N. Risinger (skysurvey.org).

In the coming years, astronomers and exoplanet researchers hope to learn more about the planets orbiting nearby red dwarf stars. These efforts are expected to be helped immensely thanks to the deployment of the James Webb Space Telescope, which will be able to conduct more detailed surveys of these star systems using its advanced infrared imaging capabilities.

These studies will allow scientists to place more accurate constraints on exoplanets that orbit red dwarf stars, which will allow for better estimates about their size, mass, and compositions – all of which are crucial to determining potential habitability.

Other panelists that took part in the presentations included Giada Arney and Katherine Garcia-Sage of NASA Goddard Space Flight Center and Stephen Kane of the University of California-Riverside. You can access the press conference materials by going to NASA Goddard Media Studios.

Further Reading: NASA, AGU

Gaia Looks Beyond our Galaxy to Other Islands of Stars

Color view of M31 (The Andromeda Galaxy), with M32 (a satellite galaxy) shown to the lower left. Credit and copyright: Terry Hancock.

The European Space Agency’s (ESA) Gaia mission is an ambitious project. Having launched in December of 2013, the purpose of this space observatory has been to measure the position and distances of 1 billion objects – including stars, extra-solar planets, comets, asteroids and even quasars. From this, astronomers hope to create the most detailed 3D space catalog of the cosmos ever made.

Back in 2016, the first batch of Gaia data (based on its first 14 months in space) was released. Since then, scientists have been poring over the raw data to obtain clearer images of the neighboring stars and galaxies that were studied by the mission. The latest images to be released, based on Gaia data, included revealing pictures of the Large Magellanic Cloud (LMC), the Andromeda galaxy, and the Triangulum galaxy.

The first catalog of Gaia data consisted of information on 1.142 billion stars, including their precise position in the night sky and their respective brightness. Most of these stars are located in the Milky Way, but a good fraction were from galaxies beyond ours, which included about ten million belonging to the LMC. This satellite galaxy, located about 166 000 light-years away, has about 1/100th the mass of the Milky Way.

Gaia’s view of the Large Magellanic Cloud. Click here for further details, full credits, and larger versions of the image. Credit: ESA/Gaia/DPAC

The two images shown above display composite data obtained by the Gaia probe. The image on the left, which was compiled by mapping the total density of stars detected by Gaia, shows the large-scale distribution of stars in the LMC. This image also delineates the extent of the LMC’s spiral arms, and is peppered with bright dots that represent faint clusters of stars.

The image on the right, on the other hand, reveals other aspects of the LMC and its stars. This image was created by mapping radiation flux in the LMC and is dominated by the brightest and most massive stars. This allows the bar of the LMC to be more clearly defined and also shows individual regions of star-formation – like 30 Doradus, which is visible just above the center of the galaxy in the picture.

The next set of images (shown below), which were also obtained using data from the first 14 months of the Gaia mission, depict two nearby spiral galaxies – the Andromeda galaxy (M31) and its neighbor, the Triangulum galaxy (M33). The Andromeda galaxy, located 2.5 million light-years away, is the largest galaxy in our vicinity and slightly more massive than our own. It is also destined to merge with the Milky Way in roughly 4 billion years.

The Triangulum galaxy, meanwhile, is a fraction the size of the Milky Way (with an estimated fifty billion stars) and is located slightly farther from us than Andromeda – about 2.8 million light-years distant. As with the LMC images, the images on the left are based on the total density of stars and show stars of all types, while images on the right are based on the radiation flux of each galaxy and mainly show the bright end of the stellar population.

Gaia’s view of the Andromeda galaxy. Credit: ESA/Gaia/DPAC

Another benefit of the images on the right is that they indicate the regions where the most intense star formation is taking place. For many years, astronomers have known that the LMC boasts a significant amount of star-forming activity, forming stars at five times the rate of the Milky Way Galaxy. Andromeda, meanwhile, has reached a point of near-inactivity in the past 2 billion years when it comes to star formation.

In comparison, the Triangulum Galaxy still shows signs of star formation, at a rate that is about four and a half times that of Andromeda. Thanks to the Gaia images, which indicate the relative rates of star formation from elevated levels of radiation flux and brightness, these differences between Andromeda, Triangulum and the LMC is illustrated quite beautifully.

What’s more, by analyzing the motions of individual stars in external galaxies like the LMC, Andromeda, or Triangulum, it will be possible to learn more about the overall rotation of stars within these galaxies. It will also be possible to determine the orbits of the galaxies themselves, which are all part of the larger structure known as the Local Group.

This region of space, which the Milky Way is part of, measures roughly 10 million light-years across and has an estimated 1.29 billion Solar masses. This, in turn, is just one of several collections of galaxies in the even larger Virgo Supercluster. Measuring how stars and galaxies orbit about these larger structures is key to determining cosmic evolution, how the Universe came to be as it is today and where it is heading.

The Triangulum galaxy (M33), based on data compiled by the Gaia mission. Credit: ESA/Gaia/DPAC

An international team of astronomers recently attempted to do just that using the CosmicFlows surveys. These studies, which were conducted between 2011 and 2016, calculated the distance and speed of neighboring galaxies. By pairing this data with other distance estimates and data on the galaxies gravity fields, they were able to chart the motions of almost 1,400 galaxies within 100 million light years over the course of the past 13 billion years.

In the case of the LMC, another team of astronomers recently attempted to measure its orbit using a subset of data from the first Gaia release – the Tycho–Gaia Astrometric Solution (TGAS). Combined with additional parallax and proper motion data from the Hipparcos mission, the team was able to identify 29 stars in the LMC and measure their proper motion, which they then used to estimate the rotation of the galaxy.

Gaia’s observations of the LMC and the Small Magellanic Cloud (SMC) are also important when it comes to studying Cepheid and RR Lyrae variables. For years, astronomers have indicated that these stars could be used as indicators of cosmic distances for galaxies beyond our own. In addition, astronomers working at the Gaia Data Processing and Analysis Consortium (DPAC) tested this method on hundreds of LMC variable stars in order to validate data from the first release.

Astronomers are eagerly awaiting the second release of Gaia data, which is scheduled for April of 2018. This will also contain measurements on stellar distances and their motions across the sky, and is expected to reveal even more about our galaxy and its neighbors. But in the meantime, there are still plenty of revelations to be found from the first release, and scientists expect to be busy with it for many years to come.

Further Reading: ESA

Are Little Blue Dots in the Hubble Frontier Fields Precursors to Globular Clusters?

The massive galaxy cluster Abell 370 as seen by Hubble Space Telescope in the final Frontier Fields observations. The lensing effect reveals details about a supernova in the distant universe. Credit: NASA/ESA/HFF

In 2012, the Hubble Space Telescope Frontier Fields program (aka. Hubble Deep Fields Initiative 2012) officially kicked off. The purpose of this project was to study the faintest and most distant galaxies in the Universe using the gravitational lensing technique, thus advancing our knowledge of early galaxy formation. By 2017, the Frontier Field program wrapped up, and the hard work of analyzing all the data it collected began.

One of the more interesting finds within the Frontier Fields data has been the discovery of low mass galaxies with high star formation rates. After examining the “parallel fields” for Abell 2744 and MACS J0416.1-2403 – two galaxy clusters studied by the program – a pair of astronomers noted the presence of what they refer to as “Little Blue Dots” (LBDs), a finding which has implications for galaxy formation and globular clusters.

The study which details their findings recently appeared online under the title “Little Blue Dots in the Hubble Space Telescope Frontier Fields: Precursors to Globular Clusters?“. The study team consisted of Dr. Debra Meloy Elmegreen – a professor of astronomy at Vassar College – and Dr. Bruce G. Elmegreen, an astronomer with the IBM Research Division at the T.J. Watson Research Center in Yorktown Heights.

The galaxy clusters Abell 2744, MACS J0416.1-2403, MACS J0717.5+3745, MACS J1149.5+2223, Abell S1063, Abell 370. Credit: NASA, ESA, STScI, and the HFF team

To put it simply, the Frontier Fields program used the Hubble Space Telescope to observe six massive galaxy clusters at optical and near-infrared wavelengths – with its Advanced Camera for Surveys (ACS) and Wide Field Camera 3 (WFC3), respectively. These massive galaxies were used to magnify and stretch images of remote galaxies located behind them which were otherwise too faint for Hubble to see directly (aka. gravitational lensing).

While one of these Hubble cameras would look at a galaxy cluster, the other would simultaneously view an adjacent patch of sky. These adjacent patches are known as “parallel fields”, otherwise faint regions that provide some of the deepest looks into the early Universe. As Dr. Bruce Elmegreen told Universe Today via email:

“The purpose of the HFF program is to take deep images of 6 regions of the sky where there are clusters of galaxies, because these clusters magnify background galaxies through the gravitational lens effect. In this way, we can see further than just with direct imaging of the sky alone. Many galaxies have been studied using this magnification technique. The clusters of galaxies are important because they are big mass concentrations which make strong gravitational lenses.”

This six galaxy clusters used for the sake of the project included Abell 2744, MACS J0416.1-2403 and their parallel fields, the latter of which were the focal point in this study. These and the other clusters were used to find galaxies that existed just 600 to 900 million years after the Big Bang. These galaxies and their respective parallels had already been cataloged using computer algorithms that automatically found galaxies in the images and determined their properties.

Images of the MACS J0416.1–2403 and Abell 2744 galaxy clusters, taken as part of the Hubble Frontier Fields program. Credit: NASA/ESA/HST Frontier Fields team (STScI)

As the research duo go on to explain in their study, recent large-scale deep surveys have enabled studies of smaller galaxies at higher redshifts. These include “green peas” – luminous, compact and low mass galaxies with high specific star formation rates – and even lower-mass “blueberries”, small starburst galaxies that are a faint extension of the green peas that also show intense rates of star formation.

Using the aforementioned catalogues, and examining the parallel fields for Abell 2744 and MACS J0416.1-2403, the team went looking for other examples of low-mass galaxies with high star formation rates. The purpose of this was to measure the properties of these dwarf galaxies, and to see if any of their positions accorded with where globular clusters are known to have formed.

What they found was what they referred to as “Little Blue Dots” (LBSs), which are even lower-mass versions of “blueberries”. As Dr. Debra Elmegreen told Universe Today via email:

“When I was examining the images (there are about 3400 galaxies detected in each field), I noticed occasional galaxies that appeared as little blue dots, which was very intriguing because of Bruce’s previous theoretical work on dwarf galaxies. The published catalogs included redshifts and star formation rates and masses for each galaxy, and it turns out the little blue dots are low mass galaxies with very high star formation rates for their mass.”

Close-up view of a HFF parallel field, showing a LBD (upper right). Credit: Debra & Bruce Elmegreen

These galaxies didn’t show structure, so Debra and Bruce stacked the images of galaxies into 3 different ranges of redshift (which worked out to about 20 galaxies each) to create deeper images. “Still they showed no structure or faint extended outer disk,” said Debra, “so they are at the limit of resolution, with average sizes of 100-200 parsecs (about 300-600 light years) and masses of a few million times the mass of our sun.”

In the end, they determined that within these LBDs, star formation rates were very high. They also noted that these dwarf galaxies were very young, being less than 1% the age of the Universe at the time that they were observed. “So the tiny galaxies just formed,: said Bruce, “and their star formation rates are high enough to account for the globular clusters, maybe one in each LBD, when the star bursts in them wind down after a few tens of million years.”

Debra and Bruce Elmegreen are no strangers to high redshift galaxies. Back in 2012, Bruce published a paper that suggested that the globular clusters that orbit the Milky Way (and most other galaxies) formed in dwarf galaxies during the early Universe. These dwarf galaxies would have since been acquired by larger galaxies like our own, and the clusters are essentially their remnants.

Globular clusters are essentially massive star clusters that orbit around the Milky Way Halo. They are typically around 1 million Solar masses and are made up of stars that are very old – somewhere on the order of 10 to 13 billion years. Beyond the Milky Way, many appear in common orbits and in the Andromeda Galaxy, some even appear connected by a stream of stars.

The three groups of LBDs, where the dwarf galaxies were stacked based on their redshift. Credit: Debra & Bruce Elmegreen

As Bruce explained, his is a compelling argument for the theory that globular clusters formed from dwarf galaxies in the early Universe:

“This suggests that the metal-poor globular clusters are the dense remnants of little galaxies that got captured by bigger galaxies, like the Milky Way, and ripped apart by tidal forces. This idea for the origin of halo globular clusters goes back several decades… It would be only the metal-poor one that are like this, which are about half the total, because dwarf galaxies are metal poor compared to big galaxies, and they were also more metal poor in the early universe.”

This study has many implications for our understanding of how the Universe evolved, which was the chief aim of the Hubble Frontier Fields program. By examining objects in the early Universe, and determining their properties, scientists are able to determine how the structures that we are familiar with today – i.e. stars, galaxies, clusters, etc. – truly came from.

These same studies also allow scientists to make educated guesses about where the Universe is going and what will become of those same structures millions or even billions of years from now. In short, knowing where we’ve been lets us predict where we are headed!

Further Reading: arXiv

NASA’s Opportunity Rover Withstands Another Harsh Winter on Mars

Artist's impression of the Opportunity Rover, part of NASA's Mars Exploration Program. NASA/JPL-Caltech

When the Opportunity rover landed on Mars on January 25th, 2004, its mission was only meant to last for about 90 Earth days. But the little rover that could has exceeded all expectations by remaining in operation (as of the writing of this article) for a total of 13 years and 231 days and traveled a total of about 50 km (28 mi). Basically, Opportunity has continued to remain mobile and gather scientific data 50 times longer than its designated lifespan.

And according to a recent announcement from NASA’s Mars Exploration Program (MEP), the rover managed to survive yet another winter on Mars. Having endured the its eight Martian winter in a row, and with its solar panels in encouragingly clean condition, the rover will be in good shape for the coming dust-storm season. It also means the rover will live to see its 14th anniversary, which will take place on January 25th, 2018.

On Mars, a single year lasts the equivalent of 686.971 Earth days (or 1.88 Earth years). And since Mars’ axis is inclined 25.19° to its orbital plane (compared to Earth’s axial tilt of just over 23°), Mars also experiences seasons. However, these tend to last about twice as long as the seasons on Earth. And of course, the seasons on Mars’ are also much colder, with temperatures averaging about -63 °C (-82°F).

Enhanced-color view of ground sloping downward to the right in “Perseverance Valley”, taken by the Pancam on the Opportunity rover in October of 2017. Credits: NASA/JPL-Caltech/Cornell Univ./Arizona State Univ

As Jennifer Herman, the power subsystem operations team lead for Opportunity at NASA’s Jet Propulsion Laboratory, recalled in a NASA MEP press statement:

“I didn’t start working on this project until about Sol 300, and I was told not to get too settled in because Spirit and Opportunity probably wouldn’t make it through that first Martian winter. Now, Opportunity has made it through the worst part of its eighth Martian winter.”

At present, both the Opportunity and Spirit rover are in Mars’ southern hemisphere. Here, the Sun appears in the northern sky during the fall and winter, so the rovers need to tilt their solar-arrays northward. Back in 2004, the Spirit rover had lost the use of two of its wheels, and could therefore not maneuver out of a sand trap it had become stuck in. As such, it was unable to tilt itself northward and did not survive its fourth Martian winter (in 2009).

However, Opportunity’s current position – Perseverance Valley, a fluid-carved region on the inner slope at the edge of the Endeavour Crater – meant that it was well-positioned to keep working through late fall and early winter this year. This was ensured by the stops the rover made at energy-favorable locations, where it would inspect local rocks, examine the valley’s shape and image the surrounding area, all the while absorbing ample energy from the Sun.

Image of the floor of Endeavour Crater, taken by NASA’s Mars Exploration Rover Opportunity on Nov. 11th, 2017, about a week before Opportunity’s eighth Martian winter solstice. Credits: NASA/JPL-Caltech/Cornell Univ./Arizona State Univ

Five months ago, the rover entered the top of the valley, which runs eastward down the inner slope of the Endurance Crater’s western rim. Since that time, Opportunity has been conducting stops between drives at north-facing sites, which are situated along the southern edge of the channel. The rover team calls the sites “lily pads”, since these places are spots that the rover need to hop across during its mission.

This is necessary, given that Opportunity does not rely on a radioisotope thermoelectric generator like Curiosity does. While winter conditions affect the use of electrical heaters and batteries on both rovers, Opportunity is different in that it’s activities are more subject to seasonal change. Whereas Curiosity will simply allocate less energy to performing tasks in the winter, Opportunity needs to pick its routes to ensure it stays powered up.

During some of its previous winters, the Opportunity rover was not as well-situated as it currently is. During its fifth winter (2011-2012) the rover spent 19 weeks at one spot because no other places that allowed for a northward-facing tilt were available within driving distance. On the other hand, its first winter (2004-2005) was spent in the southern half of the Endurance Crater, where all grounds are favorable since they face north.

As the person who is chiefly responsible for advising other mission scientists on how much energy Opportunity has available on each Martian day (sol) for conducting activities like driving and observing – a task she performs for Curiosity as well – Herman understand the relationship between power usage and the seasons all too well. “Relying on solar energy for Opportunity keeps us constantly aware of the season on Mars and the terrain that the rover is on, more than for Curiosity,” she said.

A self-portrait of the Opportunity rover shortly after dust cleared its solar panels in March 2014. Credit: NASA/JPL-Caltech/Cornell Univ./Arizona State Univ.

Another factor which can influence Opportunity‘s power supply is how much dust is in the sky and how much of it gets onto the rover’s solar arrays. This is highly-dependent on prevailing wind conditions, which can both stir up dust storms and clear away dust deposits on the rover – basically, they are a real mixed blessing! During autumn and winter in the southern-hemisphere, the skies are generally clear where Opportunity operates.

Spring and summer is when the storms are most common in Mars’ southern hemisphere, though they don’t happen every year. The latest example took place in 2007, which led to a severe reduction in the amount of sunlight (and hence, solar energy) Spirit and Opportunity were able to receive. This required both rovers to enact emergency protocols and reduce the amount of operations and communications they conducted.

The amount of dust on the rover’s solar arrays going into autumn can also vary from year to year. This year, the array was dustier than in all but one of the previous Martian autumns it experienced. Luckily, as Herman explained, things worked out for the rover:

“We were worried that the dust accumulation this winter would be similar to some of the worst winters we’ve had, and that we might come out of the winter with a very dusty array, but we’ve had some recent dust cleaning that was nice to see. Now I’m more optimistic. If Opportunity’s solar arrays keep getting cleaned as they have recently, she’ll be in a good position to survive a major dust storm. It’s been more than 10 Earth years since the last one and we need to be vigilant.”

Image of the Opportunity rover’s front wheel, taken on June 9th, 2004, inside the Endurance Crater. Credit: NASA/JPL/Cornell

In the coming months, the Opportunity team hopes to investigate how the Perseverance Valley was cut into the rim of the Endeavor crater. As Matt Golombek, an Opportunity Project Scientist at JPL, related:

“We have not been seeing anything screamingly diagnostic, in the valley itself, about how much water was involved in the flow. We may get good diagnostic clues from the deposits at the bottom of the valley, but we don’t want to be there yet, because that’s level ground with no more lily pads.”

With its eighth winter finished and Opportunity still in good working order, we can expect the tenacious rover to keep turning up interesting finds on Mars. These include clues about Mars’ warmer, wetter past, which likely included a standing body of water in the Endeavor crater. And assuming conditions are favorable in the coming year, we can expect that Opportunity will continue to push the boundaries of both science and its own endurance!

Further Reading: NASA

Meteors Explode from the Inside When They Reach the Atmosphere

According to a new study, meteors may be less dangerous than we thought, thanks to Earth's atmosphere. Credit: David A Aguilar (CfA).

Earth is no stranger to meteors. In fact, meteor showers are a regular occurrence, where small objects (meteoroids) enter the Earth’s atmosphere and radiate in the night sky. Since most of these objects are smaller than a grain of sand, they never reach the surface and simply burn up in the atmosphere. But every so often, a meteor of sufficient size will make it through and explode above the surface, where it can cause considerable damage.

A good example of this is the Chelyabinsk meteoroid, which exploded in the skies over Russia in February of 2013. This incident demonstrated just how much damage an air burst meteorite can do and highlighted the need for preparedness. Fortunately, a new study from Purdue University indicates that Earth’s atmosphere is actually a better shield against meteors than we gave it credit for.

Their study, which was conducted with the support of NASA’s Office of Planetary Defense, recently appeared in the scientific journal Meteoritics and Planetary Science – titled “Air Penetration Enhances Fragmentation of Entering Meteoroids. The study team consisted of Marshall Tabetah and Jay Melosh,  a postdoc research associate and a professor with the department of Earth, Atmospheric and Planetary Sciences (EAPS) at Purdue University, respectively.

In the past, researchers have understood that meteoroids often explode before reaching the surface, but they were at a loss when it came to explaining why. For the sake of their study, Tabetah and Melosh used the Chelyabinsk meteoroid as a case study to determine exactly how meteoroids break up when they hit our atmosphere. At the time, the explosion came as quite the a surprise, which was what allowed for such extensive damage.

When it entered the Earth’s atmosphere, the meteoroid created a bright fireball and exploded minutes later, generating the same amount of energy as a small nuclear weapon. The resulting shockwave blasted out windows, injuring almost 1500 people and causing millions of dollars in damages. It also sent fragments hurling towards the surface that were recovered, and some were even used to fashion medals for the 2014 Sochi Winter Games.

But what was also surprising was how much of the meteroid’s debris was recovered after the explosion. While the meteoroid itself weighed over 9000 metric tonnes (10,000 US tons), only about 1800 metric tonnes (2,000 US tons) of debris was ever recovered. This meant that something happened in the upper atmosphere that caused it to lose the majority of its mass.

Looking to solve this, Tabetah and Melosh began considering how high-air pressure in front of a meteor would seep into its pores and cracks, pushing the body of the meteor apart and causing it to explode. As Melosh explained in a Purdue University News press release:

“There’s a big gradient between high-pressure air in front of the meteor and the vacuum of air behind it. If the air can move through the passages in the meteorite, it can easily get inside and blow off pieces.”

The two main smoke trails left by the Russian meteorite as it passed over the city of Chelyabinsk. Credit: AP Photo/Chelyabinsk.ru

To solve the mystery of where the meteoroid’s mass went, Tabetah and Melosh constructed models that characterized the entry process of the Chelyabinsk meteoroid that also took into account its original mass and how it broke up upon entry. They then developed a unique computer code that allowed both solid material from the meteoroid’s body and air to exist in any part of the calculation. As Melosh indicated:

“I’ve been looking for something like this for a while. Most of the computer codes we use for simulating impacts can tolerate multiple materials in a cell, but they average everything together. Different materials in the cell use their individual identity, which is not appropriate for this kind of calculation.”

This new code allowed them to fully simulate the exchange of energy and momentum between the entering meteoroid and the interacting atmospheric air. During the simulations, air that was pushed into the meteoroid was allowed to percolate inside, which lowered the strength of the meteoroid significantly. In essence, air was able to reach the insides of the meteoroid and caused it to explode from the inside out.

This not only solved the mystery of where the Chelyabinsk meteoroid’s missing mass went, it was also consistent with the air burst effect that was observed in 2013. The study also indicates that when it comes to smaller meteroids, Earth’s best defense is its atmosphere. Combined with early warning procedures, which were lacking during the Chelyabinsk meteroid event, injuries can be avoided in the future.

This is certainly good news for people concerned about planetary protection, at least where small meteroids are concerned. Larger ones, however, are not likely to be affected by Earth’s atmosphere. Luckily, NASA and other space agencies make it a point to monitor these regularly so that the public can be alerted well in advance if any stray too close to Earth. They are also busy developing counter-measures in the event of a possible collision.

Further Reading: Purdue University, Meteoritics & Planetary Science

86 Stars Just got Official Names from the IAU

The two brightest stars of the Centaurus constellation - (left) Alpha Centauri and (right) Beta Centauri. The faint red star in the center of the red circle is Proxima Centauri. Credit: Wikipedia Commons/Skatebiker

What springs to mind when we think of the most commonly-known stars in the night sky? Chances are, it would be stars like Sirius, Vega, Deneb, Rigel, Betelgeuse, Polaris, and Arcturus – all of which derive their names from Arabic, Greek or Latin origins. Much like the constellations, these names have been passed down from one astronomical tradition to another and were eventually adopted by the International Astronomical Union (IAU).

But what about the astronomical traditions of Earth’s many, many other cultures? Don’t the names they applied to heavens also deserve mention? According to the IAU, they do indeed! After a recent meeting by the Working Group on Star Names (WGSN), the IAU formally adopted 86 new names for stars drawn largely from the Australian Aboriginal, Chinese, Coptic, Hindu, Mayan, Polynesian, and South African peoples.

The WGSN is an international group of astronomers tasked with cataloging and standardizing the star names used by the international astronomical community. This job entails establishing IAU guidelines for the proposals and adoption of names, searching through international historical and literary sources for star names, adopting names of unique historical and cultural value, and maintaining and disseminating the official IAU star catalog.

Star map painting by Senior Wardaman Elder Bill Yidumduma Harney, featuring the Milky Way, the Moon, and ancestor spirits. Credit: IAU

Last year, the WGSN approved the names for 227 stars. With these latest additions, the catalog now contains the names of 313 stars. Unlike standard star catalogs containing millions or billions of stars designated using strings of letters and numbers, the IAU star catalog consists of bright stars with proper names derived from historical and cultural sources. As Eric Mamajek, chair and organizer of the WGSN, indicated in an IAU press release:

The IAU Working Group on Star Names is researching traditional star names from cultures around the world and adopting unique names and spellings to avoid confusion in astronomical catalogues and star atlases. These names help ensure that intangible astronomical heritage from skywatchers around the world, and across the centuries, are preserved for use in an era of exoplanetary systems.

A total of eleven Chinese star names were incorporated into the catalog, three of which are derived from the “lunar mansions” of traditional Chinese astronomy. This refers to vertical strips of the sky that act as markers for the progress of the Moon across the sky in the course of a year. In this sense, they provide a basis for the lunar calendar in the same way that the zodiac worked for Western calendars.

Two names were derived from the ancient Hindu lunar mansions as well. These stars are Revati and Bharani, which designate Zeta Piscium and 41 Arietis, respectively. In addition to being a lunar mansion, Revati was also the daughter of King Kakudmi in Hindu mythology and the consort of the God Balarama – the elder brother of Krishna. On the other hand, Bharani is the name for the second lunar mansion in Hindu astronomy and is ruled by Shurka (Venus).

Position of the Hindu Nakshatra Mandala, the “lunar mansions” in Hindu mythology. Credit: Wikipedia Commons/ Kishorekumar 62

Beyond the astronomical traditions of India and China, there are also two names adopted from the Khoikhoi people of South Africa and the people of Tahiti – Xamidimura and Pipirima. These names were approved for Mu¹ and Mu² Scorpii, the stars that make up a binary system located in the constellation of Scorpius. Xamidimura is derived from the Khoikhoi name for the star xami di mura – literally “eyes of the lion.”

Pipirima refers to the inseparable twins from Tahitian mythology, a boy and a girl who ran away from their parents and became stars in the night sky. Then you have the Yucatec Mayan name Chamukuy, a small bird that now designates the star Theta-2 Tauri, which is located in the Hyades star cluster in Taurus.

Four Aboriginal Australian star names were also added to the catalog, including the Wardaman names Larawag, Ginan, and Wurren and the Boorong name Unurgunite. These names now designate Epsilon Scorpii, Epsilon Crucis, Zeta Pheonicis, and Sigma Canis Majoris, respectively. Given that Aboriginal Australians have traditions that go back as far as 65,000 years, these names are some of the oldest in existence.

The brightest star to receive a new name was Alsephina, which was given to the star previously designated as Delta Velorum. The name stems from the Arabic name al-safinah (“the ship”), which refers to the ancient Greek constellation Argo Navis (the ship of the Argonauts). This name goes back to the 10th-century Arabic translation of the Almagest, which was compiled by Ptolemy in the 2nd century CE.

Artist’s concept of exoplanets orbiting a red dwarf star. Credit: NASA/JPL-Caltech

The new catalog also includes Barnard’s Star, a name that has been in common usage for about a century but was never an official designation. This red dwarf star, which is less than six light-years from Earth, is named after the astronomer who discovered it – Edward Emerson Barnard – in 1916. It now joins Alsafi (Sigma Draconis), Achird (Eta Cassiopeiae), and Tabit (Pi-3 Orionis) as being one of four nearby stars whose proper names were approved in 2017.

One of the hallmarks of modern astronomy is how naming conventions are moving away from traditional Western and Classical sources and broadening to become more worldly. In addition to being a more inclusive, multicultural approach, it reflects the spirit of modern astronomical research and space exploration, which is characterized by international cooperation.

Someday, assuming our progeny ever go forth and begin to colonize distant star systems, we can expect that the stars and planets they come to know will have names that reflect the diverse astronomical traditions of Earth’s many cultures.

Further Reading: IAU

New Map Shows the Motion of all the Galaxies in Our Supercluster

A mosaic of telescopic images showing the galaxies of the Virgo Supercluster. It's part of the cosmic web in which a galaxy can exist during part of its evolution. Credit: NASA/Rogelio Bernal Andreo

For almost a century, astronomers have understood that the Universe is in a state of expansion. This is a consequence of General Relativity, and the rate at which it is expanding is known as the Hubble Constant – named after the man who first noticed the phenomena. However, astronomers have also learned that withing the large-scale structures of the Universe, galaxies and clusters have also been moving closer and relative to one other.

For decades, astronomers have sought to track how these movements have taken place over the course of cosmic history. And thanks to the efforts of international team of astronomers, the most detailed map to date of the orbits of galaxies that lie within the Virgo Supercluster has been created. This map encompasses the past motions of almost 1,400 galaxies within 100 million light years of space, showing how our cosmic neighborhood has changed.

The study which details their research recently appeared in The Astrophysical Journal under the title “Action Dynamics of the Local Supercluster“. Led by Edward J. Shaya of the University of Maryland, the team included members from the UH Institute of Astronomy, the Racah Institute of Physics in Jerusalem, and the Institute for Research of the Fundamental Laws of the Universe (IRFU) in Paris.

Orbits of galaxies in the Local Supercluster. Credit: Brent Tully.

For the sake of their study, the team used data from the CosmicFlows surveys, a series of three studies that calculated the distance and speed of neighboring galaxies between 2011 and 2016. Several members of the study team were involved in these surveys, which they then paired with other distance and gravity field estimates to construct a massive flow study of the Virgo Supercluster.

From this, they were able to create computer models that charted the motions of almost 1,400 galaxies within 100 million light years, and over the course of 13 billion years (just 800 million years after the Big Bang). As Brent Tully, an astronomer with the UH Institute of Astronomy and a co-author on the study, explained in a UH press release:

“For the first time, we are not only visualizing the detailed structure of our Local Supercluster of galaxies but we are seeing how the structure developed over the history of the universe. An analogy is the study of the current geography of the Earth from the movement of plate tectonics.”

What they found was that their models fit the present day velocity flow well, meaning that the structures and speeds they observed in their models fit with what has been observed from galaxies in the present day. They also determined that within the area of space they mapped, the main gravitational attractor is the Virgo Cluster – which is located about 50 million light years away and contains between 1300 and 2000 galaxies.

Moreover, their study indicated that more than a thousand galaxies have fallen into the Virgo Cluster in the past 13 billion years, while all galaxies within 40 million light-years of the cluster will eventually be captured. At present, the Milky Way lies just outside this capture zone, but both the Milky Way and the Andromeda Galaxy are destined to merge in the next 4 billion years.

Once they do, the fate of the resulting massive galaxy will be similar to the rest of the galaxies in the area of study. This was another takeaway from the study, where the team determined that these merger events are merely part of a larger pattern. Basically, within the region of space they observed, there are two overarching flow patterns. Within one hemisphere of this region, all galaxies – including the Milky Way – are streaming towards a single flat sheet.

At the same time, every galaxy over the entire volume of space is moving towards gravitational attractors that are located far beyond the area of study. They determined that these outside forces are none other than the Centaurus Supercluster – a cluster of hundreds of galaxies, located approximately 170 million light years away in the Centaurus constellation – and the Great Attractor.

The Great Attractor is located 150 million light years away, and is a mysterious region that cannot be seen because of its location (on the opposite side of the Milky Way). However, for decades, scientists have known that our galaxy and other nearby galaxies are moving towards it. The region is also the core of the Laniakea Supercluster, a region that spans more than 500 million light-years and contains about 100,000 large galaxies.

In short, while the Universe is in a state of expansion, the dynamics of galaxies and galaxy clusters indicate that they still gravitate into tighter structures.  Within our cosmic neighborhood, the main attractor is clearly the Virgo Cluster, which is affecting all galaxies within a 40 million light-year radius. Beyond this, it is the Centaurus Supercluster and the Great Attractor (as part of the larger Laniakea Supercluster) that is tugging at our strings.

By charting this process of attraction that has been taking place over the past 13 billion years, astronomers and cosmologists are able to see just how our Universe has evolved over the course of the majority of its history. With time, and improved instruments that are capable of looking even deeper into the cosmos (such as the James Webb Space Telescope) we are expected to be able to probe even further back towards the beginning of the cosmos.

Charting how our Universe has changed over time not only confirms our cosmological models and verifies predominant theories about how matter behaves on the largest of scales (i.e. General Relativity). It also allows scientists to predict the future of our Universe with a fair degree of certainty, modelling how galaxies and superclusters will eventually come together to form even larger structures.

The team also created a video showing the results of their study, as well as an interactive model that let’s users examine the frame of reference from multiple vantage points. Be sure to check out the video below, and head on over to the UH page to access their interactive model.

Further Reading: University of Hawaii, The Astrophysical Journal

Breakthrough Listen is Going to Scan ‘Oumuamua, You Know, Just to be Sure it’s Just an Asteroid and Not a Spaceship.

Artist’s impression of the first interstellar asteroid/comet, "Oumuamua". This unique object was discovered on 19 October 2017 by the Pan-STARRS 1 telescope in Hawaii. Credit: ESO/M. Kornmesser

On October 19th, 2017, the Panoramic Survey Telescope and Rapid Response System-1 (Pan-STARRS-1) in Hawaii announced the first-ever detection of an interstellar asteroid, named 1I/2017 U1 (aka. ‘Oumuamua). Based on subsequent measurements of its shape (highly elongated and thin), there was some speculation that it might actually be an interstellar spacecraft (the name “Rama” ring a bell?).

For this reason, there are those who would like to study this object before it heads back out into interstellar space. While groups like Project Lyra propose sending a mission to rendezvous with it, Breakthrough Initiatives (BI) also announced its plans to study the object using Breakthrough Listen. As part of its mission to search for extra-terrestrial communications, this project will use the Greenbank Radio Telescope to listen to ‘Oumuamua for signs of radio transmissions.

Observations of ‘Oumuamua’s orbit revealed that it made its closest pass to our Sun back in September of 2017, and has been on its way back to interstellar space ever since. When it was observed back in October, it was passing Earth at a distance of about 85 times the distance between Earth and the Moon, and was traveling at a peak velocity of about 315,430 km/h (196,000 mph).

This indicated that, unlike the many Near-Earth Objects (NEOs) that periodically cross Earth’s orbit, this asteroid was not gravitationally bound to the Sun. In November, astronomers using the ESO’s Very Large Telescope (VLT) at the Paranal Observatory in Chile were also able to determine the brightness and color of the asteroid, which allowed for precise calculations of its size and shape.

Basically, they determined that it was 400 meters (1312 ft) long and very narrow, indicating that it was shaped somewhat like a cigar. What’s more, the idea of a cigar or needle-shaped spacecraft is a time-honored concept when it comes to science fiction and space exploration. Such a ship would minimize friction and damage from interstellar gas and dust, and could rotate to provide artificial gravity.

For all of these reasons, it is understandable why some responded to news of this asteroid by making comparisons to a certain science fiction novel. That would be Arthur C. Clarke’s Rendezvous with Rama, a story of a cylindrical space ship that travels through the Solar System while on its way to another star. While a natural origin is the more likely scenario, there is no consensus on what the origin this object might be – other than the theory that it came from the direction of Vega.

Hence why Breakthrough Listen intends to explore ‘Oumuamua to determine whether it is truly an asteroid or an artifact. Established in January of 2016, Listen is the largest scientific research program aimed at finding evidence of extra-terrestrial intelligence with established SETI methods. These include using radio observatories to survey 1,000,000 of the closest stars (and 100 of the closest galaxies) to Earth over the course of ten years.

Breakthrough Listen will monitor the 1 million closest stars to Earth over a ten year period. Credit: Breakthrough Initiatives

Listen’s observation campaign will begin on Wednesday, December 13th, at 3:00 pm EST (12:00 PST), using the Greenbank Radio Telescope. This 100-meter telescope is the world’s premiere single-dish radio telescope and is capable of operating at millimeter and submillimeter wavelengths. It is also the mainstay of the NSF-funded Green Bank Observatory, located in West Virginia.

The first phase of observations will last a total of 10 hours, ranging from the 1 to 12 GHz bands, and will broken down into four “epochs” (based on the object’s rotational period). At present, ‘Oumuamua is about 2 astronomical units (AUs) – or 299,200,000 km; 185,900,000 mi – away from Earth, putting it at twice the distance between the Earth and the Sun. This places it well beyond the orbit of Mars, and over halfway between Mars and Jupiter.

At this distance, the Green Bank Telescope will take less than a minute to detect an omni-directional transmitter with the power of a cellphone. In other words, if there is a alien signal coming from this object, Breakthrough Listen is sure to sniff it out in no time! As Andrew Siemion, Director of Berkeley SETI Research Center and a member of Breakthrough Listen, explained in a BI press statement:

“‘Oumuamua’s presence within our solar system affords Breakthrough Listen an opportunity to reach unprecedented sensitivities to possible artificial transmitters and demonstrate our ability to track nearby, fast-moving objects. Whether this object turns out to be artificial or natural, it’s a great target for Listen.”

Even if there are no signals to be heard, and no other evidence of extra-terrestrial intelligence is detected, the observations themselves are a opportunity for scientists and the field of radio astronomy in general. The project will observe ‘Oumuamua in portions of the radio spectrum that it has not yet been observed at, and is expected to yield information about the possibility of water ice or the presence of a “coma” (i.e. gaseous envelop) around the object.

During the previous survey, data gathered using the VLT’s FOcal Reducer and low dispersion Spectrograph (FORS) indicated that ‘Oumuamua was likely a dense and rocky asteroid with a high metal content and little in the way of water ice. Updated information provided by the Greenbank Telescope could therefore confirm or cast doubt on this, thus reopening the possibility that it is actually a comet.

Regardless of what it finds, this survey is likely to be a feather in the cap of Breakthrough Listen, which already demonstrated it’s worth in terms of non-SETI astronomy this past summer. At that time, and using the Green Bank Radio Telescope, the Listen science team at UC Berkeley observed 15 Fast Radio Bursts (FRBs) for the fist time coming from a dwarf galaxy three billion light-years from Earth.

Still, I think we can all agree that an extra-terrestrial spaceship would be the most exciting possibility (and perhaps the most frightening!). And it is very safe to say that some of us will be awaiting the results of the survey with baited breath. Luckily, we’ll only have to wait two more days to see if humanity is still alone in the Universe or not! Stay tuned!

Further Reading: Breakthrough Initiatives

Too Big, Too Soon. Monster Black Hole Seen Shortly After the Big Bang

This artist's concept shows the most distant supermassive black hole ever discovered. It is part of a quasar from just 690 million years after the Big Bang. Credit: Robin Dienel/Carnegie Institution for Science

It is a well known fact among astronomers and cosmologists that the farther into the Universe you look, the further back in time you are seeing. And the closer astronomers are able to see to the Big Bang, which took place 13.8 billion years ago, the more interesting the discoveries tend to become. It is these finds that teach us the most about the earliest periods of the Universe and its subsequent evolution.

For instance, scientists using the Wide-field Infrared Survey Explorer (WISE) and the Magellan Telescopes recently observed the earliest Supermassive Black Hole (SMBH) to date. According to the discovery team’s study, this black hole is roughly 800 million times the mass of our Sun and is located more than 13 billion light years from Earth. This makes it the most distant, and youngest, SMBH observed to date.

The study, titled “An 800-million-solar-mass black hole in a significantly neutral Universe at a redshift of 7.5“, recently appeared in the journal Nature. Led by Eduardo Bañados, a researcher from the Carnegie Institution for Science, the team included members from NASA’s Jet Propulsion Laboratory, the Max Planck Institute for Astronomy, the Kavli Institute for Astronomy and Astrophysics, the Las Cumbres Observatory, and multiple universities.

Artist’s impression of ULAS J1120+0641, a very distant quasar powered by a black hole with a mass two billion times that of the Sun. Credit: ESO/M. Kornmesser

As with other SMBHs, this particular discovery (designated J1342+0928) is a quasar, a class of super bright objects that consist of a black hole accreting matter at the center of a massive galaxy. The object was discovered during the course of a survey for distant objects, which combined infrared data from the WISE mission with ground-based surveys. The team then followed up with data from the Carnegie Observatory’s Magellan telescopes in Chile.

As with all distant cosmological objects,  J1342+0928’s distance was determined by measuring its redshift. By measuring how much the wavelength of an object’s light is stretched by the expansion of the Universe before it reaches Earth, astronomers are able to determine how far it had to travel to get here. In this case, the quasar had a redshift of 7.54, which means that it took more than 13 billion years for its light to reach us.

As Xiaohui Fan of the University of Arizona’s Steward Observatory (and a co-author on the study) explained in a Carnegie press release:

“This great distance makes such objects extremely faint when viewed from Earth. Early quasars are also very rare on the sky. Only one quasar was known to exist at a redshift greater than seven before now, despite extensive searching.”

Given its age and mass, the discovery of this quasar was quite the surprise for the study team. As Daniel Stern, an astrophysicist at NASA’s Jet Propulsion Laboratory and a co-author on the study, indicated in a NASA press release, “This black hole grew far larger than we expected in only 690 million years after the Big Bang, which challenges our theories about how black holes form.”

This illustration shows the evolution of the Universe, from the Big Bang on the left, to modern times on the right. Image: NASA

Essentially, this quasar existed at a time when the Universe was just beginning to emerge from what cosmologists call the “Dark Ages”. During this period, which began roughly 380,000 years to 150 million years after the Big Bang, most of the photons in the Universe were interacting with electrons and protons. As a result, the radiation of this period is undetectable by our current instruments – hence the name.

The Universe remained in this state, without any luminous sources, until gravity condensed matter into the first stars and galaxies. This period is known as the “Reinozation Epoch”, which lasted from 150 million to 1 billion years after the Big Bang and was characterized by the first stars, galaxies and quasars forming. It is so-named because the energy released by these ancient galaxies caused the neutral hydrogen of the Universe to get excited and ionize.

Once the Universe became reionzed, photons could travel freely throughout space and the Universe officially became transparent to light. This is what makes the discovery of this quasar so interesting. As the team observed, much of the hydrogen surrounding it is neutral, which means it is not only the most distant quasar ever observed, but also the only example of a quasar that existed before the Universe became reionized.

In other words, J1342+0928 existed during a major transition period for the Universe, which happens to be one of the current frontiers of astrophysics. As if this wasn’t enough, the team was also confounded by the object’s mass. For a black hole to have become so massive during this early period of the Universe, there would have to be special conditions to allow for such rapid growth.

A billion years after the big bang, hydrogen atoms were mysteriously torn apart into a soup of ions. Credit: NASA/ESA/A. Felid (STScI)).

What these conditions are, however, remains a mystery. Whatever the case may be, this newly-found SMBH appears to be consuming matter at the center of a galaxy at an astounding rate. And while its discovery has raised many questions, it is anticipated that the deployment of future  telescopes will reveal more about this quasar and its cosmological period. As Stern said:

“With several next-generation, even-more-sensitive facilities currently being built, we can expect many exciting discoveries in the very early universe in the coming years.”

These next-generation missions include the European Space Agency’s Euclid mission and NASA’s Wide-field Infrared Survey Telescope (WFIRST). Whereas Euclid will study objects located 10 billion years in the past in order to measure how dark energy influenced cosmic evolution, WFIRST will perform wide-field near-infrared surveys to measure the light coming from a billion galaxies.

Both missions are expected to reveal more objects like J1342+0928. At present, scientists predict that there are only 20 to 100 quasars as bright and as distant as J1342+0928 in the sky. As such, they were most pleased with this discovery, which is expected to provide us with fundamental information about the Universe when it was only 5% of its current age.

Further Reading: NASA, Carnegie Science, Nature

Earth and Venus are the Same Size, so Why Doesn’t Venus Have a Magnetosphere? Maybe it Didn’t Get Smashed Hard Enough

At a closest average distance of 41 million km (25,476,219 mi), Venus is the closest planet to Earth. Credit: NASA/JPL/Magellan

For many reasons, Venus is sometimes referred to as “Earth’s Twin” (or “Sister Planet”, depending on who you ask). Like Earth, it is terrestrial (i.e. rocky) in nature, composed of silicate minerals and metals that are differentiated between an iron-nickel core and silicate mantle and crust. But when it comes to their respective atmospheres and magnetic fields, our two planets could not be more different.

For some time, astronomers have struggled to answer why Earth has a magnetic field (which allows it to retain a thick atmosphere) and Venus do not. According to a new study conducted by an international team of scientists, it may have something to do with a massive impact that occurred in the past. Since Venus appears to have never suffered such an impact, its never developed the dynamo needed to generate a magnetic field.

The study, titled “Formation, stratification, and mixing of the cores of Earth and Venus“, recently appeared in the scientific journal Earth and Science Planetary Letters. The study was led by Seth A. Jacobson of Northwestern University, and included members from the Observatory de la Côte d’Azur, the University of Bayreuth, the Tokyo Institute of Technology, and the Carnegie Institution of Washington.

The Earth's layers, showing the Inner and Outer Core, the Mantle, and Crust. Credit: discovermagazine.com
The Earth’s layers, showing the Inner and Outer Core, the Mantle, and Crust. Credit: discovermagazine.com

For the sake of their study, Jacobson and his colleagues began considering how terrestrial planets form in the first place. According to the most widely-accepted models of planet formation, terrestrial planets are not formed in a single stage, but from a series of accretion events characterized by collisions with planetesimals and planetary embryos – most of which have cores of their own.

Recent studies on high-pressure mineral physics and on orbital dynamics have also indicated that planetary cores develop a stratified structure as they accrete. The reason for this has to do with how a higher abundance of light elements are incorporated in with liquid metal during the process, which would then sink to form the core of the planet as temperatures and pressure increased.

Such a stratified core would be incapable of convection, which is believed to be what allows for Earth’s magnetic field. What’s more, such models are incompatible with seismological studies that indicate that Earth’s core consists mostly of iron and nickel, while approximately 10% of its weight is made up of light elements – such as silicon, oxygen, sulfur, and others. It’s outer core is similarly homogeneous, and composed of much the same elements.

As Dr. Jacobson explained to Universe Today via email:

“The terrestrial planets grew from a sequence of accretionary (impact) events, so the core also grew in a multi-stage fashion. Multi-stage core formation creates a layered stably stratified density structure in the core because light elements are increasingly incorporated in later core additions. Light elements like O, Si, and S increasingly partition into core forming liquids during core formation when pressures and temperatures are higher, so later core forming events incorporate more of these elements into the core because the Earth is bigger and pressures and temperatures are therefore higher.

“This establishes a stable stratification which prevents a long-lasting geodynamo and a planetary magnetic field. This is our hypothesis for Venus. In the case of Earth, we think the Moon-forming impact was violent enough to mechanically mix the core of the Earth and allow a long-lasting geodynamo to generate today’s planetary magnetic field.”

To add to this state of confusion, paleomagnetic studies have been conducted that indicate that Earth’s magnetic field has existed for at least 4.2 billion years (roughly 340 million years after it formed). As such, the question naturally arises as to what could account for the current state of convection and how it came about. For the sake of their study, Jacobson and his team considering the possibility that a massive impact could account for this. As Jacobson indicated:

“Energetic impacts mechanically mix the core and so can destroy stable stratification. Stable stratification prevents convection which inhibits a geodynamo. Removing the stratification allows the dynamo to operate.”

Basically, the energy of this impact would have shaken up the core, creating a single homogeneous region within which a long-lasting geodynamo could operate. Given the age of Earth’s magnetic field, this is consistent with the Theia impact theory, where a Mars-sized object is believed to have collided with Earth 4.51 billion years ago and led to the formation of the Earth-Moon system.

This impact could have caused Earth’s core to go from being stratified to homogeneous, and over the course of the next 300 million years, pressure and temperature conditions could have caused it to differentiate between a solid inner core and liquid outer core. Thanks to rotation in the outer core, the result was a dynamo effect that protected our atmosphere as it formed.

Artist’s concept of a collision between proto-Earth and Theia, believed to happened 4.5 billion years ago. Credit: NASA

The seeds of this theory were presented last year at the 47th Lunar and Planetary Science Conference in The Woodlands, Texas. During a presentation titled “Dynamical Mixing of Planetary Cores by Giant Impacts“, Dr. Miki Nakajima of Caltech – one of the co-authors on this latest study – and David J. Stevenson of the Carnegie Institution of Washington. At the time, they indicated that the stratification of Earth’s core may have been reset by the same impact that formed the Moon.

It was Nakajima and Stevenson’s study that showed how the most violent impacts could stir the core of planets late in their accretion. Building on this, Jacobson and the other co-authors applied models of how Earth and Venus accreted from a disk of solids and gas about a proto-Sun. They also applied calculations of how Earth and Venus grew, based on the chemistry of the mantle and core of each planet through each accretion event.

The significance of this study, in terms of how it relates to the evolution of Earth and the emergence of life, cannot be understated. If Earth’s magnetosphere is the result of a late energetic impact, then such impacts could very well be the difference between our planet being habitable or being either too cold and arid (like Mars) or too hot and hellish (like Venus). As Jacobson concluded:

“Planetary magnetic fields shield planets and life on the planet from harmful cosmic radiation. If a late, violent and giant impact is necessary for a planetary magnetic field then such an impact may be necessary for life.”

Looking beyond our Solar System, this paper also has implications in the study of extra-solar planets. Here too, the difference between a planet being habitable or not may come down to high-energy impacts being a part of the system’s early history. In the future, when studying extra-solar planets and looking for signs of habitability, scientists may very well be forced to ask one simple question: “Was it hit hard enough?”

Further Reading: Earth Science and Planetary Letters